Strategy & Operations (S&O) is the engine that drives the DoorDash business forward, focused on launching new geographies and products, while building and testing the strategic plans at every step. DoorDash embraces and invests in this function because of our belief in an ownership mentality — our employees can develop the strategy and execute it.
Join us at our upcoming event on October 4th, as five S&O leaders from across our organization will come together to share their journeys to building their professional brands and discuss how the work they have done at DoorDash has impacted that journey.
Attendees at the event will hear from: Caitlin Palmer, Sr. Director, Restaurant Platform
Caitlin has been at DoorDash for six years. She is the GM of our Restaurant Platform, our white label business that offers merchants products & services to help them grow their own business. Examples of products in her portfolio include DoorDash Drive (white label delivery), Storefront (online-ordering) and BBOT (order & pay at table).
Prior to DoorDash, she worked at a number of companies across the spectrum — small & large — in a variety of growth, strategy & general management roles. She received her MBA at Harvard Business School and her BA from Bucknell University. She lives in New Jersey with her two young children, Charlie & Nellie and her crazy dog, Oscar.
Jenae Keith, Sr. Manager, New Verticals
Jenae joined DoorDash in 2021 and is currently a Senior Manager in the New Verticals organization. Over the past two years, she has led two workstreams to launch and expand new categories like alcohol at DashMart, and more recently has helped to kick off a new workstream to increase space utilization within DashMart. Whether it is navigating tricky regulatory nuances related to new products, or getting in the weeds to understand how to optimize warehouse space, Jenae really enjoys working with talented teams to solve complex problems and build solutions that help DashMart grow.
Before joining DoorDash, Jenae spent five years at Deloitte & Touche LLP within the Risk & Financial Advisory practice. Jenae graduated from Rutgers Business School and is a proud New Jerseyian where she lives with her dog, Jersey.
Jonatan is the Manager of DashMart’s Employee Experience team, where he oversees the operations and strategic development of a team of employee experience strategists. Together, they support a large network of employees across the DashMart ecosystem by designing solutions and services that enhance employee engagement, build a sense of belonging, and unlock opportunities for personal and professional fulfillment.
Prior to DoorDash, Jonatan oversaw the routines, structures, and resources to ensure consistent employee experiences across the global organization for Workday. He started his career at Uber, where he held multiple roles in Customer Service, Operations, and People Strategy – ultimately blending his superpowers in operations and strategy through his passion of creating positive workplaces for every employee to feel heard, engaged, and empowered to be their best selves.
“Every morning, it’s not that I have to go work, I get to do something I love doing and I could dedicate my whole life doing this,” he shares.
Ruth Isenstadt, Sr. Director, Merchant Strategy and Operations
Ruth has been with DoorDash for five years, holding roles across various parts of the Merchant Organization: Account Management, IPO Readiness, New Restaurant Models, and most recently overseeing Merchant Strategy & Operations. Her current team focuses on the Acquisition, Onboarding, Experience, and Growth of restaurants on the DoorDash platform.
Prior to DoorDash, she was at Eileen Fisher as a Designer and leading Sustainable Materials R&D.
Sebastian Calvo, Sr. Manager, Fulfillment S&O
Sebastian started his career in the military, where he served as a Marine Corps Engineer officer. In the military, he held a variety of leadership roles, leading teams as large as 200 Marines, including deployments to Iraq and Afghanistan.
After leaving the military, he attended business school at NYU Stern, where he interned in management consulting. He completed his MBA, then worked in last-mile operations at Amazon, where he got to launch several new markets, products, and services.
He then worked at a delivery startup called Gopuff as a regional GM overseeing 9 west coast states. From Gopuff he came to DoorDash, where he currently leads cost/efficiency for the Drive Non-Restaurants team.
Join us on Wednesday, October 4th, from 12-1 p.m. PT (3-4 p.m. ET) to hear from these panelists. Register below today!
At DoorDash, we prioritize investing in, developing, and advancing all underrepresented groups. With our Employee Resource Groups (ERGs) being one of the flagship programs for our DEI team, we’re excited to bring together more than 100 ERG leaders from across the tech industry to learn, connect, and up level their skills as part of our first-ever ERG Summit.
The concept for the ERG Summit began as an internal event dedicated to bringing our ERG leaders together in person, providing the space to deepen community and connect with executive stakeholders for a full day of learning and development.
But when Kondja Kamatuka, our Program Lead on the DEI team, connected with others in the DEI community, the clear need to broaden the summit into an industry-wide event became evident.
“I met with Chanise Simms-Robinson, who owns Out Of Office events, and they do a lot of impactful DEI work, specifically in the Hispanic and Black communities. The more I talked to people and the more Chanise talked to people in her network, it was so clear that this is a need industry-wide within this space,” Kondja said.
“Being able to live our values like having a bias for action in launching this event and make room at the table for others in the industry, I feel like we’re moving the needle forward. That’s the biggest driver and the thing I feel the most proud of. The agenda is great, and I’m so proud to innovate in this space in a way that feels really special.”
Expanding the ERG Summit to an Out Of Office event and bringing in industry sponsorship with Amazon, Black Google Network, Jack Daniels, Snap Inc., and YouTube is a first-of-its-kind initiative for DoorDash after launching our ERG groups in 2014.
On September 14 in Los Angeles, we have a full day of programming planned (anchored in the 4-C Model), including inclusive speaker panels, hands-on engagement opportunities, learning and development, and keynote speakers.
Systemic change takes thought, effort, dedication, and it does not go unnoticed. At DoorDash, we believe in our people and will continually look for ways that we can empower and support them.
Our efforts to create a workplace where everyone feels welcomed, supported, and valued is one of the reasons we were recently recognized as one of America’s Greatest Workplaces 2023 by Newsweek. To learn more about this award and how we’ve driven the culture our employees experience over the last year, click here.
Read more about how our ERGs have driven the culture our employees experience at DoorDash:
At DoorDash, we generate supply and demand forecasts to proactively plan operations such as acquiring the right number of Dashers (delivery drivers) and adding extra pay when we anticipate low supply. It is challenging to generate accurate forecasts during holidays because certain machine learning techniques (e.g., XGBoost, Gradient Boosting, Random Forest) have difficulty handling high variation with limited data. Here we explain how we improve forecasting accuracy as we prepare for holidays with an eye toward ensuring high-quality experiences for both customers and Dashers across thousands of markets.
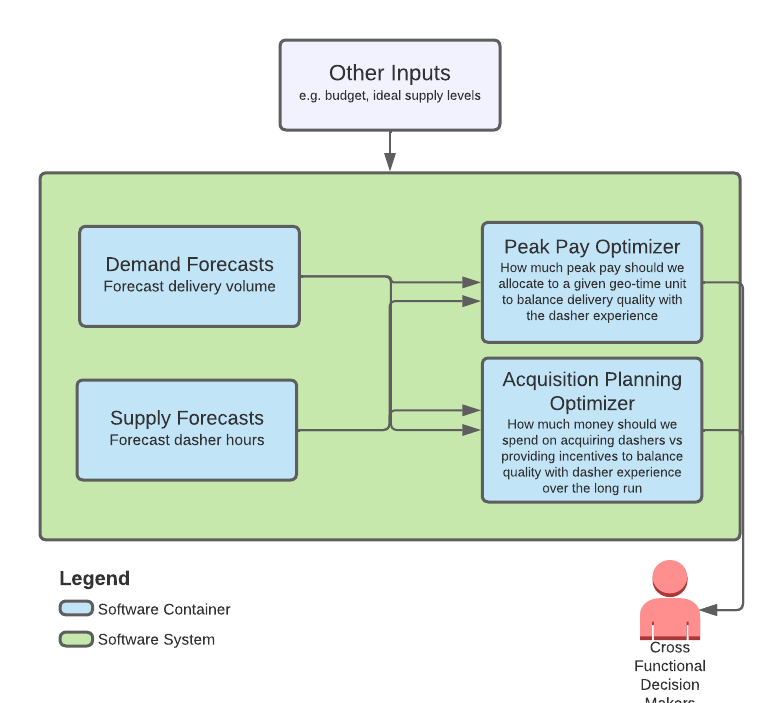
It is imperative that we take supply and demand shaping actions to reach an equilibrium that ensures quality for both customers and Dashers. Supply and demand forecasts are main inputs for our proactive mobilization systems, as shown in Figure 1 below. We use a gradient boosting machine (GBM) model to generate our forecasts across thousands of starting points — small groups of ZIP codes. For reasons we will delve into later, forecast accuracy dips around rare extreme events such as holidays. . To improve accuracy around these events, we adopted a cascade modeling approach which extends the GBM with a linear model to handle the holiday’s impact. This model architecture dramatically improves forecast accuracy on holidays.
Figure 1: Demand and Supply Forecasts Support Various Components of DoorDash Proactive Mobilization Systems
Limitations in Random Forest and Gradient Boosting Methods
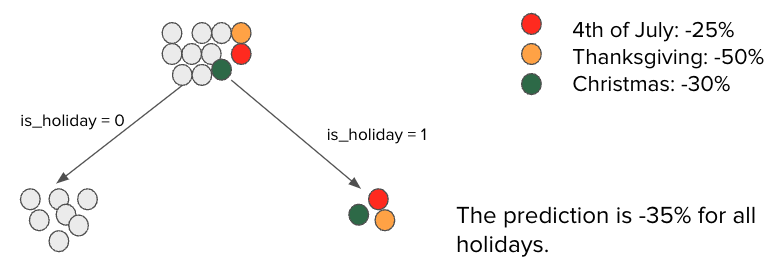
Tree-based models such as random forest and gradient boosting are popular in industry for their ease of use and high accuracy. For time-series forecasting in particular, these models capture excellent seasonality with appropriate feature encoding, handling non-linearities and, most importantly, avoiding overfitting. These strengths, however, make it challenging to handle anomalies and high variation. In particular, tree-based models fail to capture high variation during holidays even with one-hot encoding because each holiday only appears once a year. Please see a simplified example of this in Figure 2 below.
The figure shows how a tree assigns different root node observations to its final nodes, or leaves, when trying to minimize the loss function and avoid overfitting. Assume that our dataset contains holiday observations, represented by colored dots, where order volume decreases in large amounts — for instance, a 50% decline on Thanksgiving Day when compared to regular days, shown as gray dots. When we train the model to minimize the loss function and avoid overfitting simultaneously, the extreme observations will end up under the same final node. In this scenario, the prediction for a holiday will be a simple average of all holidays in the final node (i.e., -35%), which generates a significant error of -10% for the Fourth of July holiday and +15% for Thanksgiving. In other words, we over-forecast for the Fourth of July and Christmas, while under-forecasting for Thanksgiving.
Figure 2: Tree-Based Model Cannot Generate Accurate Forecasts for Holidays
Overview of the Cascade Modeling Approach
Over the years, machine learning practitioners have developed architectures and design patterns, including reframing, rebalancing, and multilabel ensembles to address the limitations of ML models. A common approach is to deploy a cascade design pattern when the underlying ML problem can be divided into sub-ML problems (as seen in the book Machine Learning Design Patterns by Valliappa Lakshmanan, Sara Robinson, and Michael Munn). For instance, when dealing with a prediction problem with two different subgroups, an ML practitioner could build two models for premium versus regular customers instead of a single model for all customers. We expect the two-model solution to perform better because each model is tailored for its respective subgroup.
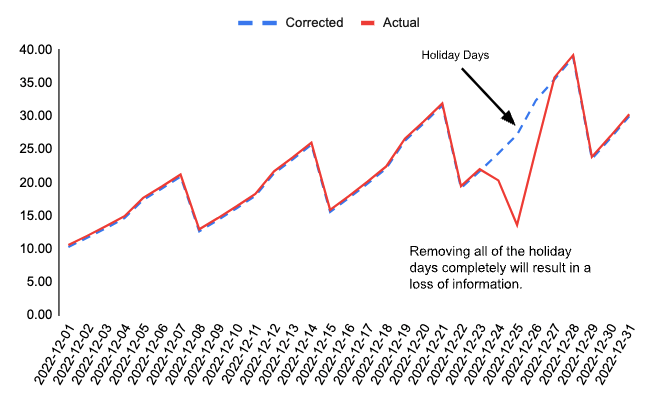
In our case, this approach could mean building two separate models — one for holidays and another for regular days. This solution, however, does not fit our framework because our problem is time-series forecasting, which is highly dependent on the most recent historical observations, as seen in Figure 3. In other words, if we have two separate models then the model for regular days would fail to generate forecasts for the week after Christmas because it would not have information from the most recent lags. To prevent losing the most recent information, we implemented an augmented version of a cascade design pattern tailored for time-series forecasting. As shown in Figure 3, instead of building two models, we correct the actual series by removing holiday impact so that recent historical information is available when producing forecasts following a holiday.
Figure 3: Cascade Design for Time-Series Data Aims to Keep Most Recent Observations After Removing Holiday Impact
Stay Informed with Weekly Updates
Subscribe to our Engineering blog to get regular updates on all the coolest projects our team is working on
Please enter a valid email address.
Thank you for Subscribing!
Implementing Cascade Approach for Supply and Demand Forecasts
We utilize the GBM model to generate supply and demand forecasts for initial points; however, we experience significant declines in accuracy during holidays. As seen in Figure 4 below, the accuracy of the GBM model, which is measured in terms of weighted mean absolute percentage error (wMAPE), deteriorates around Christmas Day.
Figure 4: Performance of GBM with Traditional Feature Engineering At/Around Holidays
To improve accuracy, we implemented the cascade approach in multiple steps.
Calculating holiday multipliers: We run a linear regression with holiday dummies for each starting point-daypart pair in our data and calculate the holiday multipliers as the coefficients for the holiday dummies. For instance, we could have a multiplier of 1.5 for Thanksgiving Day in Springfield, Ill., implying that the order volume will decrease 50% week-over-week for that starting point at the given holiday-daypart pair. We have to fit thousands of linear regressions when calculating the holiday multiplier for each starting point-daypart pair. To improve the speed and reusability, we constructed a separate framework for this step. In this framework, we leverage parallel computation in Spark and store the holiday multipliers into a table for the GBM model to use in the preprocessing step.
Preprocessing holiday multipliers and model training: We preprocess the input series — for example, number of orders — by the holiday multipliers to turn it into “holiday-free” figures, which is similar to converting actual to corrected values in Figure 3 above. For example, if the number of orders on Thanksgiving Day in Springfield was 100 in 2022, the order number becomes 150, given that the multiplier is 1.5. After preprocessing to obtain the non-holiday figures, we train and store the GBM model.
Generating forecasts and post-processing: First we generate forecasts for future dates using the trained GBM model. Because the GBM model was trained with non-holiday data, our initial forecasts do not take holidays into account. To obtain the final holiday forecast, we use the holiday multipliers that were calculated in Step 1 for post-processing. For example, if the non-holiday forecast for Thanksgiving Day is 150 and the associated multiplier is 1.5 for a given starting point, the final forecast is 100 (=150/1.5).
Figure 5: We implement the cascade model in multiple steps: [1] calculating multipliers, [2] pre-processing and training, and [3] generating forecasts and post-processing.
Mobilization System
DoorDash’s mobilization system shown in Figure 1 is a collaborative effort between operations, finance, engineering, and machine learning teams. As DoorDash grows, we wish to produce scalable ML and AI solutions that require minimal manual interventions by operations and finance teams. However, performance degradation of holiday forecasts forces us to make ad-hoc changes to the ML pipeline, consuming extra computation resources and overhead for operations and ML teams. To run flawlessly, our mobilization system needs reliable forecasts for all days of the year, including holidays. In this respect, cascade design removes another block on the roadmap to a fully automated mobilization system.
Holiday Impact Estimator in Action
DoorDash generally follows two steps before pushing a new feature or model into production:
We size the opportunity and if the movement in metrics is strong enough, we launch an experiment to ensure that the positives outweigh the negatives.
The final decision is made after analyzing experimental results; stakeholders across multiple teams must agree that the new feature adds value without degrading business metrics.
In the following section, we will go over model performance improvements, how we sized the holiday impact estimator’s impact on our production systems, problems we encountered with the experiment measuring that impact, and how we eventually overcame the challenges and got stakeholder buy-in.
Measuring Model Performance
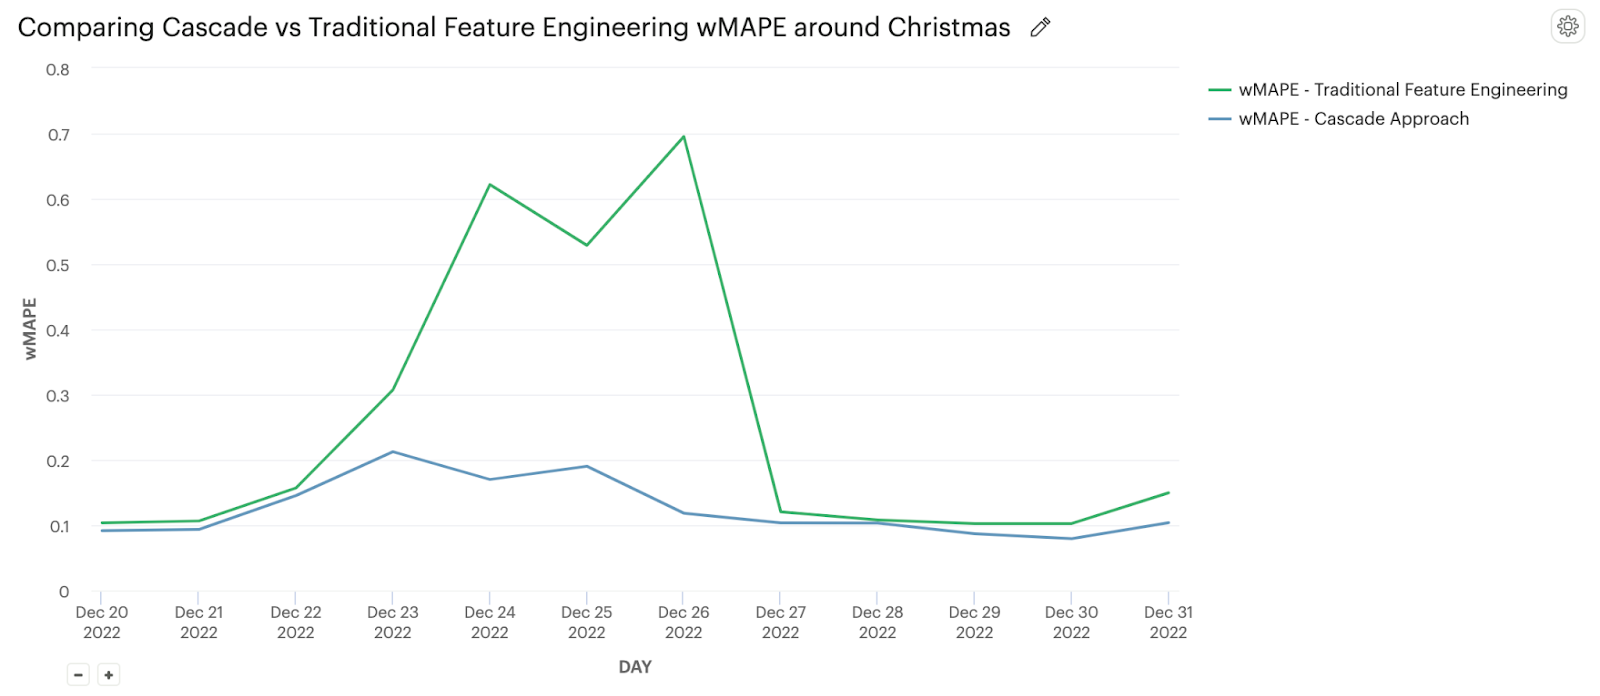
The cascade approach to modeling holiday impact proves to be a significant improvement over a simple feature engineering approach. As shown in Figure 6, wMAPE decreased from between 60% and 70% to between 10% and 20% over Christmas. Thanksgiving had a similar impact. Averaged across an entire year’s worth of holidays, we see an absolute wMAPE improvement of 10%.
The cascade model had also better performance in the days following a holiday compared to GBMs with simple feature engineering because the simple GBM carries extreme changes during holidays over into the following weeks. The cascade model generates predictions from a GBM model trained on holiday-free data without any extreme movements (see Step 2 of Figure 5 above).
Figure 6: Cascade Approach Decreases wMAPE compared to GBM with Traditional Feature Engineering
Measuring Business Impact
While a clear improvement in model performance appears to be a straightforward deployment decision without the need for experimentation, there are some important tactical considerations. Inputs can interact with systems in unexpected ways, resulting in contradictory outcomes. Take, for instance, a pay allocation system designed to hedge for situations with high forecast variance i.e. if we are unable to forecast demand well due to high underlying variance, we always add pay to account for forecast misses. Improving forecast accuracy would mean reducing forecast variance, which in turn could lead to the cessation of hedging (additional pay). Consequently, there’s a potential for the customer experience to suffer due to inadequate supply. This underscores the essential need to conduct analysis to effectively evaluate proposed changes and make changes to the system if needed.
Supply and demand forecasts have a direct impact on how much we spend around holidays to keep supply quality strong, as we discussed earlier. We ran backtests for Thanksgiving and Christmas to estimate costs and potential quality impacts. Our backtests showed that we could reduce volume lost from bad quality by ~25% over Thanksgiving and Christmas. Our next step would be to launch an experiment to solidify these estimates further and get stakeholder buy-in for shipping the new model.
The Limitations of an Experiment
The main challenge we encountered when trying to demonstrate value through an experiment was the limitation in experiment power. Most experiments at DoorDash use a switchback experiment design based on geo-time units to maximize power (here is more info on switchbacks). In this case, however, using a switchback was infeasible because of potential interference through network effects. For instance, if our treatment forecasts lead to extra pay added to a certain geography later in the day, Dashers might choose only to Dash later, or if our forecasts added pay to a neighboring starting point, Dashers might migrate there to earn extra cash.
The only feasible design option to remove these network effects would be to launch a market A/B in which one market uses the treatment forecasts while another uses the control. Market A/B design significantly reduces power because of small sample sizes, meaning we have to run such experiments for longer periods of time. Given the intermittent nature of holidays, the nature of this experiment would likely require running it over the course of at least a year to get enough power to measure impact, which is not feasible.
Consequently, we had to reframe our experiment’s goal. Rather than accurately measuring the cascade approach’s impact, we decided to focus on ensuring that it does not worsen quality. If we could keep metrics flat without seeing quality degrade across a set of selected holidays, we could then make the decision to ship.
Getting Stakeholder Buy-In
Getting finance and operation teams buy-in generally is easiest when we’re able to experimentally prove value without quality degradation. But because there are few holidays, reducing our experiment’s power, we had to take a different approach. To make a strong argument, we ran backtests across multiple holidays to get estimated improvements on quality metrics. We also used results from a market A/B experiment run across Super Bowl day, Valentine’s Day and President’s Day to show that there was no system degradation. This helped create a best-case/worst-case scenario comparison, which eased concerns that the new approach might worsen quality and the Dasher experience.
Practical Considerations of the Cascade Approach
While the cascade model performs better during holidays and generates significant accuracy improvements, they come at the expense of extra steps, including adding new models and pipelines such as calculating holiday multipliers and performing both pre- and post-processing. Even though calculating the holiday multipliers seems like an extra step, they helped us to explain the forecasts to our stakeholders, which built more trust in our models and accelerated the transition to end-to-end ML solutions with minimal manual intervention.
ML practitioners should evaluate the pros and cons before deciding to use the cascade design pattern. If the process adds significant complexity to the model architecture with only limited gains in target loss, it may not be worth the effort.
Conclusion
Tree-based models such as random forest and gradient boosting machines are widely used in the ML space for forecasting, prediction, and classification. Although the tree-based models perform well in capturing non-linear relationships, they fail to account for extreme events such as holidays. Deploying cascade design patterns for time-series forecasting during holiday periods at DoorDash has generated significant improvements in forecasting problems. We also discussed the benefits and difficulties inherent to using a pure experimentation approach. While experiments remain the gold standard for measuring impact, we sometimes need to reframe our goals or rely on backtests to make timely ship decisions.
Acknowledgements
Many thanks to Ryan Schork, Gisselle Xie, Michael Frasco, and Tim Burke for sharing their feedback on the execution of ideas in this blog post. Many thanks to Ezra Berger for continuous support, review, and editing on this article.
As DoorDash experienced rapid growth over the last few years, we began to see the limits of our traditional methods of monitoring. Metrics, logs, and traces provide vital information about our service ecosystem. But these signals almost entirely rely on application-level instrumentation, which can leave gaps or conflicting semantics across different systems. We decided to seek potential solutions that could provide a more complete and unified picture of our networking topology.
One of these solutions has been monitoring with eBPF, which allows developers to write programs that are injected directly into the kernel and can trace kernel operations. These programs, designed to provide lightweight access to most components of the kernel, are sandboxed and validated for safety by the kernel before execution. DoorDash was particularly interested in tracing network traffic via hooks called kprobes (kernel dynamic tracing) and tracepoints. With these hooks, we can intercept and understand TCP and UDP connections across our multiple Kubernetes clusters.
By building at the kernel level, we can monitor network traffic at the infrastructure level, which gives us new insights into DoorDash’s backend ecosystem that’s independent of the service workflow.
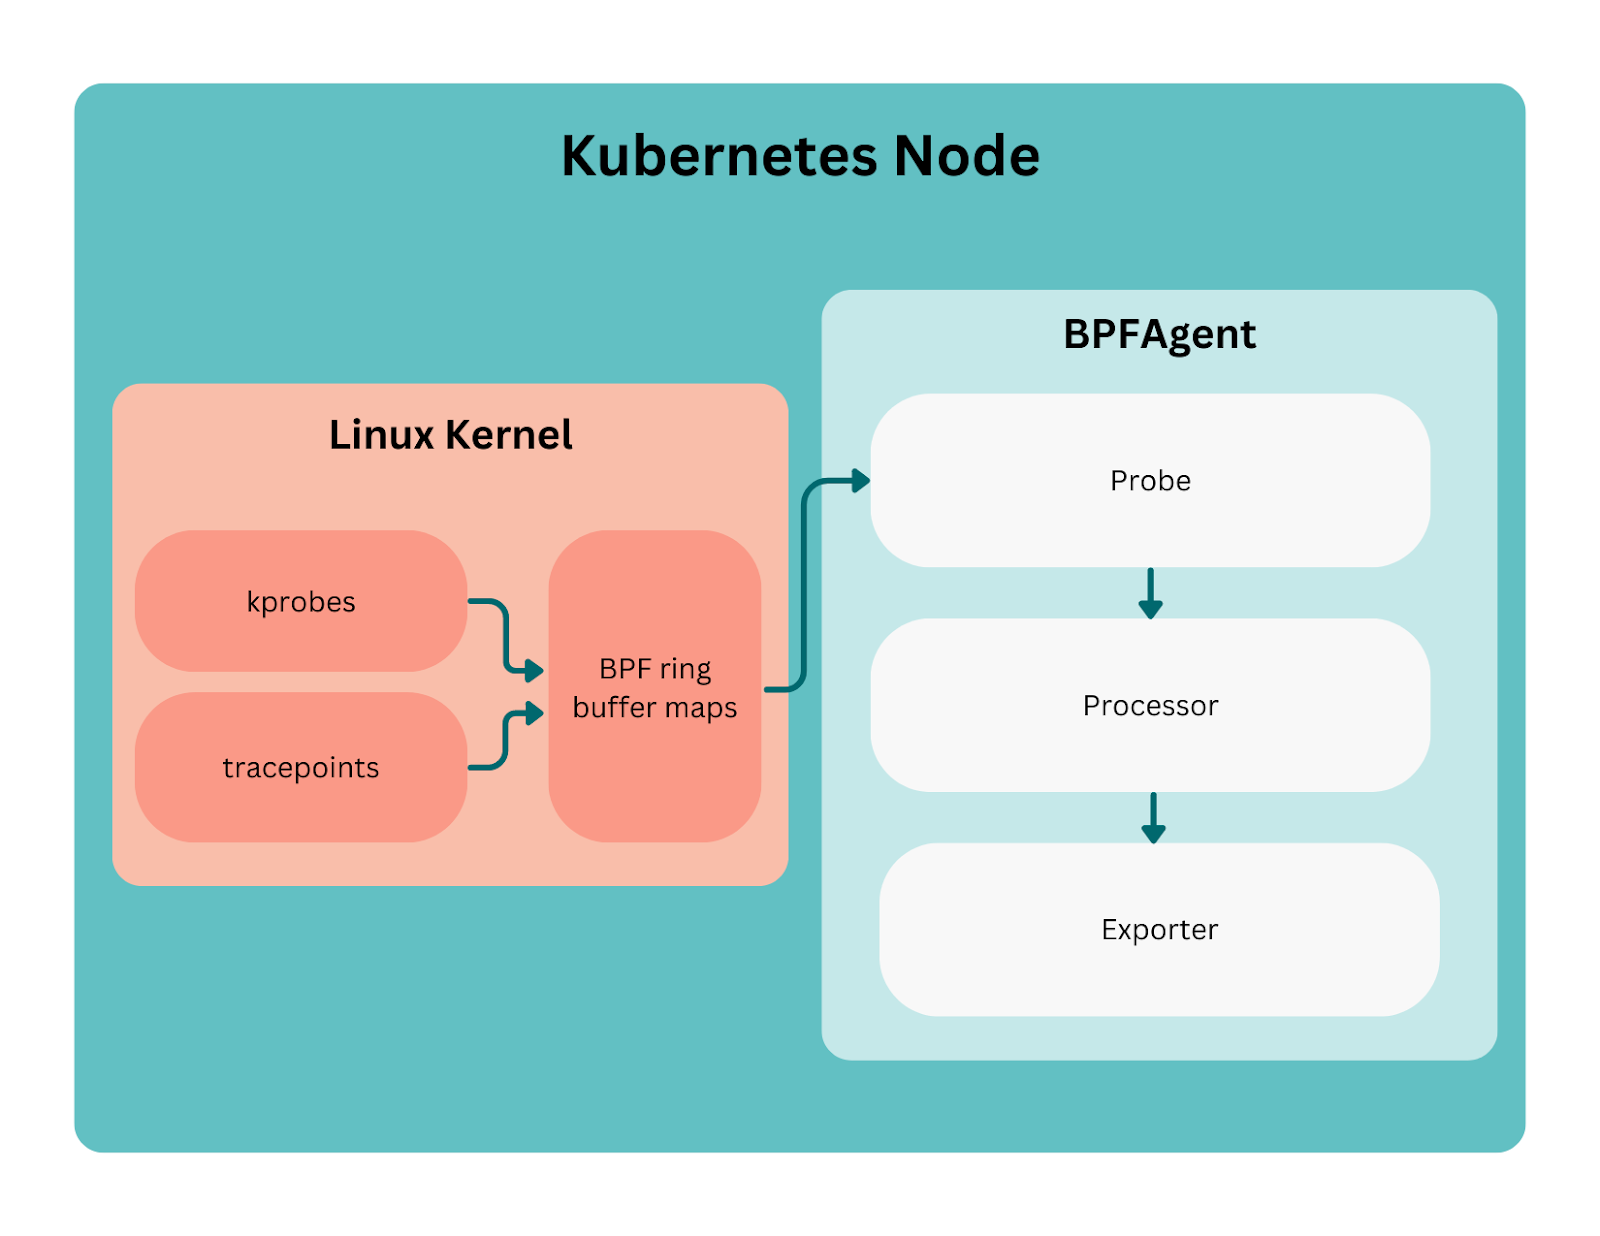
To run these eBPF probes, we have developed a Golang application called BPFAgent, which we run as a daemonset in all of our Kubernetes clusters. Here we will take a look at how we built BPFAgent, the process of building and maintaining its probes, and how various DoorDash teams have used the data collected.
Building BPFAgent
We developed the first version of BPFAgent using bcc and iovisor/gobpf libraries. This initial iteration helped us understand how to develop and deploy eBPF probes within our Kubernetes environment.
While we quickly confirmed the value of investing in developing BPFAgent, we also experienced multiple pain points related to this version’s poor development lifecycle and slow start-up times. Using bcc meant that probes were compiled at runtime, significantly increasing our start-up times when deploying new versions. This made gradual rollouts of new versions difficult because of the considerable time required to monitor a new deployment. Additionally, the probes had a hard dependency on the Linux kernel version of the Kubernetes node and all kernel versions had to be accounted for in our Docker images. On multiple occasions, an upgrade to the underlying OS for our Kubernetes nodes caused BPFagent to stop working until it could be updated to support the new Linux version.
We were delighted to find that the community had already started to address these pain points with BPF CO-RE — compile-once run-everywhere. Using CO-RE, we moved from compiling probes with bcc at runtime to compiling our probes with Clang during the build process for the BPFAgent Golang application. This change relied on Clang’s ability to compile a probe in BPF Type Format (BTF), which creates executable versions of probes that are largely independent of the kernel version through using libbpf and memory relocation information. The change prevents most OS and kernel updates from impacting our BPFAgent application or its probes. For a more detailed introduction to BPF portability and CO-RE, see Andrii Nakryiko’s blog post on the subject.
The Cilium project has an exceptional cilium/ebpf Golang library that compiles and interacts with eBPF probes within Golang code. It has easy-to-use go:generate integration that runs Clang to compile eBPF C code into the BTF format, subsequently wrapping BTF artifacts in an easy-to-use Go package to load the probes.
After switching to CO-RE and cilium/ebpf, we observed a 40% reduction in memory usage, a 98% reduction in container restarts due to OOMKilled, and an 80% decrease in our deployment time per Kubernetes cluster. Overall, a single BPFAgent instance reserves less than 0.3% of a typical node’s CPU cores and memory.
BPFAgent Internals
The BPFAgent application is composed of three main components. As shown in Figure 1 below, BPFAgent first instruments the kernel via our eBPF probes to capture and produce events. These events then go to processors to be enriched based on process and Kubernetes information. Ultimately, the enriched events are emitted via an exporter to our data store.
Figure 1:
Let’s dive into how we build and maintain our probes. Each probe is a Go module with three main components: the eBPF C code and its generated artifacts, a probe runner, and an event type.
The probe runners follow a standard pattern. During initial probe creation, we load the BPF code via the generated code (the loadBpfObjects function in the code snippet below) and also create a channel for our events to be sent for handling by bpfagent’s processors and exporter functions.
After this step, it is injected into the kernel as part of the Attach() procedure in BPFagent. The probe is loaded, attached, and linked with the desired Linux syscall, such as skb_consume_udp. Upon success, a new ring buffer reader is created referencing our BPF ring buffer. Finally, a goroutine is started to poll for new events to be unmarshalled and published to the channel.
Events themselves are fairly straightforward. For example, our DNS probe has an event with just the network namespace id (netns), process id (pid), and the raw packet data. We also have an unmarshalling function to convert the raw bytes from the kernel into our structure.
type Event struct {
	Netns uint64
	Pid  uint32
	Pkt  [4084]uint8
}

func (e *Event) Unmarshal(buf []byte, order binary.ByteOrder) error {
	if len(buf) < 4096 {
		return fmt.Errorf("expected input too small, len([]byte) = %d", len(buf))
	}

	e.Netns = order.Uint64(buf[0:8])
	e.Pid = order.Uint32(buf[8:12])
	copy(e.Pkt[:], buf[12:4096])

	return nil
}
Initially, we used encoding/binary to unmarshal. However, after profiling, we unsurprisingly discovered that significant CPU time was devoted to unmarshalling. This prompted us to create a custom unmarshalling procedure in lieu of reflection-based unmarshalling. Benchmark improvements validated this decision and helped us to keep BPFAgent lightweight.
Now, let’s address the eBPF probes themselves. Most are kprobes, which provide optimized access to trace Linux syscalls. With kprobes, we can intercept specific syscalls and retrieve the provided arguments and execution context. Previously, we used fentry versions of the probes. But because we are adopting ARM-based Kubernetes nodes, we switched to kprobe because our current Linux kernel version does not support optimized fentry probes on ARM architecture.
For network monitoring, our probes capture the following events of interest:
DNS
kprobe/skb_consume_udp
TCP
kprobe/tcp_connect
kprobe/tcp_close
Exit
tracepoint/sched/sched_process_exit
To capture the DNS query and response, the skb_consume_udp probe allows us to intercept UDP packets because most DNS traffic is over UDP.
The skb_consume_udp has access to both the socket and socket buffer as shown above. We can then use helper functions like BPF_CORE_READ to read the desired data from the structures. These helpers are especially important because they enable use of the same compiled probe across multiple Linux versions and can handle any relocation of data in memory cross-kernel versions.
For TCP, we use two probes to track when a connection is initiated and when it is closed. For connection creation, we probe tcp_connect which handles both TCPv4 and TCPv6 connections. This probe is mainly used for stashing a reference to the socket for basic context information about the connection source.
To emit a TCP connection event, we await the tcp_close call associated with the connection established by tcp_connect. Using bpf_map_lookup_elem, we use the`struct sock * as our key. We did this because contextual information from bpf’s helpers like bpf_get_current_comm() was not always accurate in the tcp_close probe.
When capturing the connection close event, we include how many bytes were sent and received over the connection. For this, we cast the socket to either tcp_sock (TCPv4) or tcp6_sock (TCPv6) based on the socket’s network family. This is possible because these structures contain the extended TCP statistics described in RFC 4898.
Lastly, we have a tracepoint probe for tracking when processes exit. Tracepoints are added by kernel developers to hook into specific events that occur within the kernel. They are designed to be more stable than kprobes because they don’t need to be tied to specific syscalls. This probe’s events are used to evict data from in-memory caches.
Each of these probes is compiled by Clang in our CI pipeline using cilium/ebpf`’s code generation.
All these raw events must then be enriched with identifying information to be useful. We use the fact that BPFAgent is a Kubernetes daemonset deployed in the node’s process ID namespace to directly read a process’ cgroup from /proc/:id/cgroup. Because most processes running on the node are Kubernetes’ pods, most cgroup identifiers look something like this:
From this convention, we extract the pod’s UID (between /kubepods-pod and .slice) as well as the container ID (between cri-containerd- and .scope).
With these two IDs, we can inspect our in-memory cache of Kubernetes pod information to find the pod and container to which a connection was bound. Each event is annotated with the container, pod, and namespace name.
Ultimately, the DNS events described previously are decoded using the google/gopacket library. With the decoded packets, we export events that include DNS query type, query question, and response code. During this processing, we use the DNS data to create in-memory cache mapping (netns, ip) to (hostname). This cache is used to further enrich the destination IPs from our TCP events with the likely hostname associated with the connection. A simple IP-to-hostname lookup is not practical because a single IP may be shared by multiple hostnames.
The data exported by BPFAgent is then sent to our observability Kafka cluster, where each data type is assigned its own topic. The data is then ingested in large batches into a ClickHouse cluster. From there, teams can interact with the data via Grafana dashboards.
Stay Informed with Weekly Updates
Subscribe to our Engineering blog to get regular updates on all the coolest projects our team is working on
Please enter a valid email address.
Thank you for Subscribing!
Benefits of using BPFAgent
While the data described up to this point has been helpful, eBPF data has really shined in its ability to provide insights independent of our deployed applications. Here are some examples of how DoorDash teams are using BPFAgent data:
Our storage team has used the data to investigate shared databases during our push toward single-service ownership. Using the TCP connections, they could filter by common database ports such as 5432 for PostgreSQL and then aggregate by destination hostname and Kubernetes namespace to detect databases used in multiple namespaces. The data allowed them to avoid combining a variety of different service-emitted metrics that might have unique naming conventions.
Our traffic team has used the data to detect hairpin traffic, the internal traffic that exits our virtual private cloud before re-entering from the public internet, incurring additional costs and latency. BPF data allowed us to quickly find and internal traffic targeting external-facing host names like api.doordash.com. Once we were able to remove this traffic, our team was then able to confidently set up traffic policies forbidding future hairpin traffic.
Our compute team has used DNS data to better understand large spikes in DNS traffic. Although they previously had node-level DNS traffic metrics, it was not broken down by specific DNS question or source pod. With BPF data, they are able to find the bad-acting pods and work with our teams to optimize DNS traffic.
Our product engineering teams have used the data to support a migration to our market-sharded Kubernetes clusters. This migration required the adoption of our Consul-based service discovery by all a service’s dependencies. BPF data was a crucial source of truth highlighting any unexpected interactions and validating that all clients had moved to the new service discovery method.
Conclusion
Implementing BPFAgent has allowed us to understand service dependencies at the network layer and enabled better control of our microservices and infrastructure. We have been thrilled with new insights, prompting us to expand BPFAgent to include additional use cases beyond network traffic monitoring. Among the first up: Building probes to capture file system reads from our shared configuration volume, driving best practices across all applications.
We look forward to onboarding more use cases and pushing the platform to support performance analysis and on-demand probes in the future. We also hope to explore new types of probes and any new hooks the Linux kernel team creates to help developers gain more insight into their systems.
Acknowledgements
BPFAgent was built by many hands here at DoorDash. I would especially like to acknowledge Matt Ranney, Matt Zimmerman, Qixuan Wang, Hochuen Wong, and Luigi Tagliamonte for their contributions to the service.
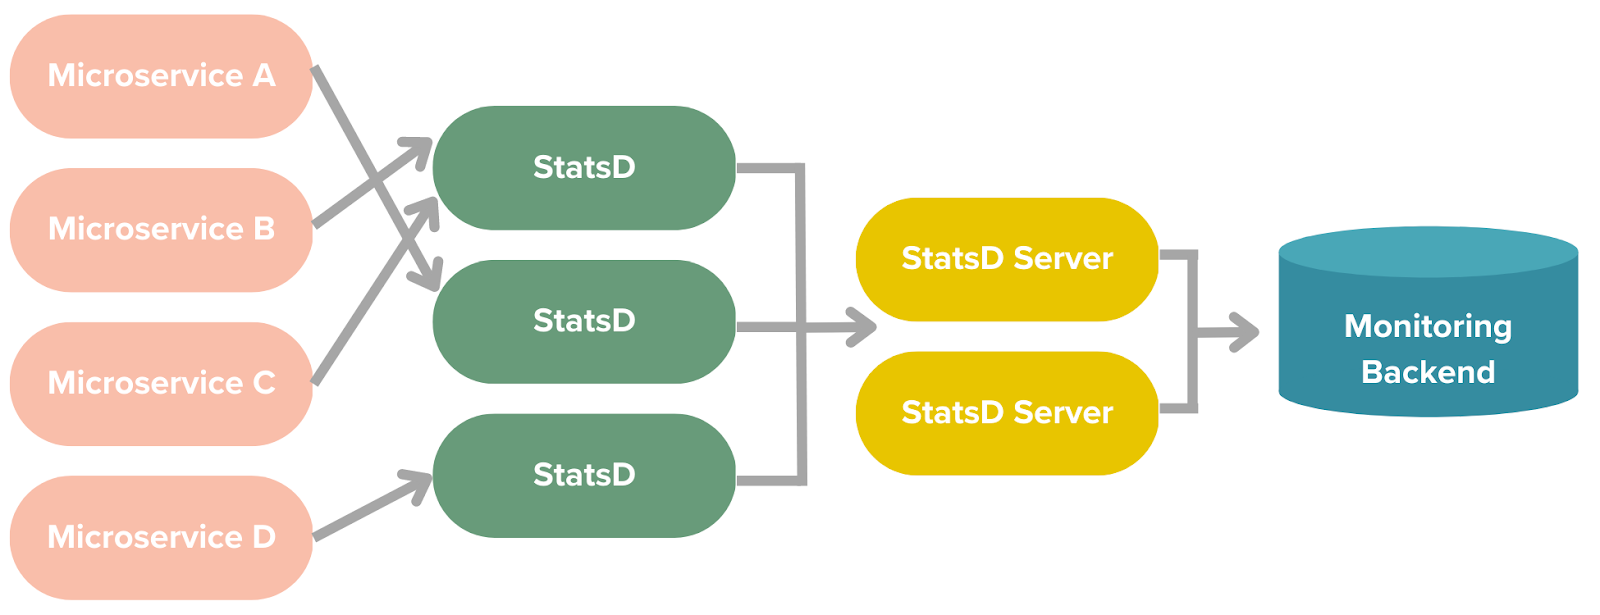
Accurate and reliable observability is essential when supporting a large distributed service, but this is only possible if your tools are equally scalable. Unfortunately, this was a challenge at DoorDash because of peak traffic failures while using our legacy metrics infrastructure based on StatsD. Just when we most needed observability data, the system would leave us in the lurch.
That’s why we decided to migrate our observability technology stack to Prometheus-based monitoring. As we continue to scale DoorDash’s business, using Prometheus lets us eliminate metrics loss, scale up our metrics usage, standardize our metrics labels, and significantly lower overall costs. In this article, we explain how we accomplished the migration, first reviewing the challenges we faced with StatsD and then discussing how we selected and implemented Prometheus as our preferred solution.
Challenges Faced With StatsD
StatsD was a great asset for our early observability needs, but we began encountering constraints such as losing metrics during surge events, difficulties with naming/standardized tags, and a lack of reporting tools. We’ll briefly introduce StatD’s history before diving into those specific issues.
StatsD was originally developed and released by Etsy to aggregate and summarize application metrics. StatsD is a network daemon built in Node.js that listens for messages containing statistics, like counters and timers, so that it can send aggregates to configurable backends.
Figure 1: DoorDash previously used StatsD proxy and server pipelines for microservices’ metrics
The design shown in Figure 1 reflects our legacy architecture for observability. Unfortunately, there were numerous issues with this design which elaborate below, including:
There was potential for User Datagram Protocol (UDP) packet loss, but there was no practical way to detect such a loss, which could result in a metrics information gap
There was no naming standardization and insufficiently granular tags
There was no histogram function and no way to aggregate percentiles
Packet loss
StatsD proxy reads messages from the OS recv buffer, which receives and holds them prior to processing. If messages arrive too quickly, this buffer fails to process all of them, overflows, and begins to drop packets. If a StatsD proxy or server instance is offline for any reason, metrics from that instance are lost. StatsD clients send data over UDP, which provides no guarantee of delivery at the transport layer making proxy outages transparent to downstream servers. Although the packet loss can be detected, more sophistication and complexity are required to identify them relative to any other simultaneous flows.
Lack of naming standardization and limited tags
The StatsD-based monitoring pipeline lacks naming standardization and has limited support for tags. The StatsD server sends metrics to a proxy, which interprets the telegraf format of StatsD to support point tags. For example, the original StatsD metrics are sent in the following format:
However, this convention does not allow a simple way to standardize the metric names and embedded tags. To prevent exponential growth, an additional aggregation tier must be added to consolidate on critical values before the storage tier.
Lack of histogram function
Finally, the StatsD pipeline’s lack of full support for a histogram data type complicates analysis related to latency percentiles. This necessitates computation of required percentiles for latencies, for example what percent of metric values are below an arbitrary threshold. Pre-computation adds complexity to the pipeline and makes it impossible for users to explore the data using different thresholds or percentiles, ultimately diminishing the overall value of the metrics information.
Requirements for our upgraded observability tooling
1.) Based on these issues with StatsD, we set some principles and requirements for our next solution:A strong preference for use of open-source and emerging standards
An open-source monitoring system allows to take advantage of the following:
Cost efficiency: The cost advantages of using open-source software typically are greater than the investment to build and maintain these systems.
Integration: We use open-source systems tomake our metrics, dashboards, and alerts portable. We can take advantage of the open-source data formats and query languages. And many current and future vendors support these standards, which provides evolutionary flexibility.
Self hosting: Partnering with a vendor speeds deployment while aligning on open-source standards ensures the pipeline remains vendor agnostic until the final step, maintaining future flexibility.
2.) Better governance and control
Aligning all services on standard naming/tagging metrics conventions achieves consistency within the broader observability ecosystem.
Standard conventions: While we prioritized providing stable and reliable monitoring, we also wanted to better control the conventions we used and ensure similarity across our other observability systems. Setting naming conventions and common tags optimizes for any future reset of dashboards and alerts.
Rate controls: From the start, we wanted to build the capability to report usage aggregation in line with our labeling standards — for example, per namespace — and to apply selective controls to source services that violated our agreed-upon envelopes such as rate and cardinality.
Integration enablement: We sought to enable correlation of metrics data with events across other domains. This allows deeper integration between systems, including logs and traces, and allows metrics data to be used for adjacent requirements such as cost attribution.
3.) Self-service capabilities
To speed up the migration, we needed to empower productivity and automate the general onboarding process.
Productivity empowerment: This process means that every parameter is discovered based on existing deployment methodology.
Onboarding automation: After the developer’s service is registered, these same configurations are used to discover the service and start collecting related metrics. No additional steps are required to build dashboards or create service alerts.
Migrating to Prometheus-based monitoring
With these new observability principles and guidelines, we made the choice to migrate to open-source Prometheus-based monitoring.
Why Prometheus?
Prometheus has emerged as the dominant standard for open-source metrics and is aligned well with our strategy and requirements. It has achieved broad support for both the client-side production of metrics data and the server-side consumption and presentation of that information. The strong community support among many vendors has created a large ecosystem of exporters and shared knowledge that jump-starts integration with almost any source system.
The adoption of Prometheus into the Cloud Native Computing Foundation has ensured strong support for the more fundamental tools used at DoorDash, including Kubernetes and Envoy. Prometheus includes a replaceable time-series database coupled with a service to manage collection and retrieval of the data using a powerful PromQL syntax. A closely coupled peer project delivers an integrated alert manager that extracts critical real-time insights from the data stream.
Our Prometheus migration process
The migration was handled in two phases. First, the observability team migrated the infrastructure components and set up the new metrics collection pipeline with auto-service discovery in parallel to existing pipelines; service owners simultaneously enabled the new endpoints on their owned components. Next, we partnered as consultants with the service owners to migrate related dashboards, alerts, SLOs, and similar tools as explained below.
Service instrumentation with Prometheus clients and libraries
Metrics clients and libraries generate and expose metrics via an HTTP endpoint. Prometheus supports most programming languages and popular frameworks, so instead of using a facade like a micrometer, service owners are encouraged to use Prometheus libraries natively. We deliver this native support through a common platform library by default, but service owners can use custom libraries/clients if they have bespoke requirements. Where there are challenges with native client support, such as third-party components, service owners may also deploy an exporter as a sidecar to satisfy their metrics requirements.
Internal libraries
We provide common internal libraries based on open source standards to ease adoption by most service owners. These libraries include support for metrics generated by all other platform functions, such as DB or MQ interactions, so developers don’t have to consider the instrumentation of these interactions and can instead focus on metrics related to their business logic.
Community libraries
We encouraged service owners and teams to use Prometheus native libraries to generate application metrics rather than using other metric facades. This avoids potentially inconsistent behavior stemming from how facade systems implement Prometheus paradigms such as histograms or summaries.
Exporters
Where the service or component is not fully controlled by the owner, it may be necessary to export Prometheus metrics via a function-specific exporter. The community offers many exporters that can be leveraged to provide high-quality metrics from non-native sources. As one of many examples, we include the JVM Prometheus exporter in our base images; service owners can enable the JVM metrics using the exporter. Similar exports are deployed for many databases and infrastructure components throughout DoorDash.
Metrics Collection
There are a number of distinct use cases for metrics collection:
Kubernetes collection: The metrics collector is deployed as a DaemonSet on each Kubernetes node to scrape targets that are determined to be local based on annotations maintained in the Kubernetes configuration for service discovery. Because most microservices in DoorDash are deployed in Kubernetes clusters, this represents the vast majority of metrics collection by volume.
Exporter collection: As an example, consider metrics extraction from an underlying AWS infrastructure. The AWS CloudWatch service exposes the data allowing us to deploy the open-source CloudWatch metrics exporter to copy relevant data into our common Prometheus environment. There are two popular CloudWatch exporters: the official Prometheus CloudWatch exporter and the open-source alternative YACE exporter, which is short for Yet Another CloudWatch Exporter. We selected YACE because it provides optimizations that result in less load on the CloudWatch API and it boasts an easy discovery mechanism. The key difference between the two is that YACE’s core functions use the GetMetricData API call to get metrics, while the official exporter uses the GetMetricStatistics API. Similar methodology is used to export metrics from various other third-party components used within our infrastructure.
Collection for short-lived jobs: In some cases, short-lived jobs are not available for scrape via this mechanism. For these cases, we deploy the Prometheus Aggregation Gateway to provide the push-based metrics target necessary for custom workloads. This is not a preferred collection pattern, but enables full use case coverage for metrics collection.
Standard tags for all metrics
To improve metrics consistency and maximize reusability of related dashboards and alerts, we have defined common tags which are added to all Prometheus metrics. These common tags are useful to create common dashboards and alerts to monitor service health.
Some of the common tags for all metrics include:
service: The service name registered in our internal service registry
app: The application within a service (for example, web vs. mobile)
environment: to indicate the service is in production vs. staging environment
region: The cloud region where this workload is running
zone: The cloud availability zone where this workload is running
Figure 2 below shows an example of how these common tags are used as filters in most dashboards.
Figure 2: One of the dashboards that use common tags for filter and query
Ingestion Optimization
The collection process enables an efficient rules-based aggregation before the data is committed to the storage tier. This is used to optimize high-label cardinality metrics and improve performance by reducing or eliminating unwanted label dimensions, producing a representative metric based only on remaining labels. The process also drops metrics completely if no dashboards or alerts currently reference them. Finally, metrics resolution is reduced after ten days to maintain trending data for historical look-back comparisons while sharply reducing storage needs.
Relabel rules
Relabel rules are used to rewrite a target’s label set dynamically during the scrape event in order to optimize the intake process at its genesis. Within the metrics collector, we configured the relabel rules to consolidate values and drop low-value labels or metrics.
Using codification for alerts
A robust metrics-based alerting system notifies engineers of critical events when specific threshold criteria are matched. At DoorDash, we have codified our alerts to obtain key benefits:
Source control: All monitoring alerts must be source-controlled and configured/versioned via code rather than being modified directly in a UI. This ensures safe rollback capability and builds a history of changes.
Alert templating: We wrapped the alert definitions in common templates with some logical default values for engineers to quickly define their alerts.
Common labeling: By standardizing our label values as described above, we are able to map an alert to the team that owns this service and automate the routing of the related notification directly to the on-call direct rendering infrastructure for it. This largely eliminates any triage step and reduces mean time to repair.
Results and achievements
With all the strategies described above, we successfully completed the migration of all metrics, dashboards, and alerts. We no longer experience the periodic loss of metrics and our improved governance allows for greater consistency, predictability, and transparency in the metrics ecosystem. The Prometheus-based monitoring system is stable, scalable, and flexible, providing a greatly improved view of DoorDash service health.
Stay Informed with Weekly Updates
Subscribe to our Engineering blog to get regular updates on all the coolest projects our team is working on
Please enter a valid email address.
Thank you for Subscribing!
After opening our reimagined office in New York just a few months ago, we’ve continued to invest in creating spaces that meet the distinct needs of our teams with our latest office opening in Washington, D.C. Built from feedback on what matters most when our employees come into the office, we leaned into solutions to increase collaboration among DoorDash employees and external partners.
A key element in designing the space was enhancing the ability to host a wide range of events. The space boasts a combination of a cafe and an event space, as well as two distinct team gathering areas large enough to host visitors, local onsites, and encourage maximum collaboration across teams. With a multitude of furniture configurations, the space accommodates our flexible workplace design principles, emphasizing the variety of work points and space types to support any number of work activities, including our first ever sit/stand conference table.
For those needing to work heads down, we also have two designated Do Not Disturb focus rooms, as well as conference rooms with built-in acoustic panels, offering increased privacy and a reduction of outside noise to those spaces.
“I’m so proud to showcase DoorDash’s newest corporate office to the elected officials, stakeholders, and partners who are a crucial part of our policy work.
“DoorDash employees across departments are now able to come together and collaborate in a shared space that reflects our company and its values. This new office further inspires us to Be An Owner of our outcomes and I look forward to how various teams will incorporate this space into their daily work.” – Carrianna Suiter Kuruvilla, Head of Federal Government Relations
DoorDash-inspired graphics highlight the space, custom designed internally to showcase a distinct but subdued connection to our other offices. The values posters that line the mezzanine floor offer a nod back to our San Francisco and Tempe spaces. And the front entry glass and staircase wrap emanate the line work and shapes of the kitchen backsplash tile we have in our Seattle office.
At DoorDash, we believe great work can be done anywhere. Rather than requiring employees to work in an office for a set number of days, we recognize that elements of both in-person and remote work will differ depending on how distributed each team is, and the nature of each team’s work. This space is well-designed to fulfill the needs of our Flexible Workplace Model, which gives our people the ability to decide how they want to leverage remote work and time spent together in-person, solving complex problems, learning within a community, and celebrating wins together.
With the reimagined Washington, D.C. office space, we look forward to introducing compelling and collaborative in-person experiences that meet the various needs of our teams.
During Veterans Appreciation Month, all of us at DoorDash celebrate and honor veterans for their service. During the month of July, we are reminded of the brave individuals who have served in our armed forces in the US and Canada. In partnership with our Veterans@ Employee Resource Group, we have a blend of in-person and virtual events, as well as an exciting announcement regarding our revamped Military Leave Policy.
What is DoorDash’s Military Leave Policy?
The new Military Leave Policy was developed in partnership with our Veterans@ leadership team. The revised policy, which went into effect earlier this year, provides up to 12 weeks of supplemental pay to top-up military pay received during a military leave for eligible U.S. regular, full-time and part-time employees. This applies to members of the reserve corps of the United States Armed Forces, National Guard, or other U.S. uniformed service organization and will provide support while they are away from work, serving our country. The updated policy embodies DoorDash’s commitment to our service members, ensuring that they can serve without the stress of financial hardship.
How We’re Celebrating Military Appreciation Month
During Veterans Appreciation Month, our Veterans@ leadership will host a series of events, kicking off a monthly meet-and-greet session, an open Q&A with our Chief Revenue Officer and executive sponsor of the ERG Tom Pickett, a virtual cooking class that brings together the veteran community over food and drinks, and an in-person event in Tempe, Arizona, designed to foster meaningful connections.
Throughout the year, we’ll continue to work closely with the Veterans@ ERG in veteran recruitment. This follows our commitment to the Veteran Hiring Pledge, to actively hire veterans of the U.S. Armed Forces and the Department of Defense’s Military Spouse Employment Partnership, which provides career opportunities for military spouses. Last year, to honor these commitments, we hosted our inaugural “DoorDash Hires Heroes” event, dedicated to veterans, transitioning service members, and military spouses.
Our dedication to the veteran community doesn’t stop there. Through a partnership with the U.S. Department of Veterans Affairs (VA) and Zoomo, we’re empowering homeless and formerly homeless Veterans currently receiving VA homeless program services to become financially self-sufficient through new flexible earnings opportunities and financial literacy education. This pilot program is part of our Pathways to Success initiative – a slate of programming to help people facing barriers to traditional employment access flexible earnings opportunities on the Dasher platform. Our Pathways to Success pilot with the VA launched in Los Angeles and will expand to additional states.
DoorDash is also providing fully subsidized access to e-bikes for Veterans, financial empowerment resources, and provisional access to the Top Dasher program to maximize earnings opportunities for participants. The e-bikes will be provided by our partner, Zoomo, who will also service the e-bikes and provide safety training and onboarding for e-bikes.
To all the courageous active military, veterans, and to those who care for you: we at DoorDash thank you for your service, sacrifice, and bravery.
Our efforts to create a workplace where everyone feels welcomed, supported, and valued is one of the reasons we were recently recognized as one of America’s Greatest Workplaces 2023 by Newsweek. To learn more about this award and how we’ve driven the culture our employees experience over the last year, click here.