During National Disability Employment Awareness Month (NDEAM) this October, we’re taking time to recognize the many contributions of people with disabilities to our workforce and, most importantly, to our global society.
Throughout October, alongside our Able@ Employee Resource Group, we’re hosting a series of virtual and in-person events designed to commemorate the many contributions of people with disabilities.
We’re kicking off the month with a joint blood drive across our Able@ and Unidos@ ERGs in Tempe, a Modern Health Webinar, and a fireside chat with our Head of DEI, Traci Mack.
We’ll continue to build awareness through a workshop titled “Building a Shared Language Around Disability,” a very special iteration of our monthly Able@ members meeting, and a NDEAM Puppy Party with the Arizona Humane Society in our Tempe office.
Throughout the year, we provide learning and development opportunities to keep the conversation going, including autism in the workplace, inclusion and equity for workers with disabilities, making a case for accessibility in your organization, and more.
Click here to learn more about how we’re making DoorDash a place where everyone feels welcomed, supported, and valued.
DoorDash provides an engaging internship program where software engineering interns are deeply integrated into our Engineering teams, allowing them to gain practical, real-world experience that complements their academic learning. This is one of two posts that showcase the exciting projects our summer 2024 interns developed. Their work not only reflects their problem solving and technical skills but also plays a meaningful role in driving innovation at DoorDash.
Preventing Ad Overspend: Improving budget pacing algorithms
By: Rohan Garg
DoorDash’s advertising platform, which aims to show the right user the right ad at the right time, lets advertisers consistently connect with consumers. Restaurants, for example, can specify an advertising budget for their campaigns and our platform can dynamically determine how that budget should be best spent throughout the day. Without pacing a campaign’s ad spend in this way, it is possible to deplete the entire budget early in the day. Restaurants then would get fewer orders during the dinner rush, hampering their ability to compete on the platform. This problem is known as budget pacing; in this post, we discuss how we improved our budget pacing system through mitigating severe over-delivery.
The challenge
When a consumer clicks on an advertisement, we charge that advertiser an ad fee. This fee is taken from the advertiser’s daily budget — their monthly budget is split evenly across all days. Because of daily fluctuations in user traffic, however, we also set our own spend goals that can vary from day to day. Once the spend goal is hit, we stop serving ads for that advertiser. We can still bill advertisers up to double their daily budget because of an agreement made between DoorDash and advertisers. This gap allows for some overspending — up to the billing cap — after the pacing goal has been achieved. Overspend occurs when a consumer clicks on an ad before the daily spend goal has been reached, but then fails to place an order until after that goal is reached. This is called delayed attribution. If too many orders contribute to this delayed attribution, we spend past our daily goal, resulting in ad overspend.
Consequently, even if a campaign is no longer served in auctions, it can still be charged because of an earlier ad impression. This is particularly severe for enterprise campaigns (sometimes more than 20%), as they attract a large number of consumers and tend to have high conversion rates.
Although we aim to minimize ad overspending, we must be careful not to throttle spending so much that we cause underspending. Our current method to prevent this is to switch from an algorithm that carefully paces spending for most of the day to one that deliberately spends the remaining amount up to the daily goal as efficiently as possible for the last few hours of the day. This mechanism is called fast finish, or FF. Technically, if a campaign has not reached the daily spend goal at certain hours, we immediately stop any pacing or throttling. This causes a sharp rise in ad spend, as shown in Figure 1. As a result, high-quality campaigns show a big spike in spending right after the FF period — a negative experience for our advertisers. Our goal in this project was to iterate on our intraday pacing system and the fast finish lever so that we can minimize overspending while avoiding underspending.
Figure 1: Daily spend curve for an example campaign. The blue line shows spend before reaching daily goal while the red line shows delayed attribution, or over-delivery.
Improving budget pacing algorithms is a key challenge for DoorDash and its industry in general. If we do not pace budgets well, we can encounter unstable impression counts, reduced revenue for DoorDash, and blackout days in which an ad campaign gets no ad impressions for many days at the end of the month.
Sizing up the problem
To understand the business opportunity as well as the severity of advertiser overspend, we spent a week doing a deep dive into the ads platform data. For the last week of May 2024, enterprise ad campaigns experienced about 11.5% overspending beyond goals for the week. Because budgets can be depleted earlier in the month, we studied spending data for the first week of June 2024 as well. The data showed that in the first week of June, enterprise campaigns saw nearly 25% ad overspend. The data was clear — many advertisers were struggling with severe ad overspending.
Developing a new approach
Our solution was to use campaign-specific parameters to modify various properties of the fast-finish logic. Using campaign-level overspend data, we varied the time that fast finish started and the rate at which ads were throttled.
Our first approach dynamically adjusted the fast finish time for any campaign in which there was high overspend. The thinking behind this was to allow our intraday pacing algorithm more time to serve the campaign. By allowing more time for the daily spend, we would likely hit the goal before we would need to trigger fast finish — leading to fewer delayed attributions. In simulations, we saw this approach increase daily campaign live hours by as much as 6%.
Our second approach changed the urgency level for switching from intraday pacing to fast finish. Instead of immediately dropping the probability of throttling an ad to zero, we slowly dropped it to zero over a set period of time, for example an hour. By slowing the drop of the throttle rate, we hypothesized that we could smooth the number of orders as we approached the daily spend goal. We believed this could lead to fewer delayed attributions as well. In simulations, we saw this approach increase daily campaign live hours by as much as 3%.
Our third approach simply combined the first two approaches. Ideally, pushing back the fast finish start time would increase campaign spendable hours; the transition window would smooth the spend curve, resulting in fewer orders with high delayed attribution. In simulations, we saw this approach increase daily campaign live hours by as much as 8.2%.
Tackling technical challenges
Three primary technical challenges occurred during this project.
The first revolved around designing the algorithm to push back the fast finish start time. We needed this algorithm to be robust enough to adapt to our changing input parameters, including the latest desired fast finish start time. We also needed the algorithm to output smooth behavior, for example no large jumps in the fast finish start time if a campaign started to experience more overspend. We were able to solve this problem by carefully selecting a smooth non-linear function that mapped historical data values to fast finish start time values.
Our second challenge stemmed from concern that our initial ideas were subject to a positive feedback loop that could cause unstable behavior. Essentially, we were using historical data to influence our algorithm, but over time the algorithm would influence the data, creating a feedback loop. We solved this problem by adding extra guardrails around our algorithm’s output.
The third issue involved the many nuances in engineering the algorithm and integrating it with our ad exchange service. For now, our pacing logic is embedded in the main service and there is a limited latency budget. Consequently, we put in extra effort to optimize the implementation carefully through parallelization and caching, e.g., some inputs to the algo do not change within the day and thus are cached locally to reduce latency.
Finalizing a solution
After simulations and online experimentation, we ultimately selected the third, combination approach, which includes:
Introducing a transition window between intraday and fast finish, probabilistically throttling X% requests when spending is faster than expected before reducing to 0% throttling
Incorporating a dynamic FF start time based on campaign spending history
As a result, our new intraday system is composed of three stages over the course of each day: intraday, transition, and fast finish.
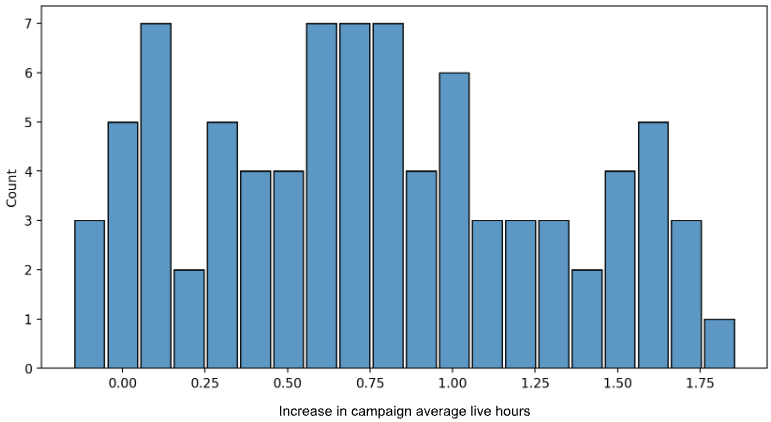
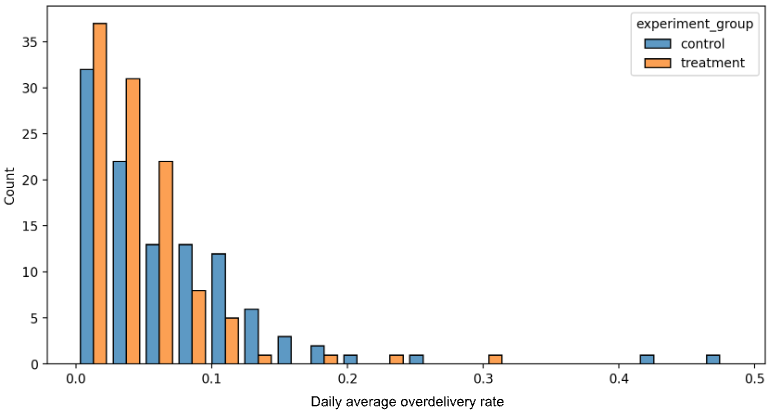
We conducted a one-week online A/B experiment that demonstrated the power of our new algorithm, as shown in Figures 2, 3, and 4, including:
Figure 2: Histogram of increase in campaign average live hours. On average, we observed an increase by 45 min per day.Figure 3: Histogram of campaign experiments showing average over-delivery rate. Treatment group (orange bars) tended to be located to the left near 0, indicating lower over-delivery.Figure 4: An example campaign daily spend curve. Treatment group showed a clear increase in campaign live hours (blue dots ended at 10:30 p.m., i.e. +1.1-hour later than the blue straight line) and also had smaller over-delivery, dropping from 10% to 3%.
Conclusion
In conclusion, we took a deep dive into over-delivery, brainstormed various solutions, and conducted simulations on our top three ideas. Based on our simulated results, we implemented our solution in production and measured its ability to mitigate over-delivery. The end result improves our ability to pace advertising budgets and improves the advertiser experience on the platform. Improving budget pacing moves DoorDash’s advertising platform closer to its ultimate goal: Delivering the right ad to the right user at the right time.
Identifying the main active device for dashers using multiple devices
By: Thao Nguyen
During my summer internship, I worked to improve how DoorDash logistics domain tracks Dasher locations. About 10% of Dashers use more than one device during a shift, which can lead to issues if locations from different devices report conflicting information, such as varying locations between devices.
It is crucial to know which of a Dasher’s various devices are authenticated and should be used in location tracking. This is important because some devices might be unintentionally activated, such as when a family member accidentally opens the DoorDash app from a different location and leaves it running. In a more troubling scenario, a malicious former Dasher, banned because of poor performance, might attempt to exploit this system vulnerability to earn money illegally — a situation that DoorDash, our customers, and our merchants would all want to avoid.
My project aimed to identify the primary device to know where each Dasher is, what they are doing, and if any suspicious activity is occurring. Determining the primary device also ensures that only reliable location data is used by downstream services, thereby reducing consumption of noisy data from multiple devices.
Implementation
This project used Apache Flink, a powerful stream-processing framework, to enhance the accuracy of Dasher location tracking.
The new service I developed processes raw location data streams from an existing Kafka topic that is continuously updated with Dasher collected from the Dasher mobile application . My project added a key feature: An `isFromMainDevice` field that indicates whether a particular location report originates from the Dasher’s primary device. After a series of logic checks on the location data, this field is set to true or false. Such checks include, among others, filtering out accidentally activated devices, applying production configurations, and identifying duplicate records. To accurately identify the main device during this process, I collaborated with another internal service that specializes in account compliance and fraud detection. By leveraging this service’s dedicated databases, sophisticated logic, and thorough testing, I was able to ensure that the system correctly identified the primary device, thus enhancing the overall reliability and efficiency of the location-tracking process.
After processing, enhanced location data records are pushed to a new Kafka topic, where they are ready for consumption by downstream services such as assignment, order-tracking and geo-calculation.
Impact
This project significantly improved the accuracy of Dasher location tracking by identifying and prioritizing data from each Dasher’s primary device. More reliable location reports contribute to reducing system abuse issues and enhance the overall efficiency of downstream services. The refined data now helps DoorDash make better assignment decisions and improves the accuracy of geo-calculations, ultimately contributing to a more reliable and secure platform for Dashers, merchants, and consumers alike.
Applying vision transformers to detect and prevent photo recycling fraud
by Anastasiya Masalava
Like many customer-facing companies, DoorDash establishes a variety of algorithms to detect and prevent consumer fraud. During my summer internship, I worked on developing a solution to curtail photo recycling fraud — a scheme in which a consumer submits duplicate or slightly modified (scaled or rotated) images to request multiple refunds from different deliveries. Consider the following two refund request images:
These images were submitted by the same customer as evidence for two refund requests related to two different deliveries. These requests should be flagged as image reuse to prevent refunds. However, it is challenging for human agents to spot such duplicate images through manual searches in the database. This kind of situation calls for an automated duplicate image detection system.
Selecting a robust algorithm
The first basic solution for duplicate image detection would be a SHA-256 hashing algorithm, which can compare the fingerprints of two image files to detect exact duplicates. But this solution cannot detect any image transformations such as rotation or scaling; any slightly modified images will not be identified as duplicates.
To address these limitations, I implemented a perceptual hashing algorithm — P-hash — designed to withstand minor image modifications such as compression, color correction, and brightness. I used hamming distance to detect similarity between two images, which measures the minimum number of substitutions required to change one hash string into the other. Although P-hash offers a good way to detect slightly duplicate images, it has a limitation: It tends to fail when image alterations significantly affect pixel patterns, for example in the presence of rotation or scaling.
To make the solution more robust, I deployed a vision transformer, or ViT, deep learning model, which applies transformer architecture to computer vision tasks. Duplicate images then can be found in three steps, as shown in Figure 1.
Figure 1: Pairwise cosine-similarity between submitted image embedding generated by Vision Transformer Encoder
First up, the ViT’s encoder computes dense representations — embeddings — of images to compress high-dimensional pixel images into vectors, preserving information about the image. These embeddings are then used to compute pairwise cosine similarities between images; potential duplicate image pairs can be retrieved if their cosine similarity is greater than the threshold.
The biggest advantage of this algorithm is ViT’s ability to understand the general context of images, improving its performance in identifying similarities.
Assessing performance
To discern the optimal solution, I created a testing dataset of image pairs and ran three experiments. The vision transformer algorithm outperforms SHA-256 by 52%, P-Hash by 1.3% as measured by F1 score, a balanced measure that reflects both the false positives and false negatives.
Impact
Experiment readout indicates that the Dup Photo detection can bring upwards of $0.6M annual savings. With the expansion of more use cases, the impact can be further increased. Over the course of my internship, I implemented an automation node to flag new refund requests if any duplicate image pairs have been detected in a consumer’s previous requests. This solution can significantly reduce time spent on reviews and can minimize losses from photo recycling fraud.
Why DoorDash needs a server-driven UI with mosaic
By: Yufan (Joy) Xiao
Traditionally, a mobile app’s user interface, or UI, is defined within the app itself on systems such as iOS or Android. This way, the app receives data from the backend to update text values and other content in its UI components. However, this approach creates two challenges to updating the UI:
Delayed release cycles: Updating the app’s UI requires releasing a new version of the app. This process can take several weeks to get approval from app stores, increasing the time to release.
User adoption lag: Even after a new version is published, users may not immediately update their app, limiting the reach of new features and UI improvements.
Mosaic, DoorDash’s standard server-driven UI, or SDUI, framework offers an effective solution to these challenges by moving the UI definition to the backend, making the mobile app responsible only for rendering the UI components. Using Mosaic, we can change the UI simply by updating the backend response. These changes take effect as soon as the mobile app receives the updated response, significantly reducing the need for app version updates. Figure 1 below demonstrates a key difference between what’s being transferred between frontend and backend.
Figure 1: Traditional vs Server-driven UI data content transferred between Frontend and Backend
Why we need pagination
Some services need to return large amounts of information in response to user requests. For example, when a consumer visits the DoorDash homepage or searches for stores, the service might find more than 1,000 stores. Loading all of them at once would cause significant latency, negatively impacting the user experience.
Pagination allows us to break down large data sets into smaller chunks that are returned on demand. It’s crucial to integrate pagination functionality into Mosaic to handle large data sets efficiently without compromising performance.
Implementation overview
Data flow (homepage example)
Below describes a series of steps of how a client sends a request to backend and gets back a paginated response via Mosaic. Figure 2 shows its sequence diagram.
Client: Sends a representational state transfer, or REST, request to the unified gateway, including the parameters needed to process the homepage and a page token for pagination.
Unified gateway: This is DoorDash’s internal tool that converts REST requests into Google remote procedure call, or gRPC, requests. Responses are then transformed back into REST responses.
gRPC service: Processes the request and generates a Mosaic contract, which is included in the gRPC response.
Data source: This is where the gRPC service retrieves data requiring pagination. Data sources could include a database, downstream services, or THIRD OPTION, among others.
Figure 2: Data Flow from Frontend to Backend to Frontend
Converting backend paged data into Mosaic contracts
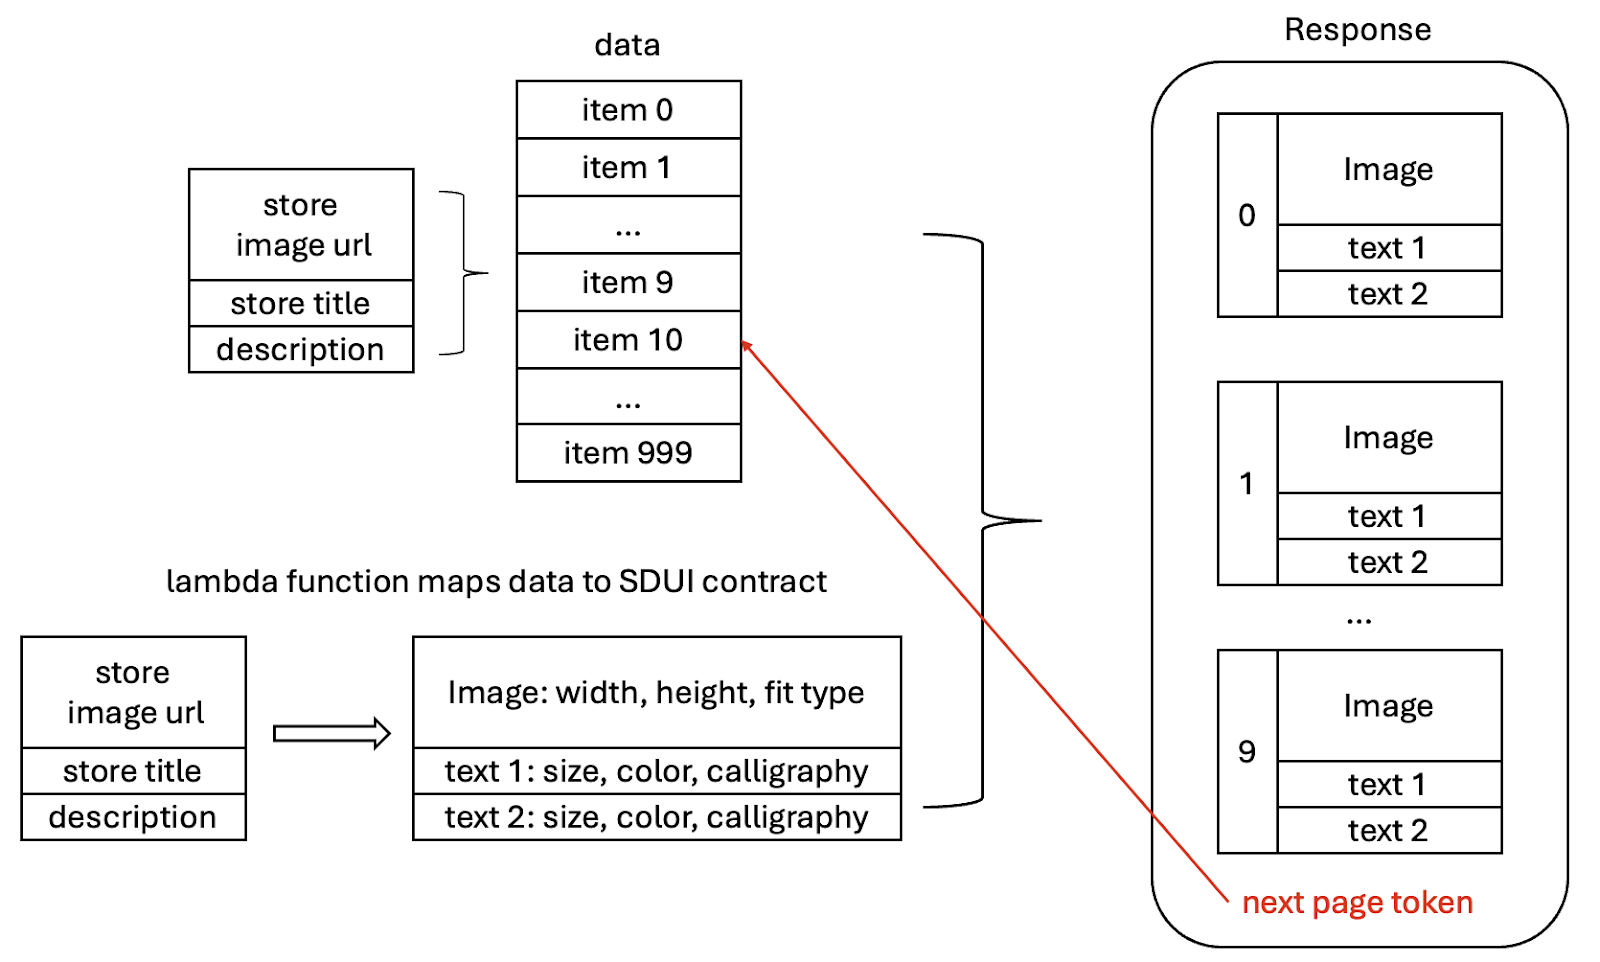
In the backend service, we define a lambda function that converts each data item into a group of UI components. These UI components, such as text, images, buttons, or tooltips, already are defined in Mosaic.
The backend response includes groups of UI components along with a page token to indicate the starting point of the next page. The client uses this page token for subsequent requests as seen in Figure 3.
Figure 3: Backend response containing the UI components and the next page token
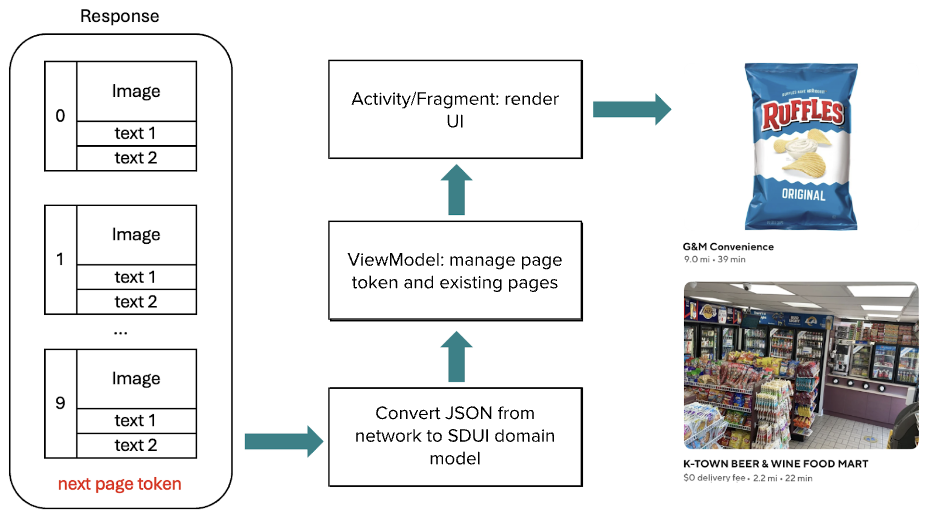
Rendering UI in the Android mobile app
As seen in Figure 4, after the mobile app receives the REST response in JSON format, Mosaic library converts it into a domain model. Android ViewModel then manages the page token from the domain model and maintains existing pages. The ViewModel is binding with an Android activity or fragment, which renders the UI with Mosaic.
Figure 4: Converting the response from network model to domain model and eventually render it
Impact
This project significantly accelerates adoption of the Mosaic framework across DoorDash, especially enabling the feed service to migrate to the new SDUI framework.
With pagination functionality, Mosaic not only supports a robust and flexible development environment but also offers a more scalable SDUI strategy, enhancing overall application performance and user experience.
Enhancing transparency and efficiency with DoorDash personalization debug tool
By: Shanting Hou
During my internship at DoorDash, I worked with the New Verticals, or NV team to develop a personalization debug tool to enhance operator transparency and significantly reduce debug time for engineers. Our solution contributed to the overall efficiency and reliability of DoorDash’s retail and category pages.
Improving tool understanding and debug efficiency
The NV team, particularly members focused on customer experience and product personalization, were grappling with inefficiencies in their outdated web debugger tool. The tool was not equipped to handle the growing complexity of retrieving essential information such as machine learning, or ML, prediction scores and personalized insights, which are crucial for testing ML features and responding to cross-functional team inquiries. Team members frequently had to rely on engineering support to diagnose and resolve issues, including limited item visibility, discrepancies in personalized content, mismatches between displayed deals and user preferences, and understanding the algorithm’s ranking logic. This dependency on engineers not only slowed operational processes but also hindered team autonomy and led to inefficient debugging procedures.
Building a comprehensive solution
To address these challenges, I was tasked with revamping the debugging tool. First, I dived deeply into the tool’s current use cases, discussing issues with ML and back-end engineers responsible for the ranking algorithm. I sought to identify the most critical features that needed to be logged to streamline the debugging process as well as to visualize the ranking logic more effectively. Primary challenges involved deciphering the ranking logic’s intricate flow and the logging information design. Both required navigating complex system logic and comprehending ongoing experiment values to pinpoint the ranking algorithm’s core stages. With the guidance of engineers Yucong Ji and Anthony Zhou, I was able to overcome these challenges and develop a clear understanding of the algorithm.
The next step required translating this technical logic into terms easily understood by both engineers and operators, which involved categorizing different ranking steps into their possible outcomes. I discovered, for instance, that the pinning settings for carousels could leave them in one of three states: unpinned, pinned to a given range on the page, or fixed at a specific position. To ensure clarity, I documented the logic of the logging fields in a comprehensive wiki.
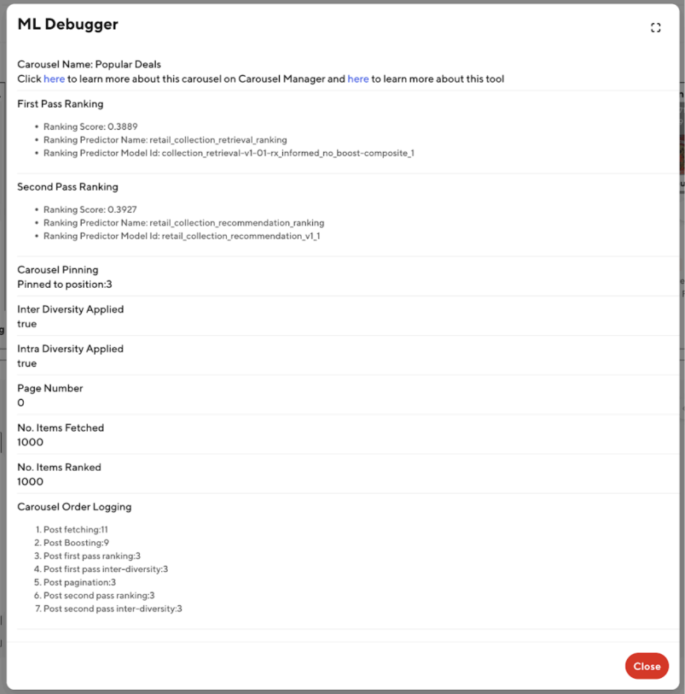
But the logging fields by themselves wouldn’t be effective unless they directly addressed user pain points. By analyzing confusion and errors reported on the team’s Slack channel, I identified specific concerns and determined what logging information would be most valuable. As just one example, we added carousel order logging information to increase transparency in the ranking stages, which helped to pinpoint where errors occurred. To make the tool user-friendly, we displayed the logged values in an accessible manner. The main debugging information was clustered into two key modals, separated by carousels and items. Additionally, we made modifications to retailStorePageFeedQuery to reduce latency, adding an enableDebug field that would pass from the front-end to the back-end. Consequently, debugging information was only retrieved when needed, ensuring optimal tool performance. The result was a robust tool that allows team members to view relevant debugging information directly on the live DoorDash site by simply toggling a debug button. Figures 1 and 2 below show examples of the new debug modals.
Figure 1: ML debugger modal for carousels
Shows key details of each step in vertically ranking item Carousel on the page to allow easy debugging of any ranking-related inconsistencies. For example, the ranking scores/ML models used to rank this carousel as well as the position of the carousel after each step in the ranking process.
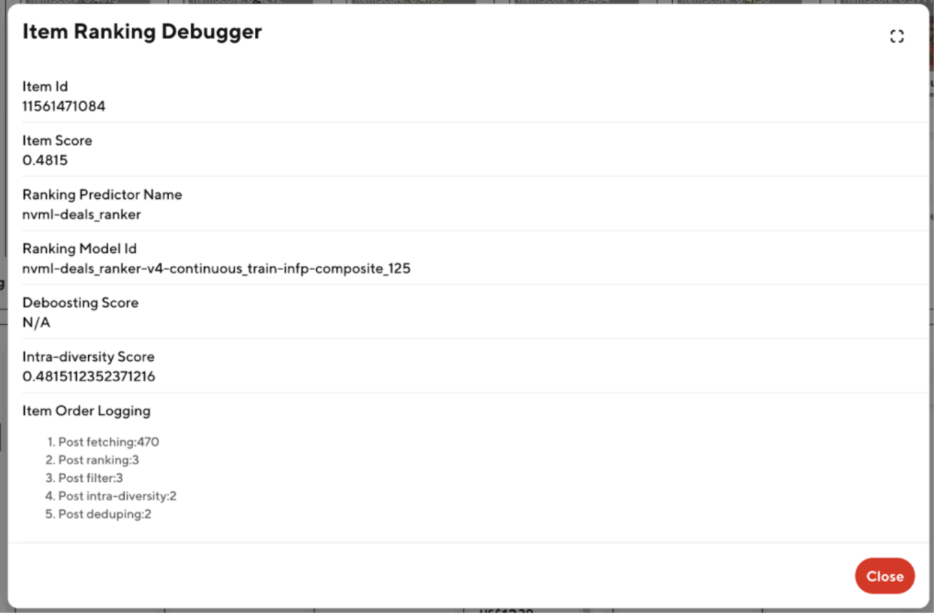
Figure 2: Item ranking debugger modal
Shows key details of each step in horizontally ranking items within a carousel to allow easy debugging of any ranking-related inconsistencies. For example, the ranking scores/ML model used to rank this item as well as the position of the item after each step in the ranking process.
Transforming the debugging process
Implementation of the personalization debug tool significantly impacted both the NV team and DoorDash as a whole. The tool reduces the time required for back-end engineers to debug issues by up to two hours, moving engineers away from manual debugging through the ML platform. This not only saves valuable engineering time but also improves the overall efficiency of answering cross-functional partner queries and testing new ML models. In the final weeks of my internship, I focused on enhancing the tool’s extensibility and long-term maintainability. I implemented functions that back-end engineers could use to log carousel/item position changes and other crucial features efficiently. I also modified the front-end to adapt seamlessly to new back-end changes, ensuring that any logging or feature information that was added would be reflected automatically without requiring further adjustments. I also investigated using tree metrics for detailed, per-query insights that could enable alternative approaches to overcome potential challenges, such as increased latency and complex logging.
Overall, the personalization debug tool has empowered DoorDash’s NV team to maintain effective debugging practices, improve transparency for operators, and ensure the platform’s continued reliability and efficiency. This project stands as a testament to the impact that a well-designed tool can have on a large-scale, distributed system.
You’re Invited: An Exclusive Evening with DoorDash Marketing Leaders
On October 29th, join us IRL for an intimate gathering at Chica & The Don in NYC. This is your chance to meet and hear directly from Kofi Amoo-Gottfried, our Chief Marketing Officer, and two of our top marketing leaders, as they share their unique career journeys and insights into what Marketing is like in an operations driven company.
Why attend?
Learn about DoorDash’s growth story
Hear how we’re redefining marketing in the tech space
Discover how DoorDash can help you achieve more than you ever thought possible
Attendees at our upcoming marketing event will hear from:
Kofi Amoo Gottfried, Chief Marketing Officer – Kofi is the Chief Marketing Officer at DoorDash, responsible for driving growth and engagement across all three sides of the marketplace.
Prior to DoorDash, Kofi was VP of Brand & Consumer Marketing at Meta (fka Facebook), having previously served as the company’s Head of Consumer Marketing for internet.org. Before Meta, Kofi was Chief Strategy Officer at FCB New York. He joined FCB from Bacardi Global Brands, where he was the Global Communications Director for the Rum category and the architect for the reinvention of the Bacardi brand.
As the Founder and Managing Director of Publicis West Africa, Kofi created and launched the first majority-owned network agency on the African continent. And as the Senior Strategic Planner on Nike at Wieden+Kennedy, Kofi crafted the strategy for Nike’s global Beijing Olympics campaign.
He began his career at Leo Burnett Chicago & Leo Burnett London – working on Kellogg’s, Coca Cola, and Global Giving. Kofi has a BA in Economics and International Studies from Macalester College. He serves on the Board of Trustees for Macalester College; on the Board of Vital Farms – a Certified B Corporation that brings ethical food to the table to improve the lives of people, animals, and the planet; on the Board of Stitch Fix – the leading destination for personalized shopping, styling and inspiration; on the Board of One Young World – the global community for young transformational leaders; and as a Venture Advisor to Listen Ventures.
Kofi lives in South Orange, NJ with his college-sweetheart-turned-wife Kate, and their rambunctious young sons Marlowe and Miles.
Chelsea Steckel Hendler, Director, Head of Merchant Marketing – Chelsea has been at DoorDash on the B2B Marketing team for three years in various capacities. She started out leading the B2B Product Marketing team and now is currently leading the Integrated Marketing team where she is responsible for leading the B2B (Merchant) Marketing organization across all functions – building integrated strategies across performance, retention, content and brand marketing for SMB restaurants.
Prior to DoorDash, she spent the last 10+ years in various positions across PM, GM, and Marketing at tech and retail companies, such as Macy’s, Amazon, and Meta.
Chelsea lives in the NJ suburbs with her husband (who also works at DoorDash), almost 2-year old son, Mac, and their labradoodle, Wally.
Julio D’Alfonso, Group Creative Director – Julio D’Alfonso is the Group Creative Director at Superette, DoorDash’s in-house creative studio, where he leads creative efforts for Dasher and Merchant projects.
With over 15 years of experience in advertising agencies across Brazil and the U.S., Julio has a track record of delivering innovative solutions for both local and global brands, addressing their business challenges through creativity.
Due to limited seats, please register your spot by 10/9/24.This invite is valid for one seat.
Please arrive by 6:15pm ET.
In the fast-paced world of food delivery, accurate estimated time of arrival, or ETA, predictions are not just a convenience; they’re a critical component of operational efficiency and customer satisfaction. At DoorDash, where we handle over 2 billion orders annually, the challenge of providing accurate ETAs is both complex and essential.
Traditionally, we have relied on tree-based models to forecast delivery times. While these models produced reasonable forecasts, they also were limited in their ability to capture the intricate patterns and nuances inherent in our vast and varied delivery network. As our operations scaled and customer expectations evolved, we recognized the need for a more sophisticated approach.
Enter our latest innovation: A cutting-edge ETA prediction model that leverages advanced machine learning techniques to dramatically improve accuracy. By leveraging an Multi-Layer-Perceptron-gated mixture of experts, or MLP-gated MoE, architecture with three specialized encoders — DeepNet, CrossNet, and transformer — we created a model that can adapt to diverse scenarios and learn complex relationships from embeddings and time series data to capture temporal and spatial patterns. Additionally, our new approach also incorporates multitask learning to allow the model to simultaneously predict multiple related outcomes. Finally, we explored novel probabilistic modeling approaches to expand the model’s capability to accurately quantify the uncertainty of the ETA forecasts.
The result? A remarkable 20% relative improvement in ETA accuracy. This leap forward not only enhances our operational efficiency but also significantly boosts the reliability of the ETAs we provide to our customers.
We have an earlier blog post that goes deeper into the business context and the problem space. In this post, we dive deep into the technical details of our new ETA prediction system and illustrate how each component contributes to its success as well as how this new approach impacts our business and user experience.
What is ETA?
Before jumping into the modeling details, let’s take a look at the time of arrival we are trying to estimate.
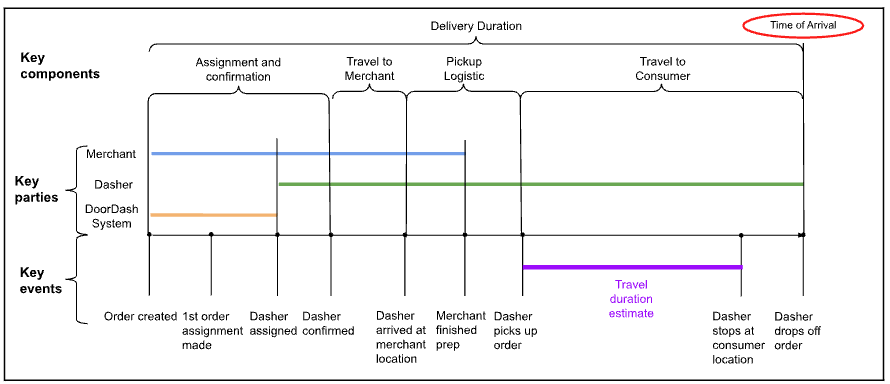
Time of Arrival = Order Creation Time + Delivery Duration
Figure 1: These are the various steps of delivery, broken down by stage and parties involved
In Figure 1 above, we can see the components that contribute to delivery duration for a regular order. In even the most straightforward cases, there are at least three key parties: merchant, Dasher and DoorDash system. We also can break down delivery duration into several stages: Dasher assignment and confirmation, travel to merchant, pickup logistics, and travel to consumer. Given the various parties and stages, a change in any one of them can introduce variation in actual delivery time, which requires us to use more capable tools to tackle the prediction.
Embeddings and time series features
Advanced feature engineering makes up a crucial component of our improved ETA prediction model. Although we kept a number of existing features, we also leveraged neural network embeddings to represent categorical or bucketized continuous inputs, and incorporated time series features, significantly enhancing our model’s ability to capture complex patterns and relationships.
Embeddings for rich feature representation
We observed strong predictive signals in categorical features with high cardinality. For example, there are many stores on the DoorDash platform and some — for store-specific reasons such as cuisine type, store popularity, or efficiency — have a longer food preparation time than others. Also, restaurant traffic patterns change over the course of a day with meal times drawing the largest crowds and subsequently increasing delivery duration.
We used feature encoding methods to capture category-based patterns such as one-hot encoding, target encoding, and label encoding. However, one-hot encoding cannot scale efficiently for categorical features with high cardinality because of the curse of dimensionality; other encoding methods are not adequate to capture each category’s patterns because manual effort is required, often causing the loss of semantic relationships. For example, it’s hard for the ETA model to learn similarities between two fast food restaurants when they are compared with other types of restaurants.
To resolve these problems, we introduced embedding into the ETA prediction model. With embeddings, we can convert sparse variables into dense vector representations. At the same time, we improve the generalizability and balance the model’s focus on sparse features versus dense features by quantizing and embedding key numerical features. This approach provides such benefits as:
Dimensionality flexibility: The embedding size is based on the importance of each categorical feature to ETA prediction instead of its cardinality, as would be done with one-hot encoding. We tend to use smaller embedding sizes to avoid overfitting and to reduce model size.
Capturing category-specific patterns: Embeddings can capture intrinsic patterns and similarities between categories, allowing the model to understand relationships from multiple dimensions; target encoding, frequency encoding, and label encoding can only capture limited amounts of information.
Improved generalization: The representation of quantized dense features allows the model to generalize better to unseen or rare values. For example, some dense feature values can be extremely high. These outliers can be less impactful during inference because they likely will be capped by the bucket they fall into; the bucket will have plenty of training data to find its embedding representation.
Flexibility in feature combination: Embedded features can easily be combined with other numerical inputs, allowing for more complex interactions.
Reusability in other models: The trained embedding can be extracted out and used as input for other models. In this way, the knowledge learned by one ETA model can easily be transferred to other tasks.
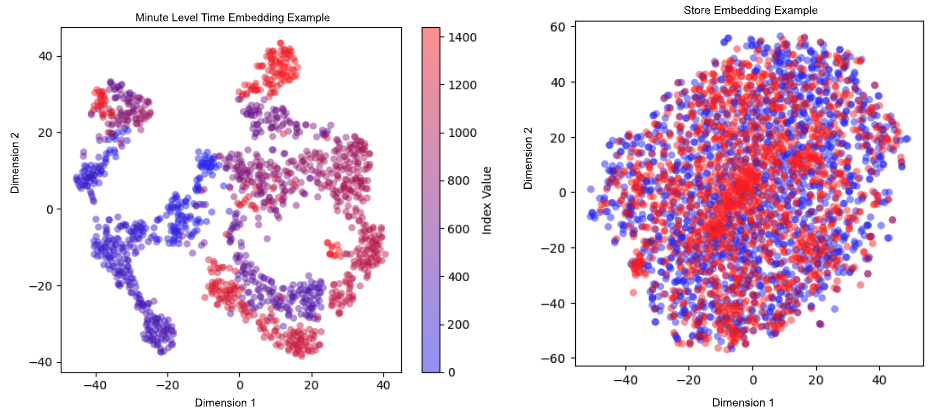
Our ETA model learns the embeddings for categorical features such as time buckets, pick-up and drop-off locations in various granularities, store type, item taxonomies, and assignment segments. Figure 2below shows examples of time embedding and store embedding. In the time embedding example, blue dots represent earlier in the day while red dots are for later. Closer minutes cluster together; In some cases, such as when the end of one day is closely followed by the start of the next day’s business, both red and blue dots can be found together. In the store embedding example, blue dots represent the stores that use a more standardized order system while red dots refer to an order system used by smaller merchants. We observe that there are multiple clusters of red dots, which may be a sign that this order system more strongly impacts store efficiency, which has a bearing on delivery time. These embeddings and other parameters are input into the DeepNet and CrossNet encoders to capture both deep non-linear patterns and explicit feature interactions.
There also are other important numerical features, such as travel duration and subtotal of order cart. We transform these continuous features into discrete values via bucketization. This makes our model more robust to outliers because the buckets cap outliers, improving the model’s generalization. It also allows for learning complex patterns within each bucket and better captures non-linear relationships. Meanwhile, the original feature values are not discarded, but are also fed to the DeepNet encoder so that we don’t lose precision due to discretization, providing flexibility in handling different types of patterns.
Figure 2: Visualizing time and store embeddings via t-distributed stochastic neighbor embedding. In minute-level time embedding, as shown on the left, blue refers to early in the day and red represents later times. In store embedding, as shown on the right, blue dots represent stores using a more standardized order system and red dots refer to a type order system used by smaller merchants.
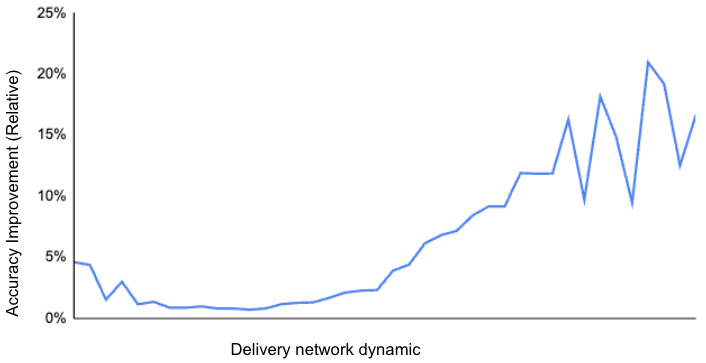
Incorporating time series features
Our ETA model performs well when the overall market dynamic is normal. When there is a shift toward Dasher undersupply, either regionally or in a sub-region, the model’s performance drops. This is caused by old features capturing only high-level supply/demand conditions and being volatile to fluctuations. Both make the feature noisier, which makes it harder for our model to learn the pattern well.
We observed a strong correlation between earlier orders and the later orders in a small time window. For example, if an area is already suffering from an undersupply of Dashers, orders placed in the next quick time window are added to the queue, which leads to cumulative undersupply effects. To take advantage of this temporal nature of delivery ETAs, incorporating time series features has been crucial in responding faster to dynamic changes in the system.
To convey this real-time trend information to our model, we collect time series signals on a minute-level frequency, such as the average order volume per minute over the past 30 minutes. Compared with the average value over the past 30 minutes, this time series conveys richer information about market dynamics. Because this type of feature can be sparse if the time bucket is small, we use the aggregated value of the five-minute bucket and then add learnable positional embedding. With the transformer encoder learning representation from the sequential data, the ETA model learns a representation for the contextual snapshot of the market dynamic in the past time window.
Figure 3: Incorporating time series features improves ETA prediction accuracy. As shown in the figure, the relative accuracy is improved under various delivery network dynamic situations. Especially, when the Delivery network is extremely busy, the relative accuracy improvement soars to around 20%, which sets more accurate expectations for consumers.
We compared the model performance with and without the time series features and found that the performance improvement can be attributed primarily to better responsiveness to various market conditions, especially when there is significant undersupply of Dashers, as shown in Figure 3 by the higher network dynamic. This suggests that our model now has adapted better to changing conditions over time, such as evolving order patterns or a shifting network dynamic.
While this approach offers significant advantages, it comes at a price: increased computational complexity. The feature engineering method and the transformer encoder both contribute to heavier computational loads during training and inference. Thanks to our Machine Learning Platform team’s strong support, this is successfully productionized and benefiting our consumers with better-quality ETA predictions.
Understanding MLP-gated MoE architecture
We faced several challenges when improving the accuracy of our tree-based ETA model. The model’s predictions had less variance than the ground truth, indicating limited expressiveness, which hindered our ability to capture the full complexity and variability of the target variable, especially in the long tail.
Additionally, the curse of dimensionality made it difficult to identify meaningful splits, leading to overfitting and underfitting, particularly with sparse features. Error analysis suggested that incorporating feature interactions and temporal dependencies could help, but manually creating these interactions was unscalable and noise in the data worsened the dimensionality issue, making it hard to extract useful patterns.
At the heart of our improved ETA prediction model lies an MLP-gated MoE architecture that improves the model’s expressiveness and learns various types of information automatically. This approach allows us to leverage the strengths of different neural network structures, each specializing in capturing specific aspects of the complex relationships within our data. The following sections describe the key components of this architecture.
Parallel encoders
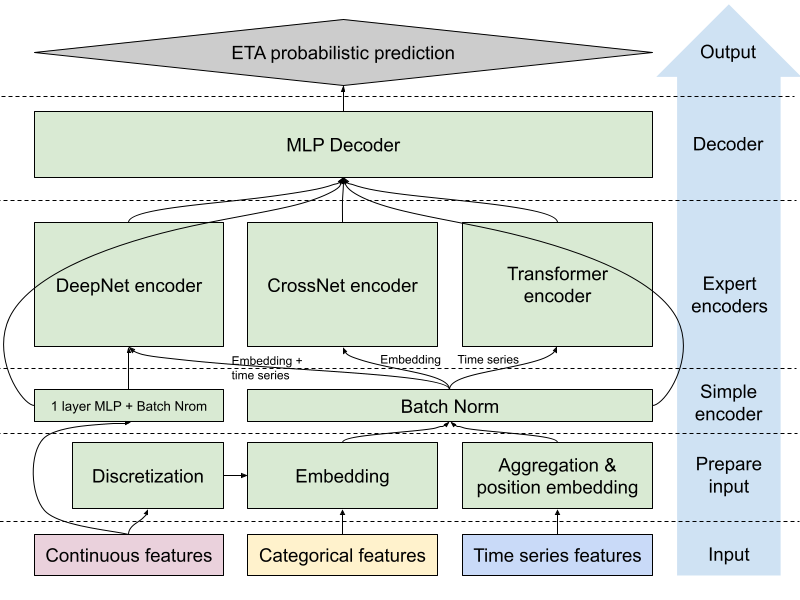
As shown in Figure 4 below, our MLP-gated MoE model employs three parallel encoders, each serving as an expert in processing different aspects of the input data:
Simple encoder:This one-layer MLP serves two main purposes: convert the input into a fixed dimension that makes adding/dropping features easier and normalize feature values before feeding them to the experts.
DeepNet encoder: This deep neural network processes inputs through multiple layers, including numerical features, embeddings, and aggregated time series features. It excels at capturing general feature interactions and learning hierarchical representations of the data and is particularly effective at understanding complex, non-linear relationships between various input features.
CrossNet encoder: Inspired by DCN v2 from recommendation models, CrossNet encoder defines learnable crossing parameters per layer as low-rank matrices and incorporates a mixture of experts with a gating mechanism that adaptively combines the learned interactions based on the input. In the ETA prediction, the input of this expert includes all embeddings of categorical features and bucketized numerical features. The CrossNet encoder is designed to effectively model the complexities and interdependencies between temporal/spatial/order features. At the same time, the depth and the complexity of the interactions are constrained by the number of cross layers and the rank of matrices, leading to both regulatory effect and better computational efficiency.
Transformer encoder: Leveraging the power of self-attention mechanisms, the transformer encoder focuses on modeling sequential dependencies and relationships. The input of this expert only includes the time series feature, which is a sequence of signals. If fed only into the DeepNet encoder, our ETA model would capture non-sequential, hierarchical patterns and complex feature interactions but may ignore sequence order information. That’s where the transformer encoder comes in; it can learn long-range dependencies and contextual relationships within sequences using self-attention. Temporal dependencies mean that this sequential understanding is helpful for ETA predictions. The ETA model can respond faster to dynamic change if it is exposed to the temporal relationships of volume, delivery cycle, and supply/demand.
Figure 4: MoE architecture for ETA prediction. Features are passed to the DeepNet, CrossNet and Transformer encoders after preprocessing steps. The output from all expert encoders and simpler encoders are combined into a representation, which is then passed through a multi-layer perceptron decoder to generate probabilistic ETA predictions.
Combining expert opinions
Each of these encoders processes different input features, leading to comprehensive learning around various aspects of the information. We bring together the expert opinions from each encoder into a single, rich representation, which is then fed into a multi-layer perceptron to translate the combined insights into an ETA prediction. This simplified architecture differs from a traditional MoE in that it doesn’t use a separate gating network to dynamically weight the contributions of each expert. Instead, based on the learned representation from the time series feature, the MLP decoder is aware of the dynamics, so the trained MLP decoder can effectively combine and utilize the outputs from all encoders simultaneously based on different situations. We dropped the explicit gating network because it doesn’t provide meaningful incremental performance improvements in ETA predictions.
This MLP-gated MoE architecture allows us to harness the strengths of different neural network structures while maintaining a manageable level of complexity. One of the key advantages of this approach lies in its extensibility. This allows easy incorporation of additional encoders or other model components without needing to redesign the gating mechanism. The architecture can be adapted to handle the integration of new features, making the model more versatile in responding to changing requirements or data patterns.
As we continue to explore these avenues, further research into optimizing the integration of different encoders — whether through more sophisticated MLP designs or novel gating mechanisms — could unlock even greater performance gains. Ultimately, this approach positions us to stay ahead of the curve in model development, creating a framework that is not only powerful today but also built for tomorrow’s innovations.
Estimating and communicating uncertainty in ETA predictions
In the world of food delivery, providing accurate ETAs is crucial. Equally important, however, is our ability to quantify and communicate the uncertainty associated with these predictions. This is where our probabilistic approach to ETA prediction comes into play, adding a new dimension of reliability to our estimates.
Probabilistic predictions
Traditional ETA models often provide a single-point estimate, which can be misleading in highly variable environments like food delivery. Our approach goes beyond this by implementing a probabilistic base layer for estimating uncertainty in our predictions.
We have explored four approaches to determine the uncertainty about a single prediction:
Point estimate:We discovered that there’s a consistent trend between the point estimation and the variance of ground truth. Based on this observation, we created a formula to translate point estimate to uncertainty.
Sampling: For each prediction, we run the inference multiple times, randomly disabling select sets of nodes; we then use the distribution formed by all the inference results as the final prediction.
Parametric distribution: We assume which distribution family should hold the ground truth and then let the model predict the parameters.
Non-parametric distribution:We make no assumptions about the distribution itself, instead assuming the range in which the ground truth might fall. The possible range is segmented into multiple buckets and then the model predicts the probability for each bucket. We can get a good estimate of the probability density function by tuning the granularity or smoothing techniques.
By incorporating this probabilistic base layer, our model doesn’t just predict a single ETA value, but rather a distribution of possible arrival times. This distribution provides valuable information about the uncertainty associated with each prediction.
Challenges of learning a Weibull distribution
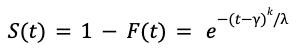
In previous blog posts in 2021 and 2022, we reported strong evidence that the food delivery time follows a long-tail distribution that cannot be modeled by Gaussian or exponential distributions. To capture the long-tail nature and accurately predict the uncertainty for each delivery, we chose to model the food delivery time via the Weibull distribution, whose probability distribution function takes the form:
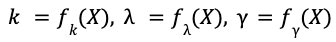
The parameters 𝑘, 𝝀, 𝛾 are called the shape, scale, and location of the Weibull distribution and they specify the distribution’s tail shape, width, and minimum. The machine learning task is to train AI models to predict these parameters 𝑘, 𝝀, 𝛾 as functions of the input features 𝑋.
When we trained the AI model to maximize the log-likelihood under Weibull distribution, we found that the model sometimes makes unreasonable predictions. For instance, the model may predict a negative location 𝛾 < 𝑂, which means a non-zero chance that the food is delivered within one minute of placing the order, which is impossible in reality. The key challenge is that the parameters 𝑘, 𝝀, 𝛾 appear in the log-likelihood function in highly nonlinear forms
and it is likely that the model overfits the observed data.
Interval regression
Because using the log-likelihood loss function did not lead to accurate predictions, we needed to modify the loss function to make it easier to learn the Weibull distribution parameters. After multiple trials, we proposed an innovative approach to use the survival function 𝑆(𝑡), defined as:
We further leveraged the log-log transform of the survival function, which takes a much simpler functional form:
Using this as the loss function, we used simple least squares to fit the Weibull distribution parameters 𝑘, 𝝀, 𝛾.
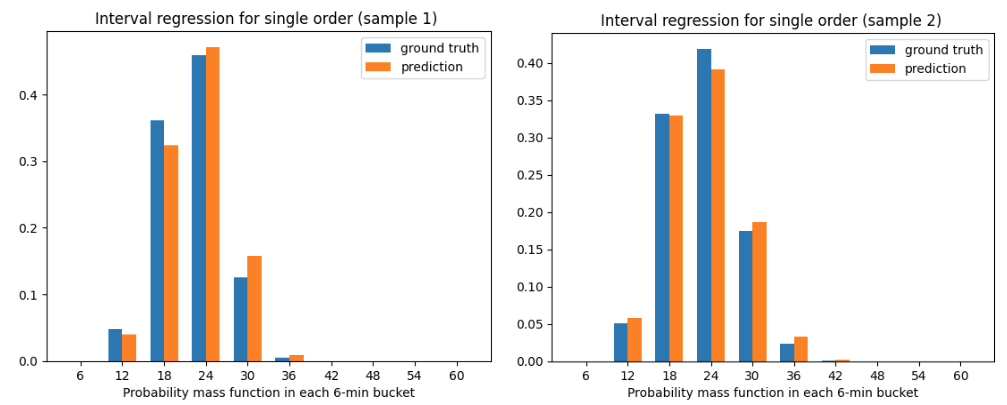
Finally, we needed to derive the survival function 𝑆(𝑡) from data. Interval regression provides a solution, grouping the deliveries with similar input features 𝑋 and plotting a histogram of the food delivery time 𝐻(𝑡) where the length of each bucket is six minutes, shown in Figure 5 below.
Figure 5:Predicted vs. ground truth ETA distribution in six-minute buckets
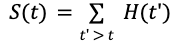
The survival function at each time t is derived by simply summing the histogram values for 𝑡‘ > 𝑡:
A simulation study
We validated the prediction accuracy of the interval regression approach via a simulation study. For each delivery with input features 𝑋, we used fixed functions to generate the ground truth parameters
The AI models must learn these functions 𝑓𝑘, 𝑓𝜆, 𝑓𝛾. Given each set of input features 𝑋, we simulate 1 million observations by drawing random samples from the Weibull distribution with these parameters 𝑘, 𝝀, 𝛾. This forms the training and validation datasets.
Next, we use the interval regression approach and train a multi-head neural network to simultaneously learn the functions 𝑓𝑘, 𝑓𝜆, 𝑓𝛾. We compare the predicted parameters against their ground truth values and measure the accuracy of the distribution predictions.
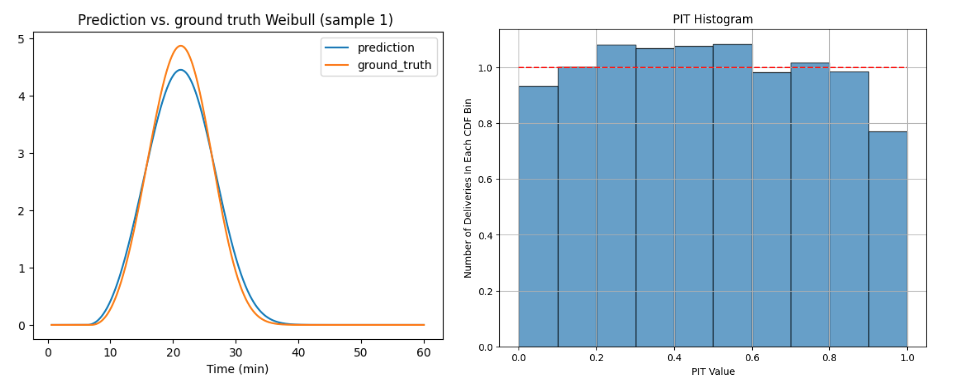
We found that our interval regression approach greatly reduced the problem of overfitting and predicted more accurate values of the Weibull parameters. As shown in Figure 6, the ground truth parameters are 𝑘 = 3.37, 𝜆 = 0.27, 𝛾 = 0.11 while their predicted values are 𝑘 = 3.22, 𝜆 = 0.28, 𝛾 = 0.10. The model calibration, measured by PIT histogram (Figure 6), is also greatly improved as a result.
Figure 6:Interval regression provided accurate Weibull parameters and calibration scores
Interval regression allows us to simultaneously learn the shape, scale, and location parameters of the Weibull distribution with high accuracy. Our next step is to apply the interval regression approach to real delivery data. We can then leverage the predicted probability distributions to give customers the most accurate possible ETAs for food delivery while reliably estimating the uncertainty in these ETA predictions.
We are still exploring the best way to predict ETA uncertainties so that we can continue to improve our service’s accuracy and transparency. Understanding ETA uncertainty also enables more efficient allocation of Dashers and better route planning. This probabilistic approach represents a significant step forward in our mission to provide the best possible delivery experience for our customers and partners.
Leveraging multitask learning for diverse ETA scenarios
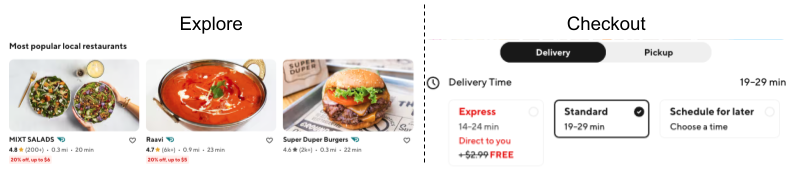
The consumer journey of placing a delivery order comes in two stages: explore stage and checkout stage, as shown in Figure 7 below. The explore stage is when consumers are browsing through stores without adding any items to their shopping cart yet. At this stage, we can only access features related to store or consumer historical behavior. In the checkout stage, consumers have built an order cart, so we also access item information. We used models trained individually to support these two stages but we found that this can lead to estimation inconsistencies. Big differences surprise consumers in negative ways that undermine their trust in our estimates. Our initial attempt to mitigate this has been to enforce an adjustment on the later stage based on former estimations. This adjustment improved consistency but lowered accuracy. In the later stage, the estimation is usually more accurate because of better data availability. This adjustment is based on estimation from former stages, which introduces reduced accuracy. To address the inconsistency without hurting accuracy, we’ve implemented a multitask learning approach to develop our ETA prediction model. This strategy allows us to handle different ETA scenarios together, leading to more consistent and efficient predictions. Let’s dive into the specifics of our approach and its benefits.
Figure 7:Explore stage vs. checkout stage. On the left, during the explore stage, the ETA shown represents the delivery duration per store without order information. On the right, during the checkout stage, the ETA shown represents the delivery duration per order.
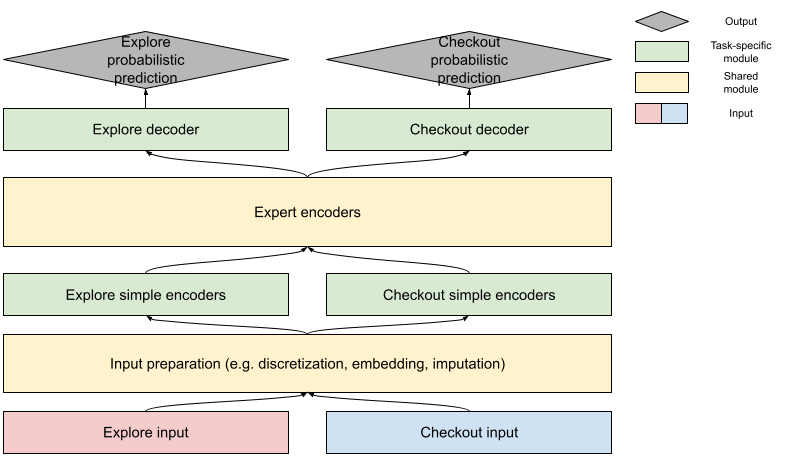
Shared vs. task-specific
Coming up with an ETA prediction involves developing both explore and checkout probabilistic predictions. These two tasks have much in common, with labels — actual delivery duration — shared between both. In the majority of samples, the store- and consumer-related feature values are very close. So we can expect the learned relationship between these features and labels to be similar. Considering the commonalities, it is also reasonable to share parameters representing the relationship between features and labels. But the availability of order information is different; for some real-time information, the checkout stage’s feature value distribution can be different and usually has higher correlation with the label. Because of these differences, task-specific modules handle the input difference and convert the final encoded representation into the prediction. Figure 8 shows our training design to balance the task-specific accuracy and knowledge sharing:
Figure 8: Multi-task learning framework for knowledge sharing across domains. Most trainable parameters are shared between tasks.
Co-training vs. sequential training
We began this journey with a critical decision between co-training or sequential training. Co-training, which involves training all tasks simultaneously using a shared model architecture, initially seemed attractive because of its efficient training time and use of computational resources. It also offered the potential for real-time knowledge sharing between tasks. In the end, however, we observed significant degradation in accuracy in individual tasks, likely caused by interference between tasks.
We turned instead to sequential training, where tasks are trained one after another, freezing the parameters learned during previous tasks and training the task-specific parameters for later efforts. Despite being more time-consuming, this approach proved superior for ETA prediction. By isolating the training process for each task, we were able to reduce noise from other tasks and better fine-tune task-specific parameters. Crucially, this method facilitated effective learning transfer by sharing parameters between tasks while minimizing interference.
The sequential training approach that we implemented begins with training our model on checkout tasks. Once this task is well-learned, we freeze all checkout-related parameters and move on to train the light-weighted explore-specific parameters. Because the checkout task has higher priority and richer information, it’s better to train the majority of parameters, such as embeddings and expert encoders, on it. Accuracy improvements in the explore task also show the successful knowledge transfer.
Benefits of multitask training
The benefits of this multitask learning approach have been substantial and far-reaching. First and foremost, we’ve achieved remarkable consistency improvement in ETA predictions across different stages without sacrificing accuracy. Moreover, despite the sequential nature of our training process, this approach has proved more efficient than training separate models for each stage. The shared components provide a warm start for other scenarios, simplifying development and reducing velocity, a crucial consideration at our scale of operations.
Perhaps most excitingly, we’ve observed significant learning transfer between stages, improving explore task performance through fine-tuning the checkout task model. This opens the possibility of transferring learned patterns to even more tasks, for example using the store embedding for other downstream business problems.
Multitask learning has been a cornerstone in improving our ETA accuracy. By leveraging the strengths of sequential training and the benefits of multitask learning, we’ve created a more robust, efficient, and accurate ETA prediction system. As we continue to refine and expand our multitask learning approach, we’re excited about its potential to further enhance our ETA predictions, ultimately leading to better customer experiences, more efficient partner operations, and smoother Dasher deliveries.
Charting the future of delivery time estimation
As we conclude our deep dive into DoorDash’s latest advancements in ETA prediction, it’s clear that our journey toward more accurate and reliable delivery times has yielded impressive results. The remarkable 20% relative improvement in ETA accuracy stands as a testament to our team’s innovative approach and relentless pursuit of excellence. We enhanced precision for both large and small orders, long- and short-distance deliveries, and during both peak and off-peak hours. This advancement directly improves our customer experience by minimizing unexpected delays and preventing premature arrivals. As a result, our customers can now place greater trust in our estimated delivery times, allowing them to plan their schedules with increased confidence.
This significant leap forward is the culmination of several advanced techniques. Our simplified MoE architecture, with its parallel encoders and novel combination approach, has proven adept at handling the diverse scenarios inherent in food delivery. Advanced feature engineering, which leverages embeddings and time series data, has enhanced the model’s ability to capture nuanced patterns and temporal dependencies. The multitask learning approach and its sequential training have improved consistency across various ETA scenarios while facilitating valuable knowledge transfer between tasks. Finally, the introduction of probabilistic predictions expands our model’s potential by enriching predictions with more probabilistic context.
These advancements have had a profound impact on DoorDash’s operations, leading to more efficient logistics, improved customer satisfaction, and a more seamless experience for our entire ecosystem of customers, Dashers, and merchants.
Nonetheless, we recognize that the pursuit of perfect ETAs is an ongoing journey. Looking ahead, we’re excited to explore new frontiers in delivery time estimation. Our commitment to innovation remains unwavering. We believe that by constantly improving our ETA predictions, we can create an even better experience for everyone in the DoorDash community. We hope this blog post has provided valuable insights into the complex world of ETA prediction and the innovative solutions we’re implementing at DoorDash.
Acknowledgments
Special thanks to Vasundhara Rawat, Shawn Liang, Bin Rong, Bo Li, Minh Nguyen, Kosha Shah, Jie Qin, Bowen Dan, Steve Guo, Songze Li, Vasily Vlasov, Julian Panero, and Lewis Warne for making the ETA model improvements possible.
At DoorDash, we’re proud to celebrate the diverse cultures that make up our merchants, our consumers, and our people. Alongside our Unidos@ DoorDash Employee Resource Group, we’re coming together during National Hispanic Heritage Month to honor the rich cultures and significant contributions of Americans whose ancestors hail from Spain, Mexico, the Caribbean, Central, and South America.
Throughout September and October, we’re celebrating trailblazers in our workplace, communities, and taking moments to celebrate lives who have shaped and continue to shape our future.
We kicked off Hispanic Heritage Month with an in-office farmers market in collaboration with our Workplace Experience Team in our Arizona office hub, an in-person AMA with Fair Trade Cafe owner Stephanie Vasquez, and a SummerFest farmers market at our HQ in San Francisco.
Throughout the rest of the month, we’ll have exciting in-person and virtual events including a Mexican Independence Day celebration in our Mexico City office and two community service events, hosting respective blood drives in Mexico City and Tempe.
We’ll test our people’s knowledge of Hispanic culture through a trivia event, chat with co-founders of the Unidos ERG Richard Furtado and Jovonnie Gonzales about the impact of Hispanic culture on their professional lives, and hear from our Chief People Officer and Unidos@ executive sponsor Mariana Garavaglia about her career journey during a Paint & Sips event.
Throughout the year, we provide learning and development opportunities to keep the conversation going, including how to succeed as a Latina in the global work environment, accountability for equity and inclusion, and uncovering your authentic self at work.
The independent contractors who do deliveries through DoorDash — “Dashers” — pick up orders from merchants and deliver them to customers. That process, however, is far more complex than it appears to be on the surface. Dashers, particularly those new to the process, sometimes need support to resolve issues they encounter in the delivery process. This post describes how we have worked to improve the existing Dasher support system using large language models, or LLMs, and a retrieval augmented generation system, or RAG. We also describe how we manage the improved system with LLM Judge, LLM Guardrail, and quality evaluation.
When Dashers encounter difficulties during delivery, they can reach out to DoorDash support. We provide automated solutions and can connect Dashers to human support agents as needed. The automated support system typically resolves issues faster than human agents can because Dashers are connected instantly to a system that provides answers at digital speed. Our existing automated support system, however, provides flow-based resolutions, relying heavily on pre-built resolution paths. This means that only a small subset of Dasher issues can be resolved quickly. Although we offer Dashers a good collection of articles in our knowledge base, three issues limit their usefulness:
It can be difficult to find the relevant article;
It takes time to find useful information within any particular article;
The articles are all in English, but many Dashers prefer a different language.
These problems form a perfect use case for a RAG system that retrieves information from knowledge base articles to generate a response that resolves Dasher issues efficiently.
RAG adoption challenges
With the recent developments in chatbot technology, large language models, or LLMs, such as GPT-4 and Claude-3 now can produce responses that mimic human quality and fluency. But as with any sophisticated system, they do occasionally produce errors. If not addressed, these errors can lead to significant issues.
We’ve identified several challenges while working with LLMs:
Groundedness and relevance of responses in RAG system Our LLM RAG chatbot has in some cases generated responses that diverged from the intended context. Although these responses sound natural and legitimate, users may not realize that they are inaccurate. These discrepancies often stem from outdated or incorrect DoorDash-related information included during the LLM’s training phase. Because LLMs typically draw from publicly available text, including discussions on platforms such as Quora, Reddit, and Twitter, there is a heightened risk of propagating erroneous information. As a result, users may not get what they need from our chatbot.
Context summarization accuracy We must first understand the Dasher’s issue before we can retrieve the most relevant information. Additionally, if there has been a multi-turn conversation between a Dasher and our chatbot system, we must summarize the issue from that dialogue. The issue changes as a conversation progresses; the summary’s presentation affects the result produced by the retrieval system. The summarization system has to be highly accurate for the remaining parts of the RAG system to provide the correct resolution.
Language consistency in responses Language consistency is paramount, especially when users interact with the chatbot in languages other than English. Because LLMs primarily train on English data, they may occasionally overlook instructions to respond in a different language, particularly when the prompt itself is in English. This issue occurs infrequently and its occurrence diminishes as the LLM scales.
Consistent action and response In addition to responding to the user, the LLM can also perform actions through calling APIs, but the function calls must be consistent with the response text.
Latency Depending on the model used and the size of a prompt, latency can vary from a sub-second level to tens of seconds. Generally speaking, larger prompts lead to slower responses.
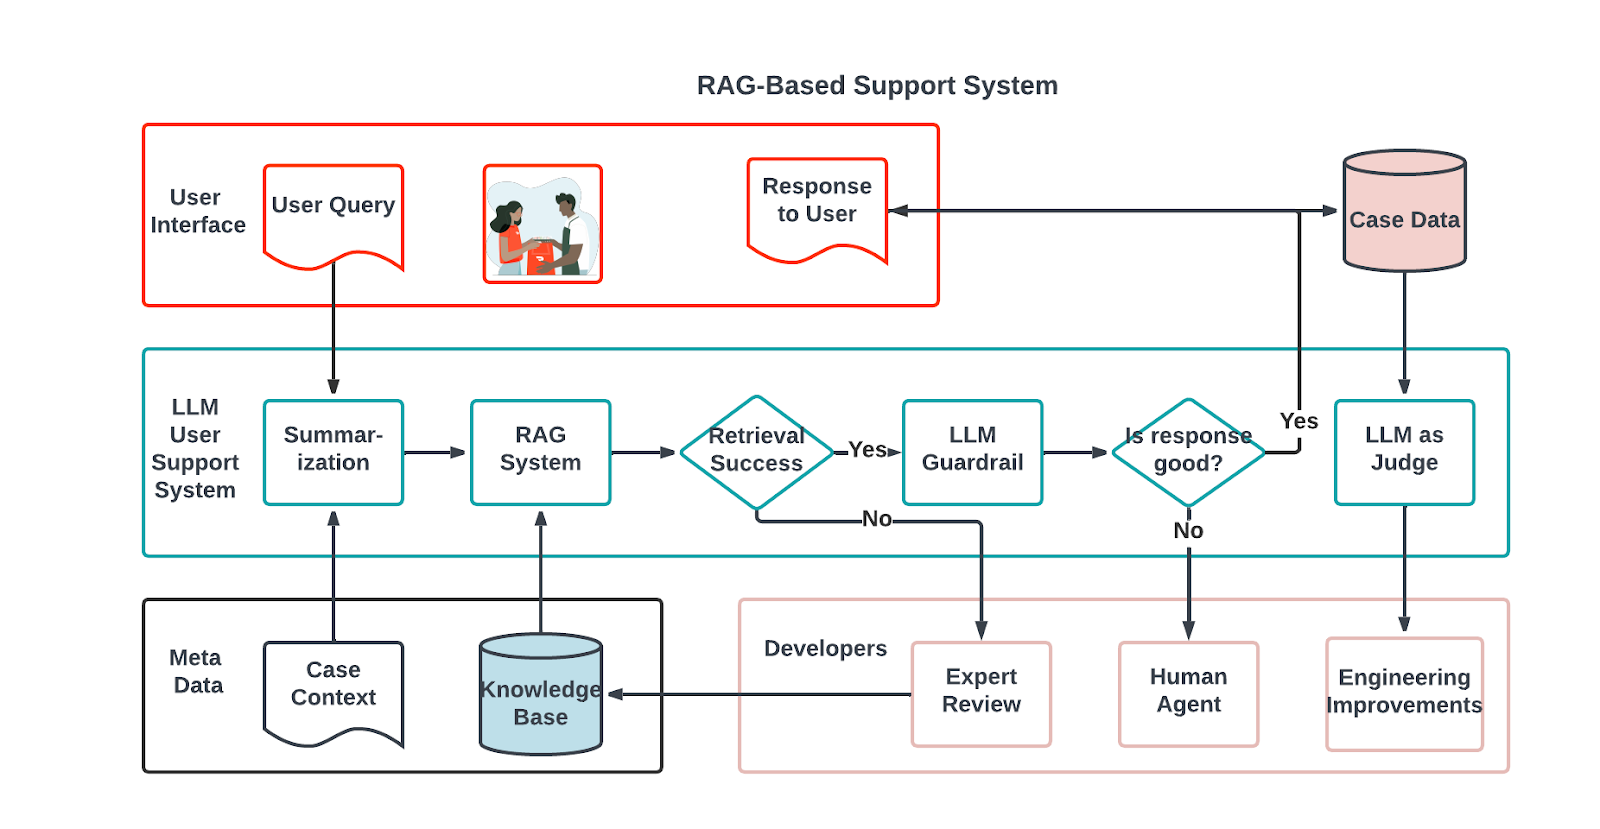
As detailed below, we developed three systems to resolve the RAG challenges: LLM Guardrail, LLM Judge, and a quality improvement pipeline as shown in Figure 1.
Figure 1: Overview of the three components of the RAG-based support system: RAG system, LLM Guardrail, and LLM Judge
ImplementingaRAG system
As noted earlier, the RAG system uses knowledge base, or KB, articles to enhance the Dasher support chatbot. The process, as outlined in Figure 2, begins when a Dasher presents an issue to the chatbot. Because the issue likely will be spread across several messages and follow-up questions, the system first condenses the entire conversation to pinpoint the core problem. Using this summary, it then searches historical data for the top N similar cases previously resolved with information from KB articles. Each identified issue corresponds to a specific article that is integrated into the prompt template. This enriched template allows the chatbot to generate a tailored response, leveraging the context of the conversation, the distilled issue summary, and any relevant KB articles to ensure that Dashers receive precise and informed support.
Figure 2: A flowchart of the RAG process: Retrieve the information based on the user’s issue, plug the information into the prompt template, and generate response
Response guardrail with LLM
The LLM Guardrail system is an online monitoring tool that evaluates each output from the LLM to ensure accuracy and compliance. It checks the grounding of RAG information to prevent hallucinations, maintains response coherence with previous conversations, and filters out responses that violate company policies.
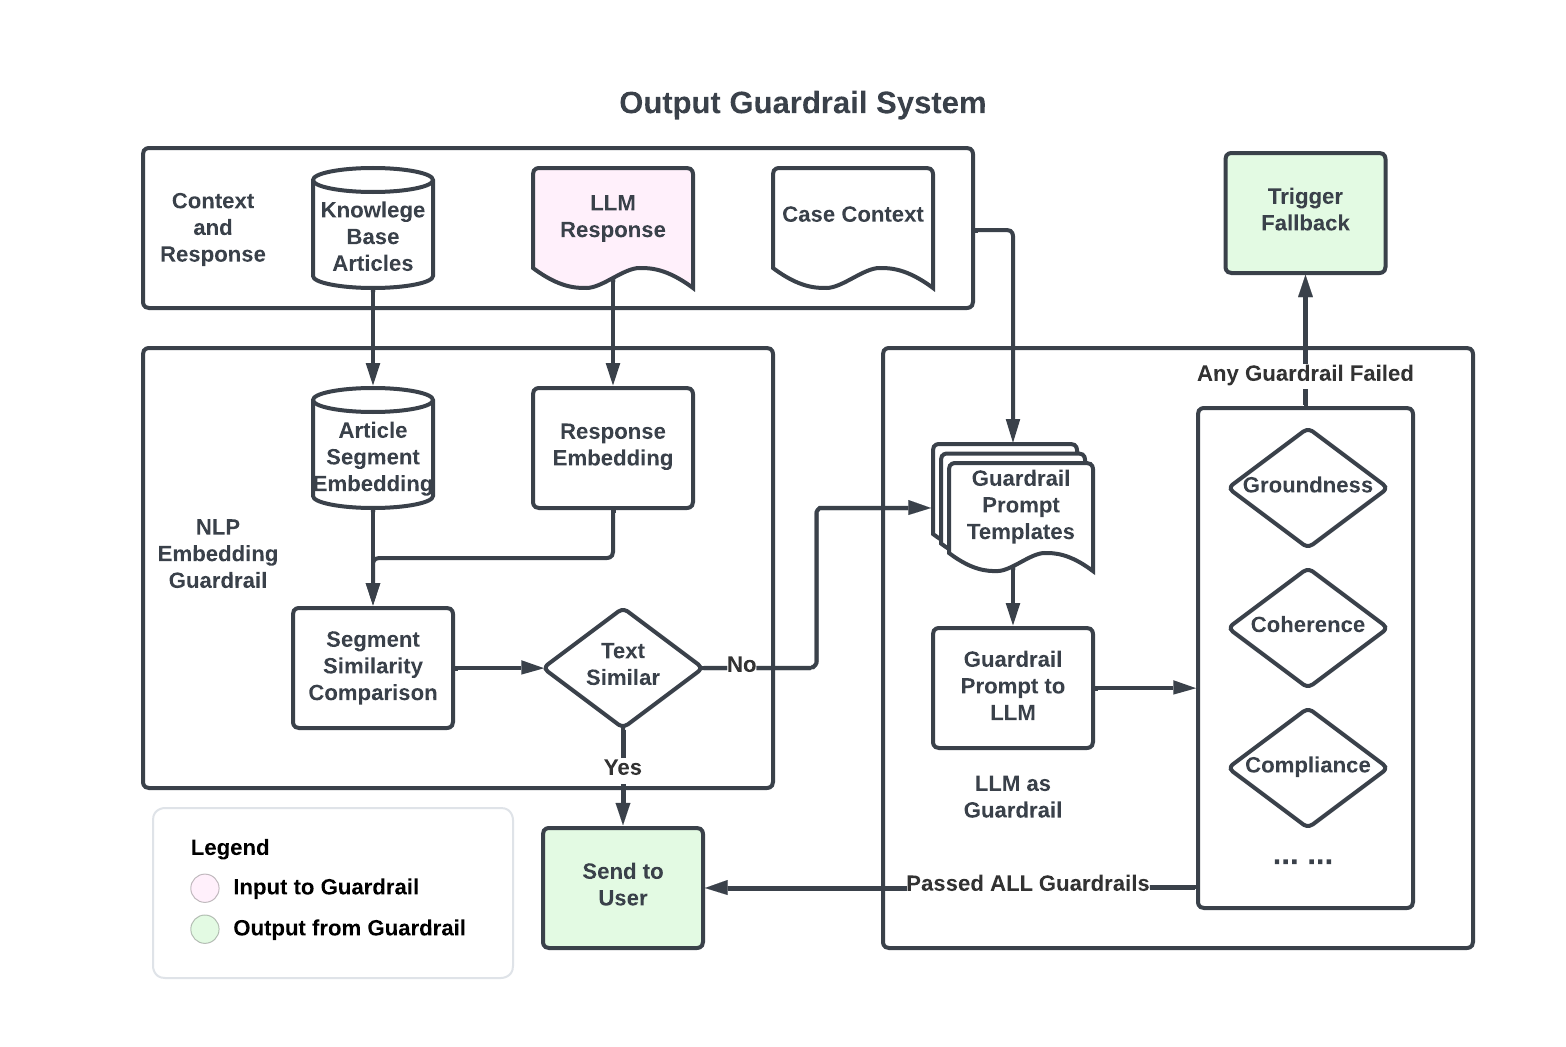
A primary focus of the guardrail system is to detect hallucinations, where the LLM-generated responses are either unrelated or only partially related to KB articles. Initially, we tested a more sophisticated guardrail model but increased response times and heavy usage of model tokens made it prohibitively expensive. Instead, we adopted a two-tier approach: a cost-effective shallow check developed in-house followed by an LLM-based evaluator as shown in Figure 3.
Figure 3: Dasher support chat response output guardrail system with two layers of quality check: A semantic similarity comparison and a backup LLM-powered evaluator
The first quality check layer is a semantic similarity comparison between the response and KB article segments. If this initial check fails, an LLM-powered second layer will further examine the response from multiple aspects including groundedness, coherence, and compliance. A response must pass all guardrail tests to be shown to the end user.
The shallow check employs a sliding window technique to measure similarities between LLM responses and relevant article segments. If a response closely matches an article, it’s less likely to be a hallucination.
If the shallow check flags a response, we construct a prompt that includes the initial response, the relevant KB articles, and the conversation history. This is then passed to an evaluation model, which assesses whether the response is grounded in the provided information and, if necessary, offers a rationale for further debugging.
LLM Guardrail’s latency is a notable drawback caused by an end-to-end process that includes generating a response, applying the guardrail, and possibly retrying with a new guardrail check. Given the relatively small number of problematic responses, strategically defaulting to human agents can be an effective way to ensure a quality user experience while maintaining a high level of automation. This guardrail system has successfully reduced overall hallucinations by 90% and cut down potentially severe compliance issues by 99%.
Monitoring LLM Judge quality
We can evaluate the LLM’s quality from multiple perspectives, including Dasher feedback, human engagement rate, and delivery speed. None of these perspectives, however, provide actionable feedback that would allow us to improve our chatbot system. So we manually reviewed thousands of chat transcripts between the LLM and Dashers to develop an iteration pipeline for monitoring LLM quality. Our review allowed us to categorize LLM chatbot quality aspects into five areas:
Retrieval correctness
Response accuracy
Grammar and language accuracy
Coherence to context
Relevance to the Dasher’s request
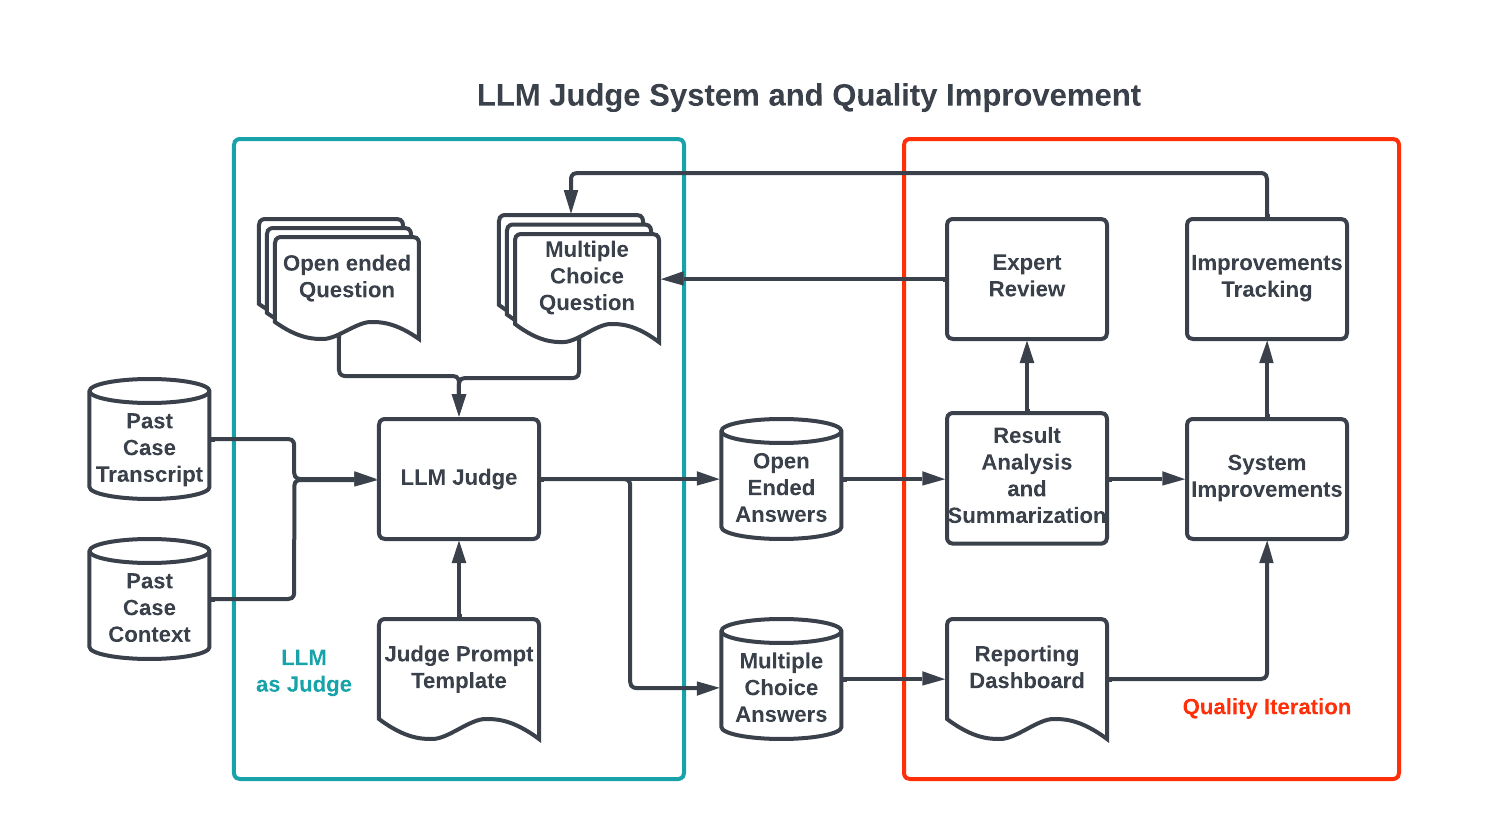
For each aspect, we built monitors either by prompting a more sophisticated LLM or creating rules-based regular expression metrics. The overall quality of each aspect is determined by prompting LLM Judge with open-ended questions, as shown in Figure 4. Answers to these questions are processed and summarized into common issues. The high-frequency issues are then built into prompts or rules for further monitoring.
Beyond the automated evaluation system, we also have a dedicated human team that reviews random subset transcript samples. A continuous calibration between this human review and the automated system ensures effective coverage.
Figure 4: Using LLM Judge results to improve the system quality: Start withopen-ended questions, then convert the answers to multiple-choice questions for improvements and monitoring
LLM quality improvement
Our system faces several quality challenges, including an insufficient knowledge base, inaccurate retrieval, model hallucination, and suboptimal prompts. Human support agents play a crucial role in addressing these issues, acting as subject matter experts, meticulously reviewing LLM responses, and guiding automated process enhancements. This collaborative effort between human expertise and machine learning is fundamental to refining the accuracy and reliability of our support system.
Knowledge base improvements
The knowledge base serves as the foundational truth for LLM responses, so it’s important to offer complete, accurately phrased articles. LLM Judge’s quality evaluation has allowed us to conduct thorough reviews and KB updates to eliminate misleading terminology. Additionally, we are developing a developer-friendly KB management portal to streamline the process for updating and expanding articles.
Retrieval improvements
Effective retrieval involves two key processes:
Query contextualization: Simplifying queries to a single, concise prompt while providing context through a comprehensive conversation history.
Article retrieval: Selecting an optimal embedding model from a few choices within our vector store to enhance retrieval accuracy.
Prompt improvements
We must refine prompts to guide the LLM accurately. This refinement process can either be straightforward or painful, depending on the base LLM model. We follow a few principles:
Breaking down complex prompts into smaller, manageable parts and employing parallel processing where feasible.
Avoiding negative language in prompts because models typically struggle with these. Instead, we clearly outline desired actions and provide illustrative examples.
Implementing chain-of-thought prompting to encourage the model to process and display its reasoning, aiding in identification and correction of logic errors and hallucinations.
Regression prevention
To maintain prompt quality and model performance, we use an open-source evaluation tool akin to unit testing in software development. This tool allows us to refine prompts quickly and evaluate model responses. A suite of predefined tests is triggered by any prompt changes, blocking any failing prompts. Newly identified issues are systematically added to Promptfoo test suites, ensuring continuous improvement and preventing model performance regression.
Our success
We’re revolutionizing Dasher support by using our new LLM-based chatbot to deploy our extensive knowledge base. Each day, this system autonomously assists thousands of Dashers, streamlining basic support requests while maximizing the value of human contributions. This collaborative system allows human support representatives to focus their energy on solving more complex problems for Dashers. Our quality monitoring and iterative improvement pipeline have transformed an initial prototype into a robust chatbot solution, creating a cornerstone for further advancements in our automation capabilities.
Looking into the future
Our LLM chatbot represents a shift from traditional flow-based systems, introducing a degree of uncertainty inherent to its underlying large language models. Ensuring high-quality responses is paramount for the success of any high-volume LLM application. Continuing to develop precise quality assessment methods will allow us to identify and narrow any performance gap between ideal experience and automated systems. While the chatbot system effectively handles routine inquiries, complex support scenarios will still require the expertise of live agents. As foundational models, ontology and RAG systems are enhanced over time, the efficacy of LLM-driven solutions also will improve. Continuous data collection and analysis are vital for guiding these enhancements to ensure that our systems remain agile and effective. As we move forward, we aim to expand the capabilities of automated solutions to address increasing complexity with the help of human customer support experts.
Stay Informed with Weekly Updates
Subscribe to our Engineering blog to get regular updates on all the coolest projects our team is working on
Please enter a valid email address.
Thank you for Subscribing!
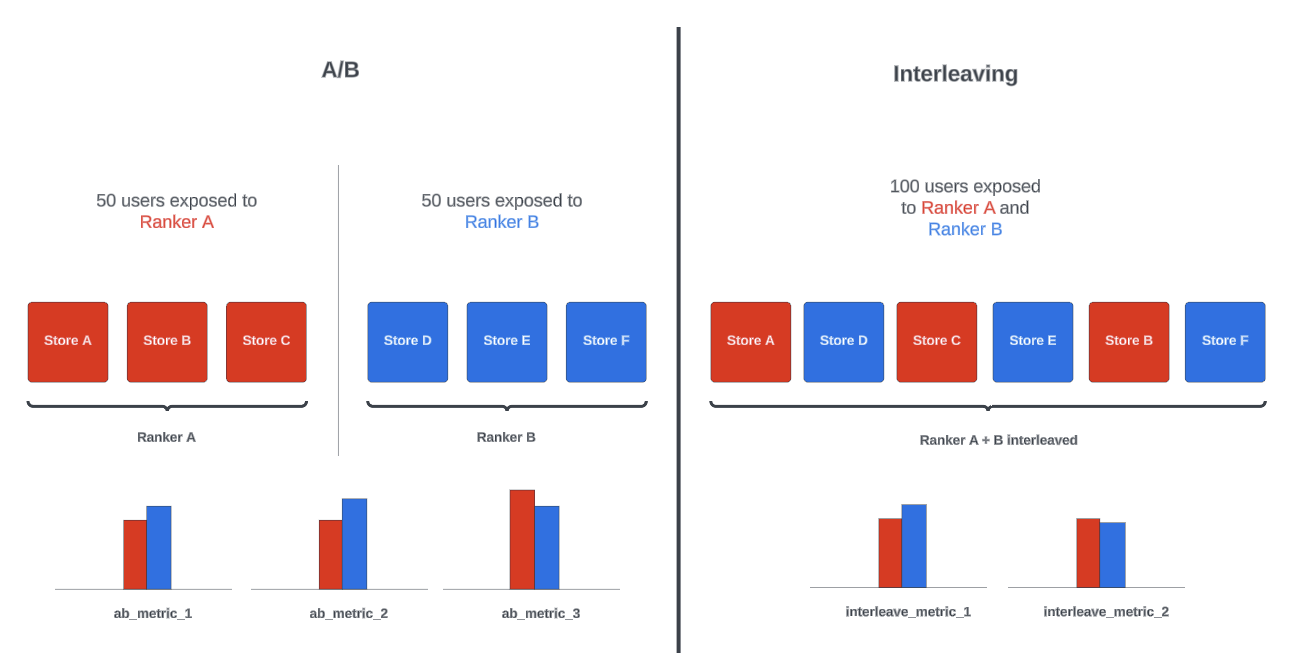
We’ve traditionally relied on A/B testing at DoorDash to guide our decisions. However, when precision and speed are crucial, this method often falls short. The limited sensitivity of A/B tests—their ability to detect real differences between groups—can result in users being exposed to suboptimal changes for extended periods. For example, in our search and ranking use cases, achieving reliable results often required several weeks of testing across all traffic, which not only delays the introduction of new ideas but also prolongs the negative impact of underperforming changes.
Interleaving design offers significantly higher sensitivity – more than 100 times that of traditional methods – by allowing multiple conditions to be tested simultaneously on the same user as shown in Figure 1. Interleaving design generally provides a more accurate and granular understanding of user preferences, allowing us to iterate more quickly and with higher confidence.
Figure 1: In a traditional A/B design, users see only one treatment variant. In an interleaving design, users are exposed to multiple treatments simultaneously, which significantly improves test sensitivity.
In this post, we dive into how we’ve implemented interleaving designs at DoorDash. We also explore how we’ve refined the design to be even more sensitive than what is reported in the industry (see Table 1), discuss the challenges we’ve faced, and provide recommendations for handling those challenges.
Table 1: This table highlights reported sensitivity improvements across various companies that used interleaving. In this post, we explore why DoorDash has been able to boost sensitivity beyond what is reported in the industry.
What makes interleaved designs highly sensitive
Almost all experimentation statistics can be summarized in the conceptual formula that looks at signal-to-noise ratio. If you want experiments that provide more clear insights, you can:
Boost the signal: Test changes that are meaningful, where hypotheses are grounded in common anecdotes or data. This also requires ensuring users are exposed to and engaged with the change.
Reduce the noise: Explain away the noise using techniques like CUPED — controlled experiment using pre-experiment data — or generate populations that are more homogenous. Alternatively, you can also opt to increase sample sizes.
Most folks have assumed that interleaving provides sensitive results by reducing noise. Specifically, because a user is exposed to all treatment conditions, the design naturally helps drive variance down because each user serves as their own control. But alongside this benefit, we noticed that setting up interleaving helps improve the signal in the data through two properties, as shown in Figure 2:
Identifies non-engagement: Interleaving allows identification of users who are not actively engaging with the content so that they can be removed.
Identifies noncompetitive pairs: We also can identify cases in which rankers generate similar-looking lists, allowing us to boost the signal by removing data where recommendations between treatment and control is too similar.
Figure 2: Interleaving designs have three drivers that improve sensitivity.
Both of these techniques allow you to improve interleaving sensitivity even further because they effectively eliminate data dilution, as seen in our previous post on dilution. In the next section, we elaborate on why these three drivers are so important in driving up sensitivity.
Controls for within subject variance
A fundamental reason for why interleaving designs are so much more sensitive than regular A/B designs is that the same user is tested under multiple conditions, allowing each participant to serve as their own control. For example, the device used, a user’s search preferences, or other relevant information are all controlled by the nature of the design. Internally, when explaining the benefits of interleaved designs to stakeholders, we say that it’s like running A/B tests in which all your subjects are identical twins. But not just any twins — these are perfect clones who share the same phenotype and environment right up to the moment you run the test. This imagery helps people understand that interleaved designs have an enormous potential to drive down variance. Despite the widespread use of within-subjects (repeated) designs in industries such as pharma, education, neuroscience, and sports science, their relative lack of adoption in the tech industry remains a surprising anomaly.
In interleaving, the effect of within-subjects design is even more pronounced because we simultaneously present the treatment conditions on the same screen at the same time, minimizing confounding variables such as learning effects, crossover effects, or other time-based confounders as shown in Figure 3. In the context of DoorDash, one of the biggest confounders is user hunger level when they come to our app. Rather than presenting one ranker on Day 1 and another ranker on Day 2, presenting them in the same context allows us to remove noise driven by satiety levels.
Figure 3: Here we illustrate the major differences resulting from design choices. Interleaving design simply extends a within-subject design but also provides control over time-based confounders. Source: DataTab.net
Handles dilution from competitive pairs
Interleaved designs also drive up sensitivity by showing if the experience exposed to the user is truly different between treatment and control. An interleaved design generates final output from two lists, allowing us to identify immediately whether those lists are too similar, as shown in Figure 4 below. In most machine learning applications, different modeling approaches are improvings things on the margin. In many cases, the search results returned by two rankers will largely overlap. An interleaved design lets us measure this overlap and analyze the data for competitive pairs — where rankers disagree on the recommendation — which leads to a signal boost.
Figure 4: The original lists used here in interleaving are essentially identical except for the last elements. This means that if a user clicks on any of the top four choices, they are not actually contributing to signaling which ranker is preferred.
Handles dilution from non-engagement
An interesting observation we made when looking at interleaved experiments – as well as search and ranking experiments in general – is that many user actions make it look as if the user is not paying attention or making any choices on the presented content. For instance, although we would generate a carousel with interleaved options, the user would not actively engage with the content and make a decision. As a result, including this data in interleaved analyses dilutes the signal.
Here is another way to understand non-engagement. Let’s say we present a user with two drinks – Coke and Pepsi – and ask them which they like more. If the user does not engage or refuses to try any options, it might indicate:
The user is not interested in the presented results.
The user is not in a decision-making mindset at the moment.
While these are important insights, examining data from this undifferentiated feedback does not help to determine user preference or understand which drink is preferred. Attention and non-engagement is a fascinating research subject; many folks approach it by looking at additional metrics such as dwell time or how often a user backtracks as per Chucklin and Rijke, 2016. Fortunately, interleaving allows us to identify non-engagement more effectively so that we may remove impressions that are not meaningful. If a user does not take an action, we simply remove the exposure rather than marking the performance of the interleaved ranker as a tie.ctively so that we may remove impressions that are not meaningful. If a user does not take an action, we simply remove the exposure rather than marking the performance of the interleaved ranker as a tie. A/B tests can’t effectively address non-engagement because they treat all data equally, including non-engaged interactions, which dilutes the signal and obscures true user preferences.
Results
Table 2 shows results across five online experiments in which we provide the average relative sensitivity improvement across different methods relative to an A/B setup. Across several experiments, we found that removing dilution helped boost interleaving sensitivity even more, which leads to much smaller required sample sizes. These results were so surprising even to us that we had to stop several times to conduct additional A/A tests to validate that we had not introduced a bug in our SDK, analysis pipeline, or metrics computation.
Experiment
Vanilla Interleaving
Vanilla Interleaving + Removing Dilution
% Traffic Used
Exp 1
34x
282x
<5%
Exp 2
67x
482x
<5%
Exp 3
68x
312x
<5%
Exp 4
109x
545x
<5%
Exp 5
60x
301x
<5%
Avg Improvement
~67x
~384x
Table 2: We observed very large sensitivity gains across several experiments. Overall, removing dilution helped improve sensitivity even more. Note that we observed these results while interleaving traffic was getting 1/20th of the A/B traffic.
It’s important to highlight that the sensitivity improvement depends on the metric. For clickthrough rate, we have observed half of the sensitivity boost observed in the checkout-conversion metric. Nonetheless, across all use cases we found that removing dilutive exposures drives very large gains in sensitivity.
Configuring and evaluating interleaving experiments
Interleaved designs are fully supported at DoorDash, with seamless integration across our SDK, experimentation UI, and internal analysis tools. This tight integration ensures that teams accustomed to A/B testing can transition to interleaving designs in a standardized manner, minimizing onboarding effort. In this section, we explore key implementation details for how we incorporated interleaving randomization in our experimentation SDK.
Traditional A/B experiments know the values that should be served at the time the experiment is configured. At its simplest, an A/B experiment would be configured with the values of either false — for the control experience — or true — for the treatment experience that enables the feature. At runtime, the business logic would read the true/false value directly from the experiment.
Consider this traditional A/B client interface:
interface TraditionalClient {
  fun getBoolean(
      // The name of the experiment to evaluate
      name: String,

      // Contextual information to determine outcome and randomization
      context: Context,

      // A safe value to use in case of errors
      fallback: Boolean,
  ): Boolean
}
Calling the client could look like this:
val isEnabled = client.getBoolean("is_new_feature_enabled", Context(), false)

If (isEnabled) {
    newFlow()
} else {
    oldFlow()
}
Interleaving differs from traditional A/B in that the lists of objects being interleaved cannot be known at configuration time. However, this distinction does not prevent us from using our existing experiment objects to control an interleaving experiment flow. For example, an experiment interface still helps us with:
Deciding who should be part of the experiment
Slowly adding more users to the experiment
Remotely turning off the experiment
Selecting a winning variant
For interleaving experiments, the variants tell us which, if any, lists should be interleaved instead of explicitly telling us what value to serve.
An interleaving client would look like this:
// The client can interleave any object as long as it implemented 'Interleavable'
interface Interleavable {
   // The type of object. 'store' as an example
   fun itemKey(): String

   // A unique key representing the underlying object. The store's ID an example
   fun itemId(): String
}


// Essentially a named list of objects that may be interleaved
interface InterleaveData<T : Interleavable> {
   val name: String
   fun items(): List<T>
}

interface InterleavingClient {
   // Templated interface. Pass in any object you want to interleave as long as it is "interleavable"
   fun <T : Interleavable> interleave(
       // A unique identifier used to connect the result to an analysis metric
       interleaveId: String,

       // The name of the experiment that controls if the experiment is enabled and what lists to interleave
       experiment: String,

       // Context that defines the user. Determines whether the user has access to the experiment
       context: Context,

       // A fallback list of items if anything goes wrong
       fallback: InterleaveData<T>,

       // A list of the named lists that might be interleaved as part of the result
       vararg data: InterleaveData<T>,
   ): List<T>
}
The experiment can be configured to separate different groups of users into segments. In traditional A/B, the matched segment ultimately decides what value is served to the user. Here, the matched segment decides which of the lists should be interleaved. This means that at runtime, you can pass in an arbitrary number of lists and dynamically choose a subset of them to interleave.
Example:
val control = FixedInterleaveData(
   variantName = "control",
   items = listOf(Food("apples"), Food("bananas"), Food("cucumbers")),
)

val treatment1 = FixedInterleaveData(
   variantName = "treatment_1",
   items = listOf(Food("oranges"), Food("apples"), Food("cucumbers")),
)

val treatment2 = FixedInterleaveData(
   variantName = "treatment_2",
   items = listOf(Food("oranges"), Food("tomatoes"), Food("bananas")),
)

val result = client.interleave(
   interleaveId = "8346168",
   experiment = "food_experiment",
   fallback = control,
   context = Context(),

   // 3 different named lists are passed in
   control,
   treatment1,
   treatment2,
)
Here we have 3 named lists of food: control, treatment_1, and treatment_2. The experiment food_experiment will ultimately decide which of these lists should be woven together based on the passed-in context and how food_experiment was configured. One, two, or all three lists could be selected.
You may notice that the underlying lists of food items are configured via fixed interleave data. Each array of items is realized immediately before even calling interleave. This could be problematic if you plan to test out multiple lists and the cost of generating each list is high. To avoid expensive and time-consuming calls, we also offer lazy interleave data:
data class LazyInterleaveData<T : Interleavable>(
  override val variantName: String,
  val itemGenerator: () -> List<T>,
) : InterleaveData<T>
The engineer needs to provide the function responsible for generating the list without realizing the list immediately. The underlying interleaving client will execute the generators only for the subset of lists needed to interleave. This can help mitigate performance issues when the interleaved lists are very large.
Interleaving algorithm
As an abstraction, think of each list to be interleaved as containing players to be drafted for a single team. The same player may show up on each list but at a different rank. Assume each list of players is ordered from most- to least-favorite. To continue the analogy, let’s look at an example in which we label the lists as teams.
The interleaving algorithm may more easily be explained with N team captains drafting their players. Imagine the following:
Each captain has a list of players ordered from most- to least-desirable.
Some players may exist on a few of the captains’ lists, while others may only exist on a single captain’s list.
During each turn, all captains recruit a player to their team. Each captain calls out the most desirable player who has not already been selected.
If all captains select different players, then we insert the players into each list in order of the captain’s preference. The players then belong to the respective captains who selected them. All players are marked as competitive.
If some captains attempt to select the same player during a turn, we find an untaken player in the captain’s list. This player and all players added this turn are marked as not competitive.
Competitive players will always come in group sizes equal to the number of captains.
If any captain is unable to select a player in a given turn, then all players selected in that turn are marked as not competitive.
Among the competitive selected players, there will be an equal number of picks by each captain.
Nearly identical lists example
This example highlights that the two captains make similar choices for the first four items, so those items are marked as not competitive. Only the last two items reflect a clear difference in captain recommendations.
Non-matching lists example
In this example, the first player is preferred by both captains. Because both captains have the same preference, performance due to player A is not considered when measuring the captains’ success in drafting players. Using data from noncompetitive pairs would hurt the signal we can measure in the experiment.
How we handle event attribution
One of the most challenging aspects of setting up interleaving at DoorDash is figuring out how to handle event attribution. We’ve done an extensive literature review on this topic and talked with multiple practitioners from other companies that implemented interleaving. We were surprised to find very little consistency in the approach to performance attribution.
The most common approach is to aggregate a preference score across either a single or multiple sessions or even over days for each user. The outcome, run through the formula shown in Figure 5, computes for each user a score that encapsulates if they like ranker A or B based on their click behavior.
Figure 5: This is the preference score formula often used to analyze interleaved experiments.
While this approach can work, it has two challenges:
Emphasizes clicks: This approach limits your ability to look only at clicks to compute preference scores. For example, one ranker would get a win from driving more clicks even though downstream metrics such as checkouts are affected primarily by a different ranker.
Does not handle dilution: As mentioned before, most of the data in search and ranking has no metric activity. The user effectively contributes a zero to all treatments. Including ties makes interleaving setups less sensitive.
Overall, we went with an approach that favors direct attribution. We track metrics associated with user behavior at the most granular level – the individual item level. Figure 6 below showcases how we collect data and aggregate it before running a paired t-test. Note that the whole process is handled automatically in our system; users don’t have to write any complex pipelines for generic use cases and an analysis can be set up in less than two minutes.
Figure 6: The top table shows a few examples of interleaved exposures, while the bottom table shows aggregated data at the user level. Internally, we make sure to store metrics associated with each interleave_id/item_id pair so that we can compute metrics such as click conversions or subtotals.
Removing dilutive exposures poses a challenge by making it difficult to draw cross-experiment comparisons for a given metric. We solve this problem, however, by translating the localized impact to global impact, assuming that both control and treatment units get the new treatment ranker. Figure 7 below highlights how localized and global impact estimates are presented to our users. A user can then use the global impact metric to better understand if their treatment will meaningfully move the needle.
Figure 7: The average treatment effect shows a roughly 33% drop in conversion. Although this is a substantial drop, the impact is extremely localized. When we look at the impact of the change on the global metric, it is less than 0.0027%, a figure that might be challenging to detect in an A/B test.
Interleaving challenges
Interleaving designs are not a free lunch for improving experiment sensitivity. Overall, interleaving experiments generate more complexity and come with generalizability issues. In the following, we outline some of the challenges and our recommendations for how to address them.
Measuring performance differences
In setting up an interleaved experiment, we need to generate the interleaved lists prior to randomization, which generally means making calls to two ranking algorithms. Even if the calls are made asynchronously or done through lazy evaluation, the latency impact on the system can be substantial enough that the interleaving setup will fail to capture a degradation. Consider this scenario:
Ranker A shows less accurate results, but has very good latency and does not disrupt the user experience.
Ranker Bshows more relevant results, but is 40% slower than ranker A and could disrupt the user experience.
During initial testing of the two rankers in an interleaved setup, it may seem that ranker B outperforms A in terms of relevance and user satisfaction based on metrics such as click-through and conversion rates. This conclusion would be misleading. Interleaved metrics might not capture ranker B’s latency and subsequent performance degradation, offsetting the impact of ranker B’s more relevant results.
Recommendation
Fortunately there is a very simple solution to this problem. As shown in Figure 8 below, you can analyze interleaved traffic against reserved traffic in the context of an A/B experiment by specifically targeting app performance metrics. Specifically, divide the traffic into interleaved and reserved; because the traffic allocation is random, you can run a regular A/B test. If the resulting metrics indicate that the interleaved traffic has caused substantial app performance degradation, you can then follow up to optimize the ranking system’s reliability. Note that this solution is free because we generally recommend that users perform an A/B test in parallel with an interleaved experiment.
Figure 8: In this example, we split traffic so that 4% of users flow to an interleaving experiment and the rest are in reserve. When we split traffic between interleaved and reserved, the process itself looks like a simple A/B test. This means that we can analyze metrics for app performance by simply comparing the interleaved traffic against reserved traffic.
External validity and interference effects
Interleaving experiments can suffer from issues related to external validity. In practice, users typically interact with a single ranker at a time rather than a blend of multiple rankers. Depending on circumstances, this means that the interleaving setup might not generalize to actual user behavior outside of the testing phase. Moreover, by exposing a user to multiple alternatives, we forgo our ability to measure long-term effects; we can only measure what users prefer at that moment when they can compare and contrast multiple list items.
To best illustrate why external validity is important, consider the hypothetical job offer example shown in Figure 9 below. If you’re asked to select a salary — either $50,000 or $100,000 per year — you likely will behave rationally and choose the higher amount. But if you’re given only one choice — $50,000 — without the ability to compare and contrast, the likelihood of you accepting that offer will be higher than zero. In other words, if users are offered only one choice, they might take it simply because there is no alternative. This highlights that interleaving designs can effectively amplify user preferences even when A/B testing might lead to a flat effect.
Figure 9: In an interleaved setup, the contrast between choices can be too visible to a user, so the preference signal might be stronger than what would be observed in an A/B test. This issue could impact interleaving external validity.
Recommendation
For teams just starting to run interleaved experiments, we recommend running a two-phased approach to build empirical evidence for the link between interleaved and A/B test results. Note that the two phases can run in parallel. The ultimate goal is to understand if the interleaved setup generates a similarly consistent set of conclusions as an A/B experiment. If after a dozen experiments the relationship between interleaved metrics and A/B metrics is strong, you can rely more often on an interleaved setup alone to make ship decisions.
Keeping up the pace
Another challenge with interleaved designs is that they provide such drastic sensitivity improvements that a team may not yet have built a process to take advantage of the improved velocity. Consider what the process might look like before and after adopting interleaving, as shown in Figure 10:
Before interleaving: Teams typically ran experiments for two to six weeks. The focus was primarily on significant model changes likely to yield clear results, which lead to emphasizing zero-to-one work rather than incremental improvements such as removing features or testing refactoring work. Experiment decisions were made during weekly review meetings where new experiments were discussed and planned. Changes were tested on a large proportion of traffic — more than half. This increased the risk of exposing a significant number of users to potentially suboptimal model variants for extended periods.
After interleaving:The time required to reach conclusive results shrank from weeks to hours. The decision-making process has been automated and now focuses on minimizing downside risk. When metrics degrade, engineers can roll back changes quickly without waiting for the next review meeting. Successful experiments are promoted promptly to A/B testing to assess long-term impact. Decision-making becomes decentralized, allowing individual team members to initiate experiments within specified guardrails. The exposure blast radius to suboptimal variants is minimized to less than one to two percent of traffic; the ability to measure the impact of changes efficiently frees teams to dedicate more effort to incremental improvements.
Figure 10: The leftmost panel shows the time and different steps involved in the A/B experimentation lifecycle. Interleaving could potentially eliminate data collection while helping to shrink the duration of other steps. In practice, however, humans don’t have the ability to develop and operate at such heightened sensitivity, so most interleaving experiments end up running much longer than needed. The panel on the right is a more realistic description of how interleaving may change durations for various steps over the long term.
To get the highest possible leverage from interleaving, you need to optimize other parts of the process.Although methodological advancements play a key role in driving experimentation velocity, it’s also important to reflect on the role of process and culture. If teams are not structured to operate with extreme levels of ownership, a clear guardrails process, and minimal red tape, increased levels of sensitivity may not help drive faster and better product iteration. In the next section, we detail how teams can improve their capacity to run more experiments to keep up with the improvements inherent in interleaving.
Recommendation: Reduce ramp, collection, and decision times
First, we recommend that teams track a narrow set of industry metrics that provide a good signal about ranker success. It is common for search and ranking experiments to have dozens of metrics that examine the impact of a change from multiple points of view. It is important, however, to keep the cognitive load low, allowing engineers to focus on only two or three metrics that have clear tradeoffs. Our recommendations include:
Metric
Description
Why?
Click rate
Measures the number of clicks a user makes to different items, weighted by number of exposures.
Rankers with higher clicks can indicate that users are more engaged with the content.
Checkout conversion
Measures the number of checkout events weighted by number of exposures. If a user was exposed to an item, did they convert that item to a purchase?
Rankers should ultimately move meaningful business metrics rather than only generating clicks. Checkout conversion is a clear metric.
Gross order value (GOV)
Measures the subtotal of the item’s order value, weighted by number of exposures. Is the user generating higher value orders thus driving higher revenue?
Rankers should try to maximize the overall order value, not just the likelihood that a user will checkout.
With these three metrics, users can then follow the decision-making framework below:
Scenarios
Decision
Clicks 🟢 Conversion 🟢 GOV 🟢
Ship as an A/B because the treatment ranker drives all metrics in a positive direction.
Clicks 🔴 Conversion 🟢 GOV 🟢
Ship as an A/B. Although treatment ranker drives fewer clicks, it ultimately impacts highly relevant topline metrics like conversions and GOV. Fewer clicks simply means that the ranker drives more meaningful clicks.
Conversion 🔴 GOV 🟢 or Conversion 🟢 GOV 🔴
Ranker drives more orders, but of smaller size, or fewer orders, but with larger size. Encode the tradeoff to maximize overall GOV.
Remaining scenarios
All other scenarios require the team to continue iterating because the impact is negative or flat; you may be driving clicks without increasing GOV or conversion.
By focusing on these metrics and decision-making framework, you can heavily reduce the durations involved in ramping, collecting, and — most importantly — deciding on next steps. This keeps the team’s cognitive burden for decisions low.
Recommendation: Reduce development times
While new work will always demand the most effort, the increased sensitivity of interleaving designs allows for testing changes that were previously impractical. Here are some examples of what interleaving makes possible:
Pruning features: With interleaving, we can quickly and accurately determine the impact of removing certain features from ranking algorithms. For example, if there are features that are brittle and hard to maintain, we can test their removal to see if they are truly necessary for maintaining ranking quality. This could lead to a leaner, more maintainable codebase without compromising performance.
Micro-optimizations: Interleaving allows us to test small, incremental changes that might have been too subtle to measure accurately with traditional A/B tests. This includes tweaks to ranking weights, minor adjustments in algorithm parameters, or slight changes in feature calculations. These micro-optimizations can accumulate to significant improvements in the overall user experience.
Operator adjustments: It is rare for ranking results to be used as-is. In practice, some results are boosted by operators outside of the ranking loop. Unfortunately, those changes are rarely vetted and tested. With interleaving, operators can have better visibility into whether their adjustments are effective.
Handling edge cases: It is difficult to optimize a system against uncommon query types or edge cases when building ranking models. With interleaving, it becomes easier to measure incremental improvements from optimizing the tail in search results.
In summary, interleaving unlocks the potential to test a broader range of features iteratively and with greater precision.
Recommendation: Set guardrails
Because experimenters are given greater leverage and ownership over interleaving, proper guardrails must be in place to prevent mistakes and discourage behavior not aligned with user interests. Our recommendations include:
Cap the traffic at 2% to 5%: Enforce a strict cap on the traffic allocation for any given interleaving experiment. Use monitoring tools to ensure compliance and automatically alert or halt experiments that exceed this limit. Given the highly sensitive nature of interleaving designs, there should be no reason to increase the blast radius beyond 5%.
Increase transparency:Ensure that all of a team’s experimental changes are done so that team members and managers can get a bird’s-eye view of everything. Dashboards that collocate all actively running experiments and draw a heatmap from metric movements can quickly highlight any required actions. We also recommend creating a shared communication channel for alerts.
Automated rollbacks: Establish and enforce automated rollbacks that stop the experiment when appropriate. The scenarios outlined in metric tradeoffs can be fully encoded to automate this decision-making process.
Review only A/B promotions: Devote primary focus on reviewing decisions to promote to the A/B phase rather than reviewing interleaving experiments.
Recommendation: Stack your wins before moving to A/B phase
To increase velocity, don’t immediately promote any winning ranker candidate from an interleaving experiment to an A/B setup. Because interleaving designs offer more than a 100-fold increase in sensitivity, an A/B experiment might not be powerful enough to capture a change. Instead, we recommend that engineers continuously iterate within an interleaving setup and only move a ranker to A/B after they have stacked sufficient improvements.
Figure 12: An individual experiment change might be indiscernible if relaunched as an A/B. Instead, we recommend continuing to stack improvements in an interleaving setup and only ship to A/B when cumulative interleaved metric gains are large.
Conclusion
Interleaving can be a game changer in achieving heightened experiment sensitivity. By significantly boosting the sensitivity of experiments, it allows detection of meaningful changes much more quickly and accurately than in traditional A/B testing. More importantly, it allows testing within a much smaller blast radius, keeping the majority of traffic safe from being exposed to poor-quality ideas.
Interleaving’s success hinges on its ability to reduce noise and increase signal through within-subject variance control and to handle dilution from noncompetitive pairs and non-engagement. These advantages make interleaving an essential tool for our teams, enabling them to make data-driven decisions rapidly and with greater confidence. Nonetheless, to harness the full potential of interleaving, it’s crucial to establish robust guardrails and change the culture and process of experimentation. Teams with suboptimal experimentation workflows ultimately won’t be able to leverage interleaving effectively.
Overall, we’re excited to have built a platform that supports interleaving and makes the configuration and analyses of these setups easy to perform.
Acknowledgements
Thank you to Jay Zhang from the Homepage team and Muxi Xu from New Verticals team for partnering with us in configuring and testing interleaving setups. Thank you to Janice Hou for helping us define event sources used in metric computation. Thanks also to Yixin Tang and Qiyun Pan for their help extending the delta method to support paired t-tests and to Jun Jin and Qilin Qi for pushing for interleaving work to be prioritized. Thank you also to Sagar Akella for valuable feedback on this blogpost.
DoorDash’s legal function supports all components of the company, enabling our teams to achieve their objectives in a way that best protects the company, now and in the future.
Join us at our upcoming event on September 10th, where you’ll hear directly from five legal leaders across our organization who will share their career trajectories, and how we attract, develop, and retain our legal talent. As part of a hyper-growth tech company, we’re always looking for talented individuals who are excited to learn, build, and grow beyond what they thought was possible, and this is the perfect forum to learn about opportunities in our legal organization at DoorDash.
Attendees at our upcoming legal event will hear from:
Ryan Black – Ryan is a member of DoorDash’s Legal Leadership Team and the department’s current Chief of Staff. In his role, Ryan oversees a Legal Operations team of 10 and acts as a trusted advisor to the Company’s General Counsel, building relationships between the law department and business teams, and harnessing the team’s legal talent to empower and advance the company’s strategic vision. As an early pioneer of the legal operations movement, Ryan founded the function at other technology companies, including Instacart and Opendoor. Ryan is a frequently featured industry speaker on topics ranging from budgeting and forecasting, to overcoming imposter syndrome, to building a world-class legal operations function. In his spare time, Ryan enjoys traveling, learning Spanish, and looking after his two cats.
Dawn Croft – Dawn has spent more than a decade as in-house counsel for various global retail and tech companies. She is Senior Counsel for New Verticals at DoorDash, where she leads the regulated products team. Before DoorDash, Dawn served in various in-house counsel leadership roles for Amazon, KFC US and Yum! Brands. Early in her legal career, Dawn practiced corporate law at Frost Brown Todd law firm in Louisville, KY. She attended Yale University as an undergrad and received her J.D. from the University of Kentucky. Dawn has served on numerous non-profit boards and is a current Board Member of Open Arms Perinatal Services, a local Seattle organization that provides community-based perinatal support. Dawn lives in Seattle with her husband and their young daughter who runs circles around them when it comes to negotiation skills.
Alicia Pierce – Alicia is the Legal Operations Manager, eDiscovery at DoorDash. Alicia leads the eDiscovery function at DoorDash and is responsible for all aspects of eDiscovery from implementing eDiscovery tools and strategies, providing guidance on eDiscovery best practices, and troubleshooting data challenges. She also works closely with the Litigation, Privacy, and IT teams to ensure compliance with data retention and discovery requirements. Prior to joining DoorDash in April 2024, she handled eDiscovery at Cruise, Amazon, Zillow and in various law firms.
Patty Robbins – Patty is a Senior Director on the DoorDash Legal Team. She leads the New Verticals & Regulatory team, which guides the business on Product and Regulatory issues related to new business lines including Grocery, Convenience, Retail, DashMart, Alcohol, and CBD. Prior to joining DoorDash 4 years ago, she was a Senior Counsel at Uber for 5 years, advising on regulatory issues for the rideshare, autonomous vehicle, and bike/scooter product lines. She began her career as telecommunications regulatory attorney at Latham & Watkins and at the Federal Communications Commission.
Andrew Wilhelm – Andrew joined DoorDash in 2022 as Senior Litigation Counsel, where he focuses on Dasher-related issues, government investigations, and patent litigation. Prior to joining DoorDash, Andrew spent five years at Gibson Dunn, where DoorDash became his primary client. He also clerked at the trial and appellate levels. Throughout his career, Andrew has been heavily involved in diversity initiatives, including DoorDash’s Legal for Diversity group. He lives in Washington, D.C. with his husband (Andy) and Cavalier King Charles Spaniel (Waffles).
Join us on Tuesday, September 10 from 1:00pm – 2:00pm PST to hear from these panelists and learn how you can accelerate your career at DoorDash. Register here today!
DoorDash is supporting an increasingly diverse array of infrastructure use cases as the company matures. To maintain our development velocity and meet growing demands, we are transitioning toward making our stateful storage offerings more self-serve. This journey began with Kafka, one of our most critical and widely used infrastructure components.
Kafka is a distributed event streaming platform that DoorDash uses to handle billions of real-time events. Our engineers — the primary users of this platform — manage Kafka-related resources such as topics, users, and access control lists, or ACLs, through Terraform. However, managing these resources manually was cumbersome and created a significant support burden for our infrastructure engineers because of the need to review and approve multiple pull requests.
To address this, we developed Kafka Self-Serve, our flagship self-serve storage infrastructure platform. Kafka Self-Serve empowers product engineers to onboard and manage their Kafka resources with minimal interaction from infrastructure engineers. This system was built in response to feedback from our product engineers and a careful examination of the support burden on our infrastructure team.
Here we share our Kafka Self-Serve platform development journey, the challenges we faced along the way, and the solutions we implemented. We hope to provide valuable insights that can help the broader tech community embark on similar journeys toward self-serve infrastructure.
The pain points
Before we implemented the Kafka Self-Serve platform, we faced several significant challenges in managing Kafka resources effectively. These pain points affected both our customers — product engineers — and our infrastructure engineers:
Customer pain points
Confusion with Terraform’s manual onboarding: Terraform, our primary method for onboarding and managing Kafka resources, was cumbersome and confusing for our customers, requiring them to create topics and configure properties manually. This often led to errors and inefficiencies.
Difficulty debugging misconfigurations: When customers misconfigured their Kafka topics, it was challenging for them to debug the issues. They frequently needed to seek help from infrastructure engineers, which caused delays and added to the engineers’ workload.
Complicated and unclear documentation: Our documentation, which lacked definitive best practices guidelines, was often complex and unclear.This made it difficult for customers to understand and follow the correct procedures for managing Kafka resources.
Need for abstracted configurations: Many Kafka topic configurations could be abstracted or set to recommended default values. But customers had to manually configure these settings, increasing the likelihood of errors and misconfigurations.
Difficulty viewing topics: Kafka topics were buried in directories within our Terraform GitHub repository, making it difficult for customers to view their topics, further complicating the management process.
Insecure and inconvenient user password retrieval: When customers created Kafka users, they needed to ask infrastructure engineers for the passwords. Passwords were sent via direct message on Slack, which was not only inconvenient and time-consuming but also posed a security risk.
Infrastructure engineer pain points
High support noise: Our manual and error-prone processes led to frequent support requests from product engineers, creating a significant burden for infrastructure engineers. This constant noise diverted their attention from more strategic tasks.
Limited control over traffic enforcement: Without a centralized automated platform, it was challenging to enforce traffic policies and ensure consistent configurations across different teams. This lack of control could lead to inconsistent practices and potential performance issues.
Scalability challenges: As the number of teams and use cases grew, managing Kafka clusters manually did not scale well. The infrastructure team struggled to keep up with the increasing demand, leading to delays and potential bottlenecks.
Reliability guarantees for shared Kafka: Significant manual effort was required to ensure reliability for shared Kafka clusters. There were no built-in mechanisms to guarantee reliability, increasing the risk of downtime and data loss.
Ownership and delegation: Effective management of both shared and dedicated Kafka clusters required clear ownership and the ability to delegate responsibilities. Infrastructure engineers needed a way to take ownership of shared Kafka clusters while delegating management responsibilities for dedicated clusters to power users.
Our Kafka Self-Serve platform was designed to address each of these pain points to not only empower product engineers but also to support and streamline the work of infrastructure engineers, leading to a more efficient and scalable system.
Design and implementation
As we delve into the details of our design and implementation processes, note that some decisions described here are tailored specifically for DoorDash Engineering. Nonetheless, the underlying principles and thought processes are broadly applicable to any organization looking to streamline their Kafka resource management.
Level of abstractions
It’s a common misconception that making infrastructure self-serve is simply about building a UI to allow people to create infrastructure. While that is the eventual outcome on the surface, the true goal goes deeper. To solve the pain points outlined above, the focus should be on establishing the proper level of abstractions. Our approach involved:
Hiding complex configurations: We strove to hide many of the intricate configuration options for Kafka topics, exposing only the essential settings related to topic capacity. This simplification helped users avoid common pitfalls and misconfigurations.
Enforcing best practices by default: By abstracting complex configurations, we inherently enforced best practices. This ensured that users followed the optimal configurations without needing to understand the underlying details. On this paved path, it should be hard to make mistakes.
High-level design
Figure 1: Storage self-serve high-level design
Figure 1 provides a high-level overview of Kafka Self-Serve’s architecture:
User interaction through DevConsole: Both product and infrastructure engineers interact with the platform via the DevConsole — an internal portal for developers based on Spotify Backstage — specifically through the storage self-serve plugin. This plugin serves as the user interface, providing an accessible and intuitive way for engineers to manage their Kafka, Redis, CRDB, and other infrastructure resources.
Storage self-serve service: At the core of our platform is the storage self-serve service, which orchestrates the entire workflow. This service has two main components:
Resource management: This component handles all API requests related to resource creation, updates, and lookups. It ensures that all resource management tasks are executed efficiently and reliably.
Other API endpoints: These endpoints are dedicated to monitoring and admin operations, providing visibility and control over the managed resources.
Infra service: The infra service is responsible for the actual execution of resource management tasks. It leverages Argo Workflows to execute Pulumi programs to provision and manage infrastructure resources. Underneath infra service, we have our own Kafka Pulumi plugin which utilizes the official Kafka provider. We will delve into more detail in the next section.
This high-level design ensures that our Kafka Self-Serve platform is both scalable and user-friendly, enabling engineers to manage their resources efficiently without requiring deep knowledge of the underlying infrastructure.
Infra service: Generic API over infra-as-code
While infrastructure-as-code, or IaC, tools like Pulumi are powerful, we realized that alone they were not sufficient for building a truly self-serve Kafka management platform. We needed something that provided a higher level of abstraction over IaC, allowing us to create a more user-friendly and efficient solution. To achieve this, we developed infra service to manage the resources life cycle as shown in Figure 2 below.
Figure 2: Infra service high-level design
The goal was to create a generic framework that allows infrastructure engineers to build plugins for different types of resources, enabling self-serve experiences tailored to the needs of product engineers.
Besides Kafka, we already have plugins for managing AWS S3 buckets, AWS ElastiCache clusters, and CockroachDB users. Infra service exposes a CRUD API (create/read/update/delete) that can be invoked for any registered plugin type, making it a versatile and powerful tool for our infrastructure needs.
We will delve deeper into infra service and its architecture in a dedicated blog post soon, so stay tuned for more details.
Permissioning and auto-approvals
At DoorDash, we use SASL/SCRAM (salted challenge response authentication/simple authentication and security layer) authentication alongside ACLs to control which services — including producers and consumer groups — can access each Kafka topic. The high-level flow for onboarding and using Kafka involves the following steps:
Request a Kafka topic: Developers request the creation of a new Kafka topic.
Request a Kafka user: If the service does not already have a Kafka user, a request is made to create one.
Request access level: Developers request the necessary access levels (read, write, describe) for their Kafka users.
Each of these requests traditionally required review and approval from the infrastructure team. This process was time-consuming and heavily manual, creating bottlenecks and delaying project timelines.
To streamline the approval process, we implemented auto-approval designs for specific Kafka resource changes. This automation is crucial because it reduces the dependency on manual reviews, allowing for quicker provisioning and enabling developers to move faster. By setting predefined criteria for auto-approvals — for example, creating new users is considered safe and auto-approved — we ensured that routine and low-risk requests could be processed automatically, while still maintaining control and oversight for more critical changes.
Migrations
It’s not easy to migrate from Terraform-backed Kafka resources to Pulumi-backed Kafka resources. We developed a series of scripts to bulk import and streamline the process. The specific migration process depends on design and which providers are used. Specifically, we use the official Pulumi Kafka provider and we migrate from the popular mongey/terraform-provider-kafka. It’s worth noting that the official Pulumi Kafka provider uses the same Terraform provider underneath. We encountered two interesting challenges:
User import complications
Problem
When migrating Kafka users, we faced several significant challenges, including:
Terraform lacks import support: The underlying Terraform module does not support importing Kafka users. This limitation meant that the usual import process could not be applied to SCRAM users, causing significant delays and difficulties.
Password retrieval issues: We no longer had access to the actual passwords for existing users because Kafka does not store them for SALT challenge authentication. For newer users created by more recent versions of Terraform, the passwords were stored securely, but we needed to handle older users differently.
Solution
To work around these issues, we implemented the following steps:
Simulated import by creating new users in Pulumi: We approached the import process by creating new users in Pulumi to effectively override the users on Kafka with the same password. This method, however, introduced the risk of overwriting existing passwords.
Additional validation: To mitigate the risk of password overwrites, we added validation steps using kafka-cli to ensure that the passwords were valid and consistent.
Password retrieval from secure sources: We loaded passwords from secure storage solutions like 1Password and AWS Secrets Manager. In cases where passwords were not found, we reached out to individual teams for assistance.
Topic config complications
Problem
When migrating Kafka topics from Terraform to Pulumi, we faced the significant challenge of ensuring that the topic configurations matched exactly. Here are the specific problems we faced and the solutions we implemented:
Exact config mapping requirement: When creating a topic through Terraform, a configuration mapping can be specified to set additional properties such as retention.bytes, min.insync.replicas, and more. When importing these topics into Pulumi, configurations must match the Terraform provider’s values exactly. This added difficulty to the task because each version of the Terraform provider had different default values. It was not possible to generalize the default values to match. It required time to seek default config values for each possible version. If these values did not match exactly, Pulumi failed the import.
Configuration discrepancies: It was impractical and error-prone to manually ensure that every configuration setting was consistent between Terraform and Pulumi. Even minor mismatches could cause significant problems in a production environment.
Solution
To address these challenges, we developed a series of auditing scripts to automate verification and correction of topic configurations, including:
Auditing scripts: These scripts load the configuration details from the Terraform state and compare them with the desired Pulumi configuration. This allowed us to identify discrepancies between the two configurations.
Automated matching: The scripts automatically adjusted the Pulumi configurations to match the existing Terraform settings exactly. The script pulled the default value for the provider, but if a config value was used that differed from the default, that value was used instead. This ensured that all topics were configured correctly during the migration process, eliminating the risk of errors caused by manual configuration.
Consistency checks: After the initial matching process, we implemented additional consistency checks to verify that the configurations remained aligned during the transition. These checks provided an extra layer of assurance that the migration was successful and that all topics were configured as expected.
Impact
The transition to a fully self-serve model for Kafka resource management has brought significant benefits to our customers and the engineering team. Let’s delve into some of the key wins we’ve achieved through this initiative.
Customer accolades
Before looking at the improvements and wins in a more quantitative manner, let’s hear a few words from our customers:
“In the past, when we wanted to add a new Kafka topic, we had to first understand the existing configuration by reading code from multiple code repositories before commiting code changes, posting the pull request to a Slack channel, and finding the right person to ask for approvals. It could take several hours because of the multiple-step operations. Now we can simply fill in a form in the UI and click the submission button, then everything is done in just a few minutes!”
-Dax Li at Store Platform
“With Storage Self-Serve Kafka, it’s now all in one place. I can point a new developer to the Dev Console Kafka Self-Serve Storage UI to begin creating a Kafka topic immediately and to see several great pointers regarding standard Kafka usage and visibility. I’m also a happy customer; I was able to create 20 production Kafka topics in less than half a day.”
–Robert Lee at Performance Platform
“The new self-service portal makes it so much easier to configure Kafka topics. Less time spent on remembering exactly which TF file the topic data was stored in (each cluster had a different pattern based on when the cluster was made) and more time spent building features leveraging Kafka.”
-Patrick Rogers at Observability
Velocity improvements
Kafka resource creation and management is now fully self-serve, with 23,335 resources onboarded.
Various UI improvements have led to an 80% reduction in average loading time.
The average Kafka resource creation timehas been reduced 99%, from 12 hours to under five minutes.
Reliability improvements
Validations are built into the tool to enforce best practices at creation time.
The storage team can now enforce Kafka topic disk usage to properly size our Kafka clusters, preventing us from ever running out of disk space on a Kafka cluster — which is disastrous and hard to recover.
Admin options can now be handled efficiently by Infra engineers to quickly mitigate incidents.
Insights
Building out our Kafka Self-Serve system has been a transformative journey, filled with valuable lessons and insights. In this section, we want to share some of the key things we learned through this process.
Talk to your customers
As infrastructure engineers, it’s easy for us to build infra abstractions without fully understanding what product engineers actually care about. To ensure that our Kafka Self-Serve system truly met the needs of our users, we prioritized open and continuous communication with our customers, the product engineers.
Here are some specific steps we took:
Regular feedback sessions: These were conducted with product engineers to gather their input on the current system and understand their pain points. These sessions were crucial in identifying the specific features and functionalities that would have the biggest impact on their workflow.
User-centric design: By focusing on the end-user experience, we ensured that the platform was intuitive and easy to use. We designed the system with the product engineers in mind, emphasizing simplicity and usability.
Iterative development: We adopted an iterative development approach, releasing incremental updates and features based on user feedback. This allowed us to address any issues quickly while continuously improving the platform.
Cross-functional collaboration: We worked closely with cross-functional teams, including product management and UX design, to ensure that our technical solutions aligned with the overall product strategy and user needs.
Surveys and user testing: In addition to feedback sessions, we used surveys and user testing to validate our assumptions and gather quantitative data on user satisfaction and usability. This data-driven approach helped us to make informed decisions and prioritize development efforts.
By actively engaging with our customers, we were able to build a Kafka Self-Serve system that not only solved the technical challenges but also provided real value to product engineers. This customer-centric approach was key to the project’s success.
Infrastructure engineers as first-class citizens
On the flip side, it’s easy to ignore the needs of infrastructure engineers and concentrate on shipping a platform that is focused purely on doing things faster. However, it’s equally, if not more, important to ensure that the self-serve infrastructure platform — in this case Kafka — serves infrastructure engineers as well.
Here’s how we approached this:
Enforcing best practices by default: We made sure that the platform enforced best practices automatically. This not only helped maintain consistency across all Kafka resources but also ensured that developers could follow the recommended configurations without needing to know the intricate details.
Reducing review time: One of our key goals was to reduce the amount of time needed to review requests. By implementing auto-approvals for low-risk changes and building robust validation checks, we minimized manual intervention by infrastructure engineers. This allowed them to focus on more critical tasks while still maintaining control over the infrastructure.
Building complementary automations for maintenance: These automations for maintenance tasks were built in from day one. This included automated monitoring, alerting, and remediation processes to help keep the Kafka infrastructure healthy without constant manual oversight. We are also building out our infra control plane to automate all our operations and maintenance tasks. These automations significantly reduce the operational burden on infrastructure engineers.
By considering the needs of infrastructure engineers and making them first-class citizens in our design, we created a self-serve platform that not only empowered product engineers but also supported and streamlined the infrastructure team’s work. This holistic approach was crucial for the sustainable success and scalability of Kafka Self-Serve.
Service level resources vs. resource level
Often, an infrastructure resource — such as a Kafka topic — is tied to a service. This relationship can affec how you choose to manage and organize these resources. To accommodate different use cases and preferences, we built support for both service-level and resource-level management.
Service-level management: This approach allows for managing all Kafka resources tied to a particular service as a single unit. It’s beneficial for scenarios where changes need to be applied consistently across all resources associated with a service. This method simplifies the management process for teams that prefer to handle their infrastructure at a higher level of abstraction.
Resource-level management: This approach provides more granular control, enabling developers to manage individual Kafka topics, consumer groups, and specific configurations. This flexibility is crucial for fine-tuning and optimizing specific resources without impacting the broader service. It allows teams to make precise adjustments and optimizations based on the unique needs of each resource.
By supporting both service-level and resource-level management, we ensured that our Kafka Self-Serve platform could cater to the diverse needs of our engineering teams. This dual approach provided the flexibility needed to manage resources effectively, whether at a high level or with fine-grained detail.
Next steps
As we continue to improve the Kafka Self-Serve platform and expand our other self-serve infrastructure offerings, we have several key initiatives planned, including:
Specific to Kafka
Expand on auto-decision: We plan to enhance our auto-decision mechanisms to cover a broader range of Kafka resource changes. This will further reduce the need for manual reviews, allowing engineers to move even faster while maintaining a high level of security and compliance.
Expand on credential automation: Automating the management of Kafka credentials is a top priority. We aim to develop more sophisticated tools for generating, distributing, and rotating credentials automatically, ensuring secure and seamless access to Kafka resources without manual intervention.
Broader initiatives
Expand storage self-serve: Beyond Kafka, we are focused on extending our self-serve capabilities to other storage systems. This includes enhancing our current offerings for AWS S3 buckets, AWS ElastiCache clusters, and CockroachDB users, as well as integrating new storage solutions based on emerging needs.
Expand storage self-serve control plane: We are building out our infra control plane to automate all our operations and maintenance tasks. This will include advanced monitoring, alerting, and self-healing capabilities to ensure our storage infrastructure remains robust and resilient. By automating these processes, we can further reduce the operational burden on our infrastructure engineers and improve overall system reliability.
Expand on disk and throughput quota: To better manage resource allocation and ensure fair usage, we will expand our capabilities to set and enforce disk and throughput quotas for Kafka topics and consumer groups. This will help prevent resource contention and ensure that all teams have the necessary capacity to operate efficiently.
Afshin Dehghani was looking for a change of pace when he stumbled upon an opportunity at DoorDash. It was 2021, and he’d spent a few years in the banking and financial services industry when he wanted to join a company that moved fast, was growing even faster, and where he could work a bit more closely to the customer.
“So I joined DoorDash as a full stack engineer and I right away jumped on some large projects,” Afshin says. “This is a place that encourages me to build. We’re constantly thinking about how we can do better, deliver better value to our customers, and opportunities to be innovative.”
Since joining DoorDash, Afshin has grown his career into becoming an engineering manager on the Ads Engineering team, where he’s experienced a healthy blend of building things that didn’t exist before, while also continuing to incrementally improve on what’s been developed over the last 10 years.
“I’ve seen all sorts of engineers navigate their careers at DoorDash. And the beautiful thing about this company is that no one is blocking your growth,” Afshin continues. “If you’re looking for more opportunities, you want to work harder, you want to solve more problems, raise your hand. We move fast and the work is not easy. Your experience here is defined by how you leverage your time and skills.”
Along with his role as an engineering manager, Afshin is a heavy proponent of the WeDash program, last year completing the most dashes in the company and earning company-wide recognition during an All Hands meeting with our DoorDash CEO and Co-Founder Tony Xu.
“You can’t solve some of these problems unless you experience them, and I think a program like WeDash helps people who are building for all these legs in the marketplace,” Afshin says. “From my perspective, it’s just the mission and the vision of the company, right? If you are connecting the empowering communities, we are creating a better kind of life for our customers, for our dashers, and for our merchants. I really wanted to be connected to that. And I want to see how we are doing it on the ground and actually being connected with people.”
Afshin spent 2022 dashing in San Francisco, New York, Northern Virginia, Washington, D.C. and when he traveled. He experienced big-city dashing to high rises and condominiums, delivering orders in the suburbs, and developed a greater appreciation for the job of merchants and dashers within the business.
“The whole dashing aspect of the marketplace is a key component of the business,” Afshin says. “If you look at it from a pure business perspective, this is very important for us to test, understand what’s working, and evaluate it to make it better. I think from the one percent better every day value, this is the kind of responsibility every single person in the company can contribute to. I strongly believe that it made a huge difference in my life doing the dashes. Being able to connect to people and understand and see their perspective.”
Afshin says since his recognition, where he shared the importance of dashing, he’s discussed dashing with other colleagues and continued to lead by example with his investment in the WeDash program.