Skip to content

At DoorDash, we foster a culture of innovation, tackling new challenges across our business to quickly build, test, and learn. This outlook underpins everything we do, including how we reimagined our New York office space to fit the needs of the teams who help our culture flourish.

Built from feedback around what local employees told us mattered most to them, we landed on our new 57,691-square-foot space right in the heart of the Flatiron district. At three times the size of our previous office, this space has key features that incorporate our flexible workplace design principles, emphasizing the variety of work points and space types to support any number of work activities.

With plenty of natural sunlight, an outdoor rooftop terrace, and the stunning views of Madison Square Park, the space balances the diverse array of our team’s needs, featuring everything from reservable private spaces designed for focused work to open gathering spaces big enough for team onsites.   

The open floor plan caters to the collaborative in-person experiences we plan to build in our New York office space, which features a cafe and large capacity all hands event space, sit/stand workstations, and a designated training space. This flexible space also includes plenty of room for confidential work, with phone booths, meeting rooms, and dedicated Do Not Disturb focus areas.

“One of the things that makes New York special is its diversity of backgrounds, industries, and local businesses. Our New York office reflects this diversity; we have teammates from every team and function at DoorDash represented. We are excited to open a collaborative space of our own, deepen DoorDash’s roots in the city, and further enable our teammates to do our very best work for merchants, Dashers, and our community.” 
Katie Egan, Chief of Staff at DoorDash (New York, NY) 

At DoorDash, we believe great work can be done anywhere. Rather than requiring employees to work in an office for a set number of days, we recognize that elements of both in-person and remote work will differ depending on how distributed each team is, and the nature of each team’s work. This space is well-designed to fulfill the needs of our Flexible Workplace Model, which gives our people the ability to decide how they want to leverage remote work and time spent together in-person, solving complex problems, learning within a community, and celebrating wins together.

With the reimagined New York office space, we look forward to introducing compelling and collaborative in-person experiences that meet the various needs of our teams.

Click here to learn more about our Flexible Workplace Model and what it’s like to work at DoorDash.

As part of our efforts to create a workplace that engages people of all backgrounds while fostering an environment of diversity, equity, and inclusion, our Employee Resource Groups (ERGs) play a vital role in building and driving the culture that our people experience.

Today, we’re thrilled to announce the formation of the Able@ DoorDash ERG, joining AAPI (Asian, Asian American, Pacific Islander), Black, Indigenous, Parents, Pride, Unidos, Veterans, and Women as our ninth official Employee Resource Group.

With the newly-formed Able@ Employee Resource Group, we’re creating a globally inclusive support network that celebrates physical and neurological diversity. This dedicated space will open opportunities for judgment-free questions, knowledge sharing, and the development of resources that support and advocate our physically and neurologically different employees.

Together, our Able@ ERG will collaborate to keep inclusivity of all abilities top of mind in DoorDash’s workplaces and products, challenging common stigmas related to differences in physical ability, appearance, size, personality, cognition, intellect, executive function, and more.

Historically, DoorDash has been proud to support this community through inclusive hiring practices, manager training, accommodations requests, and access to food. Systemic change takes thought, effort, and dedication. At DoorDash, we believe in our people and will continually look for ways that we can empower and support them.

Our efforts to create a workplace where everyone feels welcomed, supported, and valued is one of the reasons we were recently recognized as one of America’s Greatest Workplaces 2023 by Newsweek. To learn more about this award and how we’ve driven the culture our employees experience over the last year, click here.

DoorDash offers our summer interns the opportunity to fully integrate with Engineering teams to get the kind of real industry experience that is not taught in the classroom. This is the third blog post in a series of articles showcasing our 2022 summer intern projects. If you missed the first or second article the links are here and here. You can read about each project below.

Contents: 

Enabling DoorDash’s Financial Data to be Queryable by Storing Data in Parquet Files

By Rini Vasan

As DoorDash’s business grows exponentially we need to accurately record the changes that affect financials, but the challenge is that these changes are distributed throughout different domains and across various flows. For example, an order submission will touch a customer, a Dasher (our name for delivery drivers), a merchant, a pay-in, and a payout. Today these changes are entered as single entry systems that are prone to errors and difficult to reconcile. There are various challenges with respect to data mutability, long intervals between changes, and data fixes. The Revenue Platform (RP) team is attempting to mitigate these issues by providing mechanisms for recording financial transactions in a compliant and auditable way that is amenable to accounting and reporting.

There are multiple microservices (Aggregator, Reprocessor, Archiver, Workflow) for the revenue platform that work in tandem to achieve our goal, but this post will focus on the work of the Archiver service. The primary purpose of Archiver is to pick up events containing financial transaction data sent by different upstream teams and store this data in a data lake. This data is currently persisted for audit and to be used in case of correcting any accounting data.

Problems with the data stored in Archiver currently

Currently, in order to query and read the raw events, we use an application called Reprocessor, which picks up the event data stored by Archiver and sends them for reprocessing by the platform. Archiver is a flink application that listens to multiple different events on kafka topics. The event data is stored in AWS S3 in an encoded format in JSON files. After the workflow processes the data, we can query events from the cockroachDB database, which is used by DoorDash as a database solution, and the Snowflake data warehouse to see the final results of processing. After reprocessing, we are able to decode and read the event data stored by archiver for reprocessing. 

However, when using a web based notebook for data analytics to parse the JSON files, the data is not decodable, meaning that the data cannot be queried. This non-decodable data makes it much harder for us to understand the data stored by the archiver. By only being able to read event data after workflow processing, other teams that use this data will need to wait for the Revenue Platform team to onboard events to the workflow as well as wait for it to show up on the cockroachDB database. This process causes delays when teams are building new or changed events because there is no easy way to verify the data in the new or updated events, which significantly slows down new feature launches and experimentation.

Making the data stored in Archiver queryable

Currently, Archiver stores the data with a lot of custom code that follows a specific lifecycle. First, the event is ingested and the data is read and aggregated into different attributes such as the ingestion time as well as other specifics about the Event itself. All of this data and the raw event data itself is encoded and stored in a class object. Next, the data is read and pushed into AWS S3 through S3’s APIs. 

With the new changes to the archiver, instead of storing the data in an encoded JSON format, we stored the event data in parquet format with a defined schema per event type. The reason we chose to use parquet format instead of JSON is because parquet format is natively queryable by many different analytics tools like a web based Apache Spark notebooks with analytical functionality without any need for decoding. However, if we continued to use JSON then we would not be able to directly read or query without going through the entire lifecycle described above, which takes a lot of time. 

In order to implement the changes described above, we read the event data that is coming in directly and aggregated it into a similar class object as described in the lifecycle above. We then used a connector from Flink called Streaming File Sink to convert the data into parquet format and push this data directly to S3 without needing any custom built code for the full lifecycle. Streaming File Sink takes in the output path which would be the S3 path to store the data and a parquet writer object. In S3, we stored the parquet files per event in a per hour folder. 

With these new changes described above, specific details of an event can be written in parquet format, which is natively queryable through Spark notebooks without a need for decoding or using any Revenue Platform specific libraries. After event data is pushed to production, we can allow other teams to query the data directly with no wait time for the workflow application to process it.

Impact of the upgraded archiver 

Now that we are able to query the data stored by the archiver, it helps engineers in alerting, monitoring, and debugging any issues that might arise from other applications involved in the complete lifecycle of the revenue platform. This leads to reducing developer overhead and development hours for many issues. We are now saving two days of developer efforts when getting details about new events from upstream. Previously, these two days would have been used to onboard the new events onto all revenue platform services. However, now we can just instantly verify the events and the wait is no longer required. Also, we are now able to open up the Spark notebooks query to other teams. Therefore, the impact of the upgraded archiver now allows other teams, even non-engineering teams such as the Accounting or Audit teams, to query the events and verify all changes themselves, which significantly increases the velocity of new feature launches.

Accelerating Developer Productivity by Building a Delivery Debugger

By Peyton Chen 

One of the largest challenges of the logistics platform team is that we are the owner of numerous critical services with downstream dependencies relying on these services as sources of truth, especially those surrounding delivery information and delivery-to-Dasher assignment information. When deliveries do unfortunately go wrong, pulling information from these sources of truth is typically the first step of identifying root causes. However, outside of manual database queries across multiple distinct data sources, there is currently a lack of resources in debugging production issues – a pain point during outages. Here, we will describe how we built a new internal tool as part of our goal for operational excellence and quality.

Problems with current methods of gathering data for debugging

There are a few key reasons motivating the creation of this tool: 

  • We rely on our legacy codebase, that we are actively transitioning away from, to run database queries. 
  • Customer support tooling can be helpful and provide some information, but often abstracts from the core sources of truth and is not engineer-oriented.
  • Running queries on our data warehouse is a possibility, however, this is not realtime.
  • Production databases are sensitive and do not allow for joins, requiring workarounds as critical information is spread out among many different tables
  • Manual queries are slow and require a lot of experience
  • There are often simple data-gathering requests from other engineers to our team which takes time for us to respond, meaning greater mean time to resolution, and consumes unnecessary engineering resources.

Building the debugger

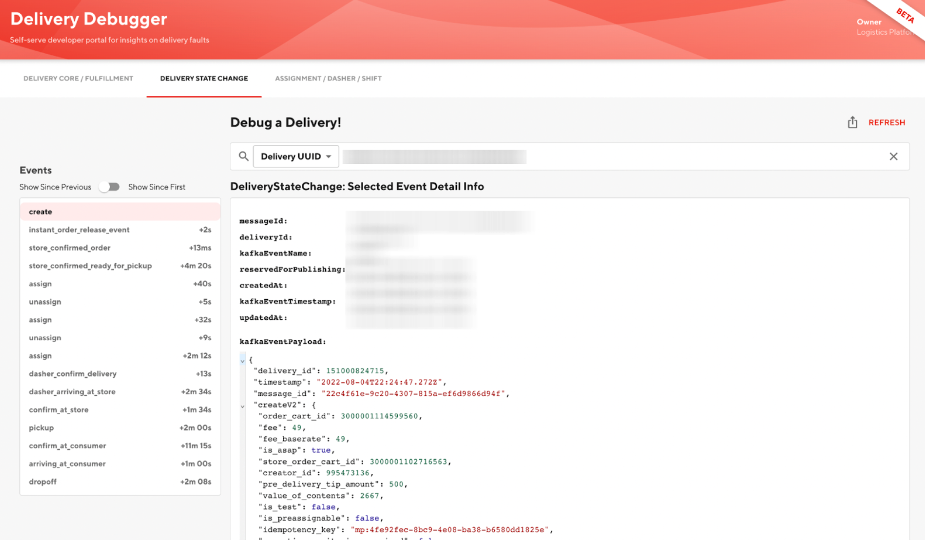
Our new debugger is a self-serve platform and insights dashboard for providing a cogent aggregation of data and highlighting data inconsistencies aiming to address all of the above concerns. It is hosted as a plugin on a DoorDash-adapted internal tooling website based off of Backstage by Spotify. The current version of the debugger displays logical groupings with like fields together offering a view into how a delivery is represented in the database as shown in Figure 1. The biggest feature is offering a display of each mutation on the delivery object as it travels from being created all the way through to being delivered or another terminal state as shown in Figure 2. The data is supplied from a gRPC endpoint that we created reading from a database that mirrors every time a kafka event is sent from the kafka topic that tracks all events a delivery encounters. Assignment history is offered as well with the associated Dasher information, shift information, and shift route as shown in Figure 3.

Figure #1: Logical groupings of data in the database along with convenient links to other tools and filters are provided.
Figure #2: For each event in a delivery, a detailed view is provided indicating which fields in the delivery database have changed as part of this event.
Figure #3: For each delivery, a detailed view is provided for each assignment that a delivery takes on, as well as the Dasher and shift associated with the assignment.

In addition to providing convenient views, we have plans to develop a robust set of constraints and a display for instances of constraint violations, indicating potential bugs in representing a delivery. We also intend to have a dashboard that suggests deliveries to look at – such as those that fail the aforementioned constraint rules or the top 100 late orders in the last 30 days, to name two examples. 

Impact

We are already seeing adoption of the tool, with developer productivity improvement estimated to be in the 5-10% region when troubleshooting. Ultimately, the biggest result we have begun to achieve is setting an example for other teams on the importance and value of internal tooling that can help developers identify patterns quickly and autonomously with problematic deliveries. Multiple teams have already expressed commitment for continuing to integrate their services with the delivery debugger or create similar tools. We anticipate to have paved the way for better tools to debug production issues, allowing us to continue to grow and be the world’s best last-mile logistics provider.

Stay Informed with Weekly Updates

Subscribe to our Engineering blog to get regular updates on all the coolest projects our team is working on

Optimizing Push Notification Prompt Initiatives

By William Louis 

DoorDash has many promotions, offers, and other deals that we offer our pool of consumers. We advertise to engage our users as much as possible on our platform. One method of notifying them of these benefits is through emails. However, users are more likely to check their application notifications and learn more from there. Prompting users to turn on their notifications allows us to reach out to them regarding these benefits more easily. 

Problem with our unsubscribed user group

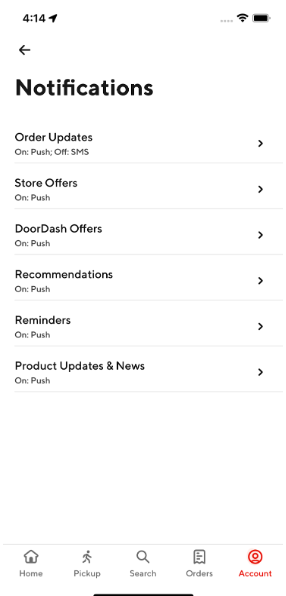
The notifications team under the DoorDash growth organization conducted analysis and found that millions of users had an invalid or null notification subscription status. The team was able to re-subscribe 88% of these unsubscribed users to mobile application push notifications, leaving a large number of users unsubscribed (the remaining 12%). We want as many users as possible to be subscribed since unsubscribed users do not receive the marketing pushes that would keep them engaged on our platform and with our services. Within the mobile application, there exists a notification preference center (see Figure 1) that can help these users subscribe, unsubscribe, and re-subscribe to DoorDash notifications. However, this feature requires more manual work on the user’s part and as being customer-obsessed is one of our core principles, we want to make the subscription process as automated as possible.

Figure 1: The notifications preference center that exists within the account page.

The push prompt initiative

The notifications team wanted to create a strategy that allowed users to easily subscribe to DoorDash notifications. We wanted users to have an automated method of getting notified of all the benefits that we offered to them in order for them to be engaged on our platform. This strategy involved advocating the benefit of the subscription while providing easy access to these subscription workflows in a single click which was more convenient than using the app’s notifications center. 

Figure 2: The push prompt banners on the Offers Hub and Orders pages

The push prompt initiative involved adding push prompt artifacts across key parts of the user journey. These key parts included the orders and the offers hub pages, and banners were added to these pages on the iOS app (see Figure 2). These two pages have a huge amount of daily impressions, so we decided that it would be a good approach to place these banners here to reach out to the millions of users who had not subscribed to notifications.

How we built push prompt features

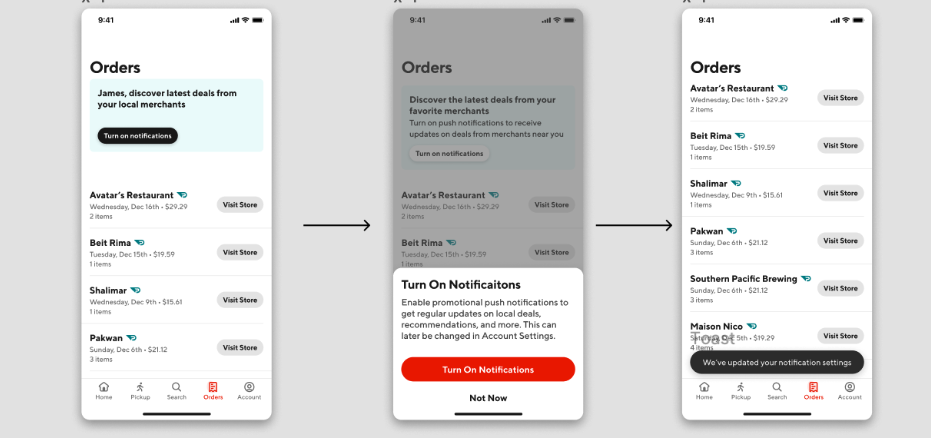
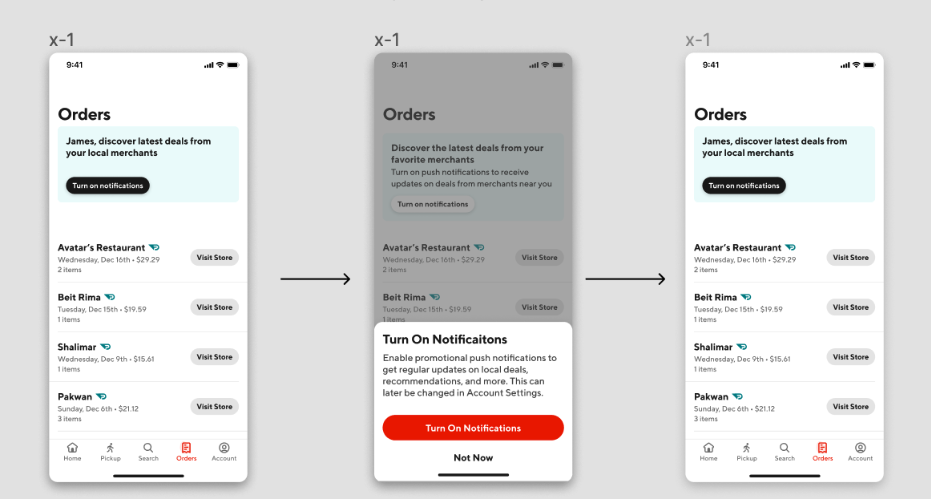
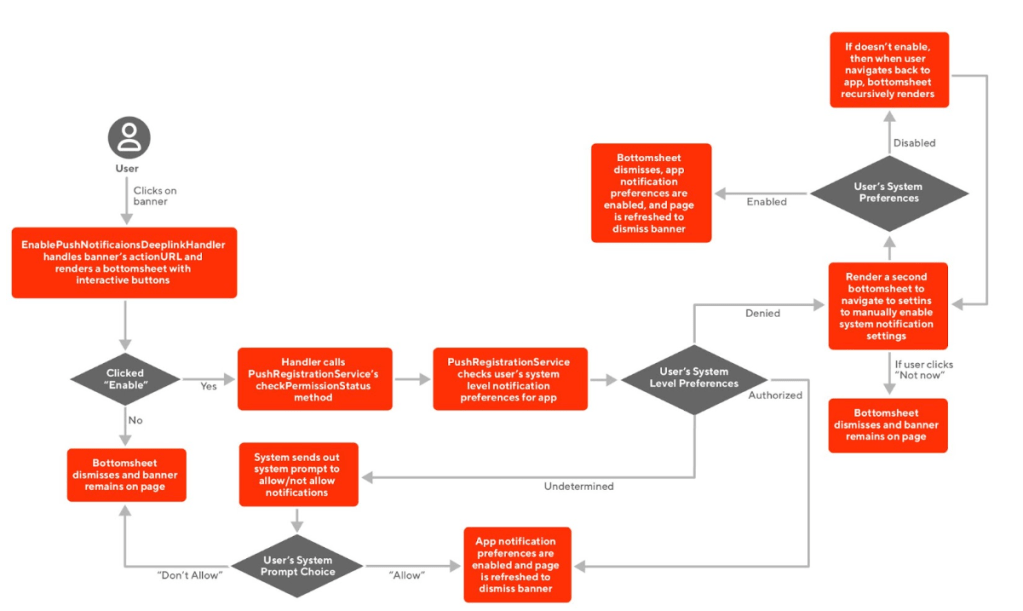
Upon the click of the banner, the workflow will trigger a bottomsheet to render (see Figure 3 and 4). In the bottomsheet, there are button prompts to either subscribe or dismiss the sheet. There are multiple workflows that can be executed through this bottomsheet.

Figure 3: This flow involves the user subscribing to notifications.
Figure 4: This flow involves the user unsubscribing to notifications.

How we implemented the push prompt feature

The engineering implementation of our push prompt feature in the iOS application involved the EnablePushNotificationsDeeplinkHandler, PushRegistrationService, and iOS system level APIs all working together (see Figure 5). The EnablePushNotificationsDeeplinkHandler handled the banner’s action URLs by rendering the bottomsheet. Along with presentation, the handler also handled the button clicks and would utilize PushRegistrationService to take care of flow determination. If any workflow required checking system level settings, then PushRegistrationService would interface with the system level settings API. 

Figure 5: The end-to-end walkthrough of the feature’s behavior

Results

Our analytics team was able to conduct analysis and predict that the notification banner placement in the Offers Hub page would contribute to a 15% uplift on the number of users that will opt into subscribing to App notifications upon visiting one of the targeted pages. We also did some analysis for the order page push prompt banner placement, and so far, our experiments read that there is a 27.5% uplift in push opt-in rates for customers visiting the page. Both of these features have been rolled out on the iOS application for A/B testing. Within 4 weeks, we hope to conclude that our push prompts’ uplifts on consumer metrics to be statistically significant.

Sending Mx Banking Notifications to Prevent Deactivation

By Amrita Rajan

One of the challenges to ensuring merchants have a smooth onboarding experience to DoorDash is collecting accurate banking information. If any banking information is added incorrectly, it can cause deactivation or general frustration. In this blurb, we will discuss how we mitigate this issue by building notifications around merchant banking information by using Kafka and Cadence.

Why we need to explicitly notify merchants

When merchants input their banking information during onboarding, the payment processor does not immediately verify the information in order to prevent delays. Upon later review, if the processor determines that a merchant has invalid information, the merchant’s payouts can become blocked. After a certain period, if these issues are not resolved, the merchant’s account will ultimately become deactivated. 

Currently, the banking page in the merchant portal displays a banner alert if there are any errors or missing information. While helpful, this feature is not effective in resolving the issue because the merchant does not receive any alerts and would therefore need to manually check the portal in order to be aware that something is wrong. Merchants only receive an email after their account is deactivated, which can be too late to resolve the problem.

Ultimately, this lack of notifications can disrupt the merchant experience and should be rectified. If merchants are in an unverified state, the current banner alert approach delays them from becoming active on DoorDash and could potentially discourage them from joining altogether. By directly sending emails, it allows merchants to be proactive about fixing their information.

Obtaining the payment information from payment processor

In order to implement this feature, we would need to have information about a merchant’s payment and banking information in the onboarding service. The onboarding service is owned by the Merchant Selection and Onboarding Team. It houses operations pertaining to merchant onboarding. 

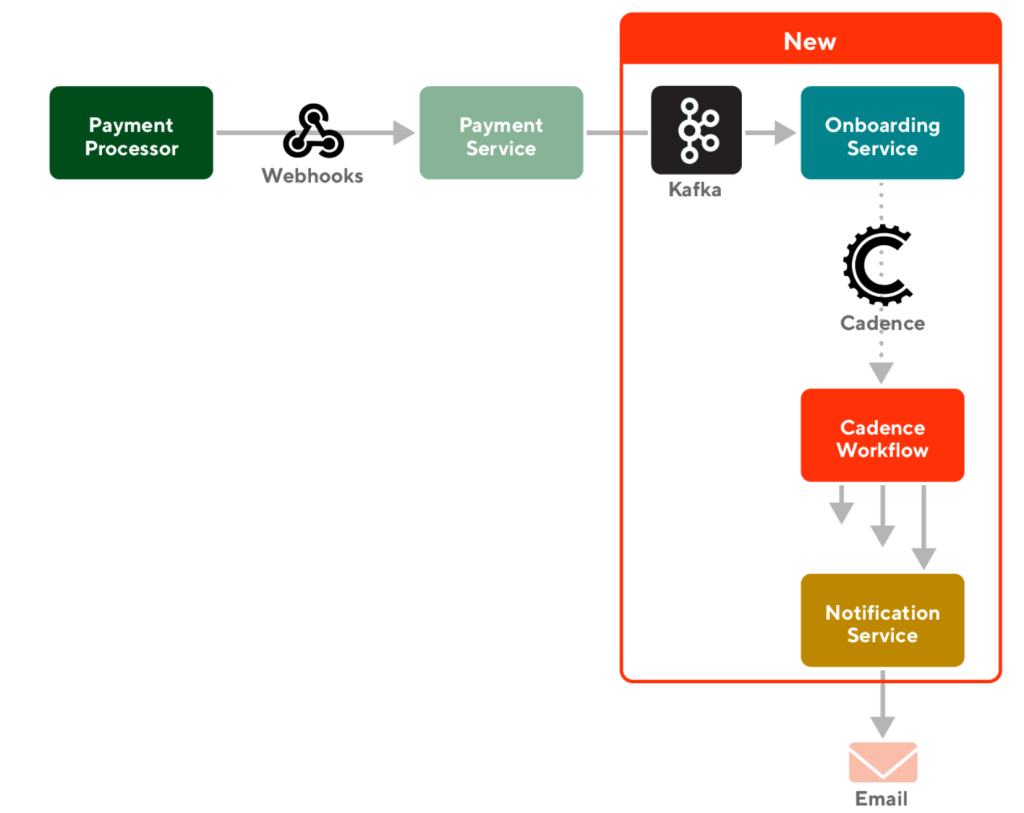
Figure 1: A diagram depicting the architecture of the project, showing the relationship between the payment processor, payment service, and onboarding service.

As depicted in Figure 1, the payment processor sends webhooks to the payment service. Webhooks are automated messages containing pertinent information that are sent when an event occurs. An event in this scenario would be if a merchant updates their banking page or any other financial activity.

We set up a Kafka integration in onboarding service. Kafka is a type of event streaming that enables us to process data in real time. Payment service produces a Kafka topic – or a type of event – that contains all of the necessary information about a merchant’s current verification status. Setting up a Kafka integration in onboarding service allows us to read information from payment service, thus, establishing a connection between the two services.

Setting up workflow to send emails

After receiving information from the payment service, the next stage is to actually send the emails in the onboarding service.

Figure 2: Flow chart highlighting the logic for sending emails to merchants

Each time we receive a Kafka event or information about a merchant’s financial information, we process it. We parse various fields in order to decipher whether or not a merchant is verified. If they are not verified, we send them recurring emails that remind them to check their portal and update their information. However, if they are verified, we stop the emails. In order to proactively send these emails, we use Cadence, a workflow that executes a sequence of activities.

Impact

After the email notification feature goes live, merchants who are at the risk of deactivation will receive reminder emails. Unlike the banner alert approach, this will resolve the invalid information sooner and more efficiently. The success of the project can be measured by the decline of merchants who become deactivated due to incorrect banking information.

While building a feature store to handle the massive growth of our machine-learning (“ML”) platform, we learned that using a mix of different databases can yield significant gains in efficiency and operational simplicity. We saw that using Redis for our online machine-learning storage was not efficient from a maintenance and cost perspective. For context, from 2021 to 2022, our team saw the number of ML features being created by ML practitioners at DoorDash increase by more than 10x.

To find a more efficient way to accommodate the growth, we decided to research using a different database to supplement Redis as a backend for our online feature store. Ultimately, we settled on using CockroachDB as a feature store. After iterating using the new platform, we were able to reduce our cloud-spend per value-stored on average by 75% with a minimal increase in latency. In the rest of this post, we’ll be going over all of our learnings on operating a fleet of Redis clusters at scale and what we learned after using CockroachDB to augment our online serving platform.

Maintenance overheads of large-scale Redis clusters

If you read the prior blog post on our feature store (a must-read), you might be asking, ‘Why add another database?’ Redis looked like the runaway favorite candidate by every conceivable metric. However, once we introduced Fabricator, our internal library for feature engineering, we saw the number of machine learning use cases skyrocket, and as a consequence, the number of features being created and served online also increased dramatically. The increased number of features meant that at a certain point, our team was upscaling a Redis cluster once a week. We also needed to institute capacity checks to prevent feature uploads from using up to 100% of the memory on the cluster.

We quickly learned that upscaling our large Redis clusters (>100 nodes) was an extremely time-consuming process that was prone to errors and not scalable. Upscaling using the native AWS ElastiCache consumed extra CPU, and that caused latencies to increase, resulting in an indeterminate amount of time required to complete a run.  To make sure our jobs ran in a timely manner, we had to create our own approach to scaling Redis in a way that was acceptable to our business objectives. After a few different iterations, we eventually settled on a simple process with almost no downtime.

Our process for upscaling large Redis clusters with zero downtime

When our Redis clusters get overloaded due to the number of new features that are created, we need to increase the resources and underlying infrastructure. Our process for upscaling is similar to a blue-green deployment process: 

  1. Spin up a Redis cluster with the desired number of nodes from the most recent daily backup
  2. Replay all of the writes from the last day on the new cluster
  3. Switch over traffic to the new cluster
  4. Delete the old cluster

On average upscaling our Redis clusters would end up being a 2-3 day process since the different steps would need to be coordinated with all the teams in charge of provisioning cloud infrastructure and other teams relying on the service for support. Switchovers would always be executed in off-peak hours to minimize service disruptions. Sometimes restoring backups would fail due to a lack of AWS instance types so we would need to contact AWS support and try again.

Why we added CockroachDB to our ecosystem

Even though we saw in prior benchmarks that it had higher latencies for a variety of read/write operations compared to Redis, we decided that CockroachDB would serve as a good alternative for a variety of use cases that do not require ultra-low latency and high throughput. In addition, CockroachDB has a variety of attributes that make it very desirable from an operational standpoint including:

  • Database version upgrades and scaling operations result in 0 downtime
  • CockroachDB supports auto-scaling behavior based on load both at a cluster and a range level
  • The data being stored in sequential ranges makes for desirable properties that can improve performance down the line
  • Disk-based storage makes the cost of storing high cardinality features much cheaper

What makes CockroachDB different

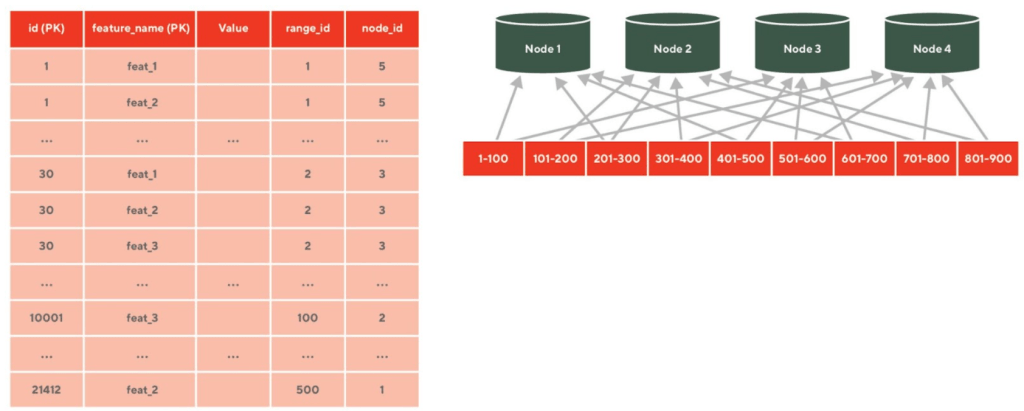
What differentiates CockroachDB from other databases, besides its performance, is its unique storage architecture. At a high level, CockroachDB is a Postgres-compatible SQL layer that is capable of operating across multiple availability zones. Underneath the SQL layer is a strongly-consistent distributed key-value store. Like Cassandra, data is stored using an LSM. But the key difference between Cassandra and CockroachDB is that instead of using a ring hash to distribute the keys across nodes, CockroachDB stores keys in ordered chunks called “ranges,” where a range is an interval of primary keys between two values (as depicted in Figure 1). Ranges will grow up to a given size and once the range exceeds that size, it will automatically split, allowing the new decomposed ranges to be distributed across different nodes. Ranges can also split automatically when the number of queries hitting the range exceeds a defined threshold, making it resilient to spikes in traffic and skewed read patterns.

Figure 1: A simple breakdown of how a table would be stored on the cluster level. A table is split into sequential chunks called ranges, where each range is stored across multiple nodes.

Initial design optimizations and challenges

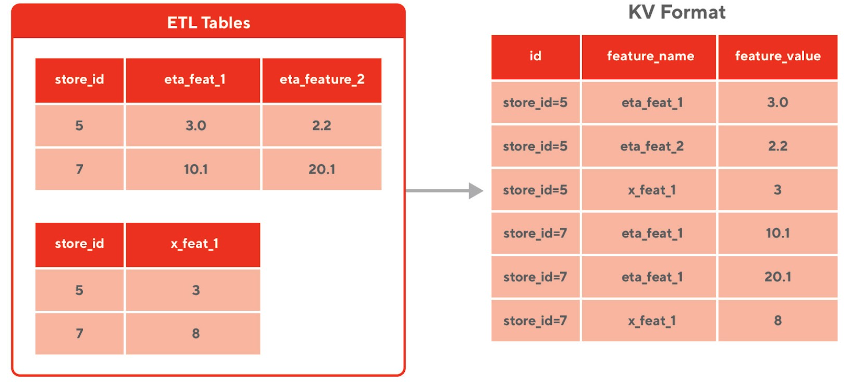
Our initial design for the feature store sought to use the entity key and feature name as the primary key (shown in Figure 2). This primary key matched the current pattern of our upload service, where we would queue up features from a table and upload them into Redis via entity and feature value. 

Figure 2: The data from the ETL tables get transformed into a key-value format where all the features for a given entity are stored in sequential rows

Part of the scope of our initial design was to figure out what would be the read/write behavior. Along the way, we learned a lot of optimizations to get the highest possible upload throughput.

Write batch sizes need to be small

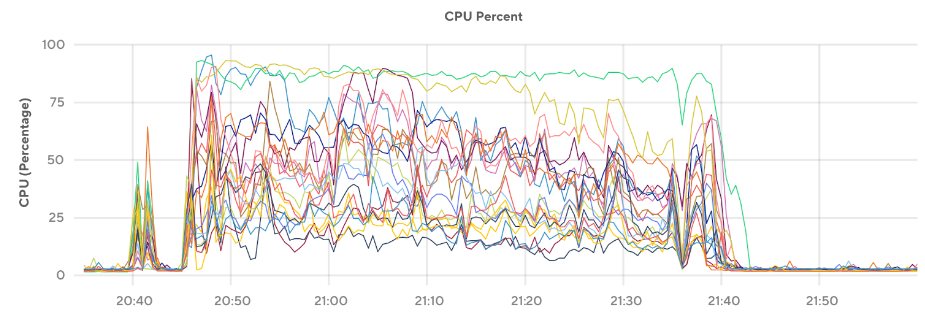
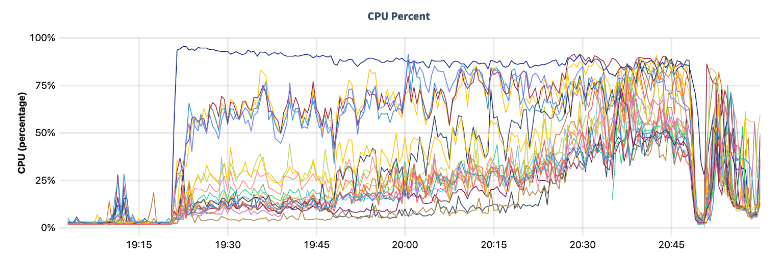
When batch sizes are large (e.g., >1000 values per INSERT query), the entire cluster grinds to a halt and throughput drops since queries are limited by the slowest node executing any part of the query (see Figure 3). Performance also becomes impacted from contention due to the serialized isolation level. So this can result in skewed CPU usage that limits the performance of the cluster. When lowering the number of values per query and increasing the number of threads, a similar throughput can be achieved, but with a much better-balanced CPU load (shown in Figure 4).

Figure 3: CPU load on the CockroachDB cluster with 1000 values being inserted per query
Figure 4: CPU load on the CockroachDB cluster with 25 values being inserted per query

Tables need to be prepared for high write throughput after being created 

Since every table starts with a single range, it also means that all the writes can only be done on a single node to start with, and as a result throughput to be limited to the performance of a single node until the workload starts to be decomposed and distributed across the cluster (Figure 5). It is possible to mitigate this warm-up behavior by pre-splitting ranges on the table with a command or throttling write throughput until the table creates enough ranges to be distributed across the cluster.

Figure 5: Chart shows the CPU load changing over time as the data being inserted continues to split and distribute itself across different nodes.

Other design considerations 

Besides those two main considerations we also did the following: 

  • Inserting the entire row, instead of a subset of values eliminates the `read` from the query plan (called a fast path insert) and decreases CPU usage by ~30%
  • By chunking incoming feature value requests into many smaller queries with aggressive timeouts, we’re able to significantly reduce read request times and improve the overall reliability of the service.
  • By sorting the values within each partition being uploaded, we are also able to decrease the number of nodes a given query touches, reducing the overall CPU consumption

Stay Informed with Weekly Updates

Subscribe to our Engineering blog to get regular updates on all the coolest projects our team is working on

Using CockroachDB as a feature store in production

After doing some explorations on read and write sizes, we decided to move CockroachDB into production for a small number of use cases while also double-writing the majority of our features to facilitate a quick migration for existing use cases. We ended up observing that write throughput was much lower than we expected and extremely inconsistent over the lifetime of our upload workload. Using 63 m6i.8xlarge instances (AWS EC2 Instance Types), we were able to insert approximately 2 million rows per second into the database at peak (see Figure 6), while utilizing an average of ~30% of the CPU of the cluster. However, at times we would see CPU utilization spike to 50-70% and the number of values we were inserting into the database per second would drop by 50%+ to less than 1 million rows per second.

Figure 6: Aggregate values inserted per second to the feature store across various workloads

After working with some engineers from Cockroach Labs, we learned that the number of ranges that are being accessed at a given time will increase the CPU usage on writes, causing each query running to execute much slower than before (as shown in Figure 7). The more writes there are, the more the cache is occupied by data from writes instead of the data being requested for reads, causing the read requests to have a higher latency. 

At this point using some back-of-the-envelope calculations, we were storing feature values at roughly 30% of the cost of Redis. As the number of values we were writing was increasing, performance was getting worse, since the number of ranges a given entity space would occupy was increasing, meaning that our efficiency and gains compared to using Redis would continue to go down. A 30% decrease in costs wasn’t quite the win we were hoping for, so we tried to look for some ways we could decrease the number of writes and save some CPU.

Figure 7: The above chart illustrates the relationship between the number of quiescent replicas and the associated drops in queries executed per second by the cluster in addition to the spikes in CPU utilization.

Condensing our writes using JSON Maps

Our prior tests showed significant improvements in performance when using a NoSQL approach, where values for an entity are stored in a JSON map, but had some concerns with this approach since the documentation on CockroachDB indicates that performance may start to degrade once the JSON map is >1MB in size.

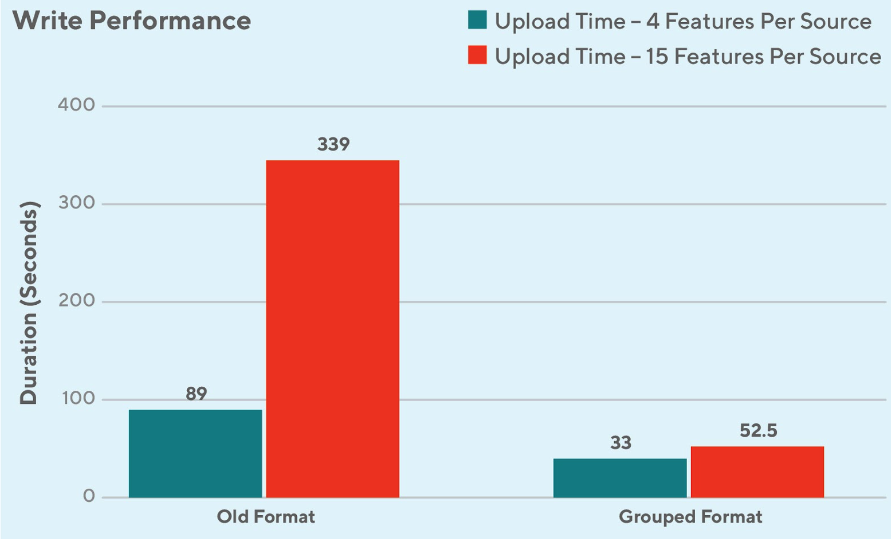
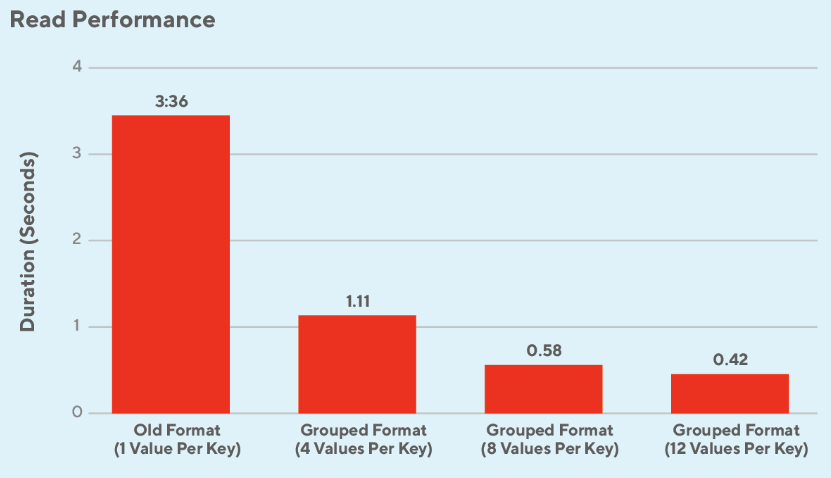
With some brainstorming we were able to come up with ways to constrain the size of our JSON maps by using a primary key based on the ETL job it was generated by (shown in Figure 8). This resulted in near-linear gains in read/write performance with increased feature values in a single row (shown in Figures 9 and 10). This also ends up being much more efficient than merging to an existing JSON map since a merge into a JSON map in SQL requires an extra read operation in the query plan.

Figure 8: Illustration of the new table format that condensed feature values for an entity into a given JSON map. The “source” column on the right corresponds to the name of a given ETL table from the left.
Figure 9: Time to upload a batch of features based on the number of features in a table (lower is better).
Figure 9: Time to upload a batch of features based on the number of features in a table (lower is better). 
Figure 10: Time to read feature values based on number of feature values in map (lower is better).

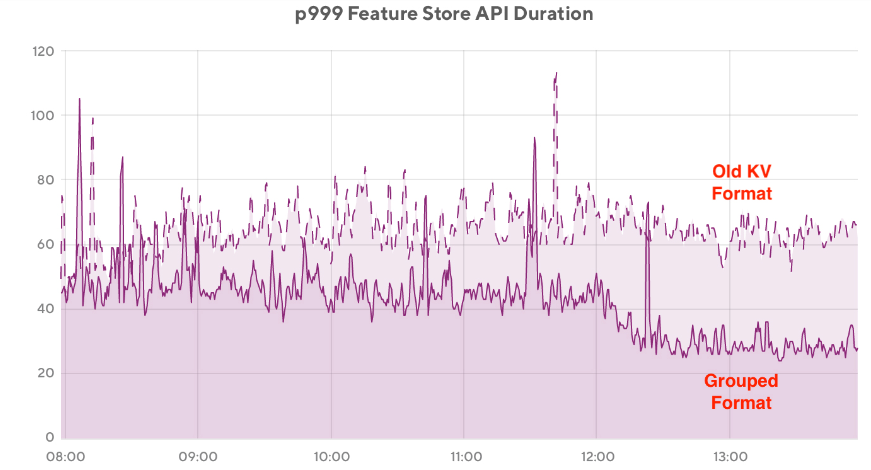
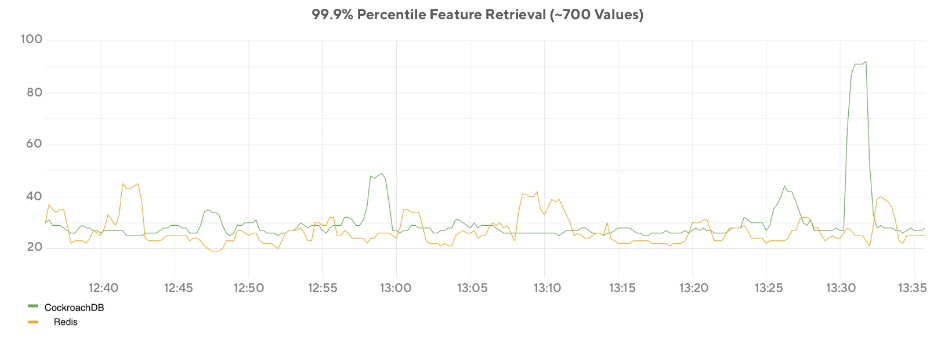
This format resulted in efficiency increase up to 300% higher compared to the original format on average for writes (see Figure 11) and saw the read latency for existing use cases drop by 50% (see Figure 12). The increases in efficiency were due to decreases in the number of ranges a feature occupies and decreases in the number of write operations required. The resulting improvement in read performance also showed that in some cases CockroachDB can reach similar performance levels to that of Redis on a similar workload (see Figure 13).

Figure 11: Values inserted per second compared to baseline. The peaks are caused by some rows having more values in a row that others
Figure 12: Comparison in read latency (99.9% percentile) performance between the grouped format and the old KV format
Figure 13: Comparison of read performance for fetching ~700 values in a single request for a given model between Redis and CockroachDB

Final thoughts

Even though we’ve seen these savings by using CockroachDB as a feature store, there are still many use cases where using Redis makes sense. For services with an extremely high-volume of reads relative to the number of values, or cases where the total size of the data being stored is low, Redis is definitely still a great choice. As a matter of fact, we are still using Redis for over 50% of our features today. In general though, we think there is still a lot of performance left to squeeze out of our existing implementations and we’re just scratching the surface of what we’re capable of doing with CockroachDB and will continue to iterate and share our learnings.

Hopefully readers can utilize the learnings we shared in this post to create an optimal solution of their own that is highly tailored to the needs of their machine-learning platform.

Acknowledgments 

This was a huge, 7-month effort across multiple teams. Special thanks to everyone who was involved in the effort.

Dhaval Shah, Austin Smith, Steve Guo, Arbaz Khan, Songze Li, Kunal Shah

And an extra special thanks to the Storage Team and Cockroach Labs folks for answering 5 million questions on performance tuning!

Sean Chittenden, Mike Czabator, Glenn Fawcett, Bryan Kwon

When dealing with failures in a microservice system, localized mitigation mechanisms like load shedding and circuit breakers have always been used, but they may not be as effective as a more globalized approach. These localized mechanisms (as demonstrated in a systematic study on the subject published at SoCC 2022) are useful in preventing individual services from being overloaded, but they are not very effective in dealing with complex failures that involve interactions between services, which are characteristic of microservice failures. 

A novel way to deal with these complex failures takes a globalized view of the system: when an issue arises, a global mitigation plan is automatically activated that coordinates mitigation actions across services. In this post, we evaluate the open-source project Aperture and how it enables a global failure mitigation plan for our services. We first describe the common types of failures we have experienced at DoorDash. Then we dive into the existing mechanisms that have helped us weather failures. We will explain why localized mechanisms may not be the most effective solution and argue in favor of a globally aware failure mitigation approach. Furthermore, we will share our initial experiences using Aperture, which offers a global approach to address these challenges.

Classes of microservice architecture failures

Before we explain what we have done to deal with failures, let’s explore the types of microservice failures that organizations experience. We will discuss four types of failures that DoorDash and other enterprises have encountered. 

At DoorDash, we view each failure as a learning opportunity and sometimes share our insights and lessons learned in public blog posts to show our commitment to reliability and knowledge sharing. In this section, we will discuss some common failure patterns that we experienced. Each section is accompanied by real outages drawn from our past blog posts that can be explored in greater detail.

Here are the failures we will detail:

  • Cascading failure: a chain reaction of different interconnected services failing
  • Retry storm: when retries put extra pressure on a degraded service
  • Death spiral: some nodes fail, causing more traffic to be routed to the healthy nodes, making them fail too
  • Metastable failure: an overarching term that describes failures that can’t self-recover because of the existence of a positive feedback loop

Cascading failure

Cascading failure refers to the phenomenon where the failure of a single service leads to a chain reaction of failures in other services. We documented a severe outage of this kind in our blog. In that case, the chain of failure started from a seemingly innocuous database maintenance, which increased the database latency. The latency then bubbled up to the upstream services, causing errors from timeouts and resource exhaustion. The increased error rates triggered a misconfigured circuit breaker, which stopped traffic between a lot of unrelated services, resulting in an outage with a wide blast radius.

Cascading failure describes a general phenomenon where failure spreads across services, and there is a wide range of ways a failure can transmit to another. Retry storm is one common mode of transmission among others, which we will dive into next.

Figure 1: The diagram illustrates a microservice system experiencing cascading failure. The issue starts with a degraded database that experiences increased latency. This latency spreads through RPC call chains and triggers a bug in Service 2. This bug causes Service 2 to respond with errors to some requests, which then impacts Service 1.

Retry storm

Due to the unreliable nature of Remote Procedure Calls(RPC), the RPC call sites are often instrumented with timeouts and retries to make every call more likely to succeed. Retrying a request is very effective when the failure is transient. However, retries will worsen the problem when the downstream service is unavailable or slow since in that case, most requests will end up being retried multiple times and will still ultimately fail. This scenario where excessive and ineffective retries are applied is called work amplification, and it will cause an already degraded service to degrade further. As an example, this kind of outage happened at an early stage of our transition to microservices: a sudden increase in the latency of our payment service resulted in the retry behavior of the Dasher App and its backend system, which exacerbated the situation.

Figure 2: This diagram illustrates a microservice system experiencing a retry storm. The issue starts with a degraded database that experiences increased latency. This latency spreads through RPC call chains and triggers retry in Service 2, 3, and 5, which puts even greater pressure on DB.

Death Spiral

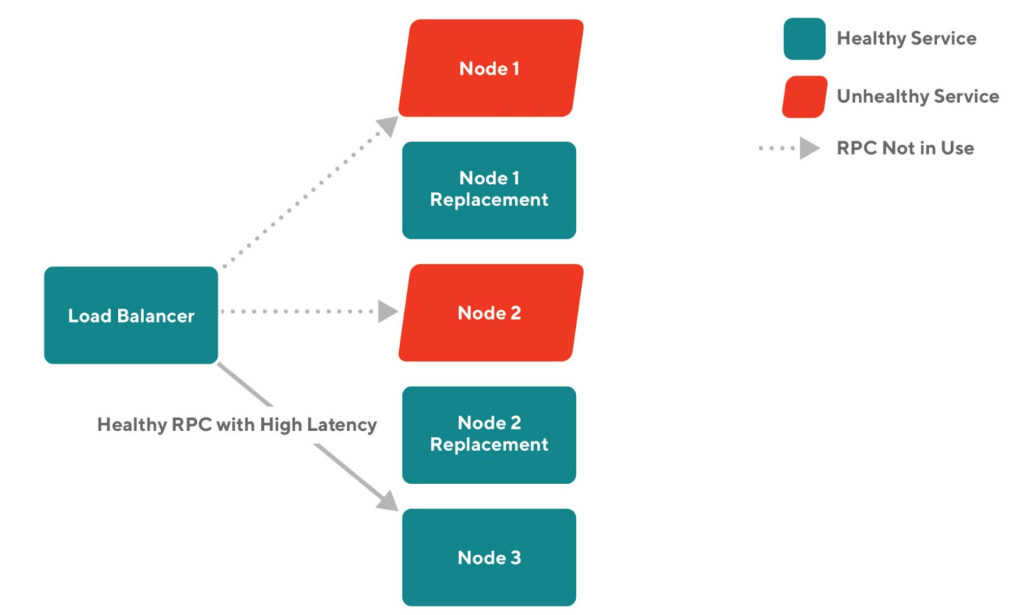
Failures can frequently spread vertically through an RPC call graph across services, but they can also spread horizontally among nodes that belong to the same service. A death spiral is a failure that starts with a traffic pattern that causes a node to crash or become very slow, so the load balancer routes new requests to the remaining healthy nodes, which makes them more likely to crash or become overloaded. This blog post describes an outage that began with some pods failing the readiness probe and was thus removed from the cluster, and the remaining nodes failed since they were not able to handle the massive loads alone. 

Figure 3: This diagram illustrates a service cluster experiencing a death spiral. Node 1 and node 2 become degraded and are replaced by newly launched nodes, which are not ready to take traffic. The load-balancer routes all incoming requests to node 3, making it more likely to degrade too.

Metastable failures

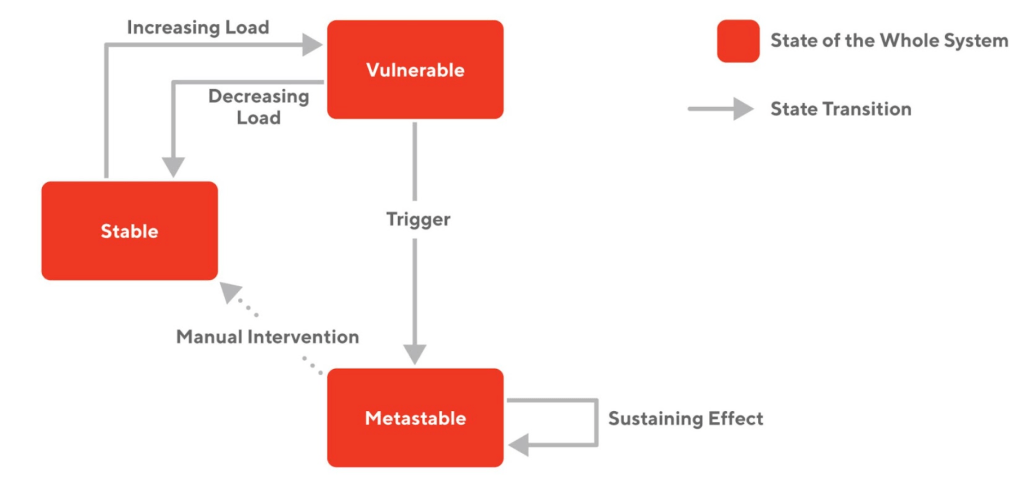
A recent paper proposes a new framework to study distributed system failures, which is called a “metastable failure.” Many of the outages we experienced belong to this category. This type of failure is characterized by a positive feedback loop within the system that provides a sustaining high load because of work amplification, even after the initial trigger (e.g., bad deployment; a surge of users) is gone. Metastable failure is especially bad because it will not self-recover, and engineers need to step in to stop the positive feedback loop, which increases the time it takes to recover.

Figure 4: This diagram illustrates the lifecycle of metastable failure. The system operates in both stable and vulnerable states as loads fluctuate. When the system is in a vulnerable state, a trigger such as a surge of users can cause it to transition into a metastable state, characterized by a sustained high load resulting from a positive feedback loop within the system. It is then necessary for manual intervention to return the system to a stable state.

Local countermeasures

All of the failures documented in the section above are types of countermeasures that attempt to limit the impact of the failure locally within an instance of a service, but none of these solutions allow coordinated mitigation across services to ensure the overall recovery of the system. To demonstrate this we will dive into each existing mitigation mechanism we deployed and then discuss their limitations.

The countermeasures we will discuss are:

  • Load shedding: which prevents degraded services from accepting more requests 
  • Circuit breaker: which stops outgoing requests when degraded
  • Auto scaling: that can help with handling high load at peak traffic, but it’s only useful if it’s configured to be predictive rather than reactive

Next we will explain how all of these fault tolerance strategies work and then discuss their drawbacks and tradeoffs.  

Load shedding

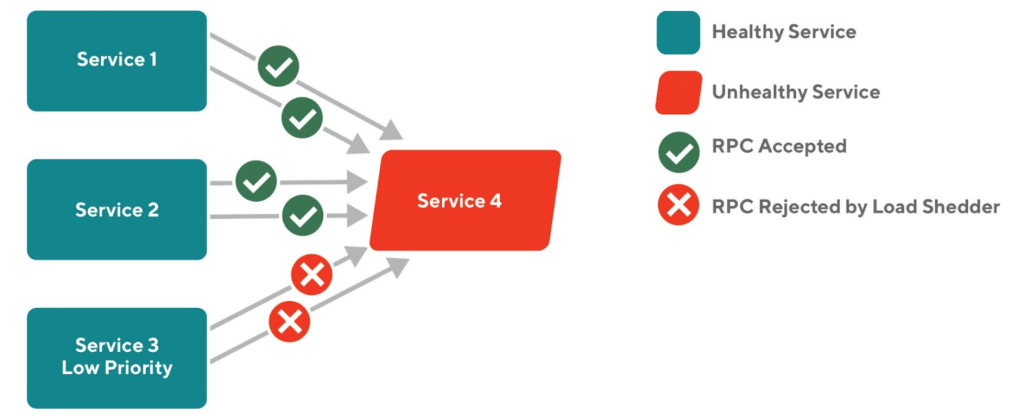
Load shedding is a reliability mechanism that rejects incoming requests at the service entrance when the number of in-flight or concurrent requests exceeds a limit. By rejecting only some traffic, we maximize the goodput of the service, instead of allowing the service to be completely overloaded where it would no longer be able to do any useful work. At DoorDash, we instrumented each server with an “adaptive concurrency limit” from the Netflix library concurrency-limit. It works as a gRPC interceptor and automatically adjusts the maximum number of concurrent requests according to the change in the latency it observes: when the latency rises, the library reduces the concurrency limit to give each request more compute resources. Additionally, the load shedder can be configured to recognize priorities of requests from their header and only accept high priority ones during a period of overload.

Figure 5: This diagram shows a load shedder at work. Service 4 is degraded and can not process all requests coming to it. At the entry of the service, it rejects requests coming from Service 3 due to its low priority.

Load shedding can be effective in preventing a service from being overloaded. However, since the load shedder is installed at the local level, it can only handle local service outages. As we have seen in the previous section, failures in a microservice system often result from an interaction between services. Therefore, it would be beneficial to have a coordinated mitigation during an outage. For example, when an important downstream Service A becomes slow, an upstream Service B should start gating the requests before they reach A. This prevents the heightened latency from A to spread inside the subgraph, potentially causing a cascading failure.

Besides the limitation of the lack of coordination, load shedding is also hard to configure and test. Properly configuring a load shedder requires carefully orchestrated load testing to understand a service’s optimal concurrency limit, which is not an easy task because in the production environment, some requests are more expensive than others, and some requests are more important to the system than others. As an example of a misconfigured load shedder, we once had a service whose initial concurrency limit was set too high, which resulted in a temporary overload during the service’s startup time. Although the load shedder was able to tune down the limit eventually, the initial instability was bad and showed how important it is to correctly configure the load shedder. Nevertheless, engineers often leave these parameters to their default values, which is often not optimal for individual services’ characteristics.

Circuit breaker

While load shedding is a mechanism to reject incoming traffic, a circuit breaker rejects outgoing traffic, but like a load shedder it only has a localized view. Circuit breakers are typically implemented as an internal proxy that handles the outgoing requests to the downstream services. When the error rate from the downstream service exceeds a threshold, the circuit breaker opens, and it quickly rejects all requests to the troubled service without amplifying any work. After a certain period, the circuit breaker gradually permits more traffic to pass, ultimately returning to normal operation. We at DoorDash have built a circuit breaker into our internal gRPC client.

Figure 6: The diagram shows a circuit breaker at work. Service 4 is degraded and returns errors. The circuit breaker instrumented at the Service 3’s client side opens and stops all requests coming out of Service 3.

In situations where the downstream service is experiencing a failure but has the ability to recover if traffic is reduced, a circuit breaker can be useful. For example, during a death spiral in the formation, unhealthy nodes are replaced by newly started nodes that are not ready to take traffic, so traffic is routed to the remaining healthy nodes, making them more likely to be overloaded. An open circuit breaker, in this case, gives extra time and resources for all nodes to become healthy again.

Circuit breakers have the same tuning problem as load shedding: there is no good way for service authors to determine the tripping threshold. Many online sources on this subject use a “50% error rate” as a rule of thumb. However, for some services 50% error rate may be tolerable. When a called service returns an error, it might be because the service itself is unhealthy, or it might be because a service further downstream is having problems. When a circuit breaker opens, the service behind it will become effectively unreachable for a period of time, which may be deemed even less desirable. The tripping threshold depends on the SLA of the service and the downstream implications of the requests, which must all be considered carefully.

Stay Informed with Weekly Updates

Subscribe to our Engineering blog to get regular updates on all the coolest projects our team is working on

Auto-scaling

All cluster orchestrators can be configured with autoscaling to handle increases in load. When it’s turned on, a controller periodically checks each node’s resource consumption (e.g. CPU or memory), and when it detects high usage, it launches new nodes to distribute the workload. While this feature may seem appealing, at DoorDash we recommend that teams do not use reactive auto-scaling (which scales up the cluster in real time during a load peak). Since this is counterintuitive, we list the drawback of reactive auto-scaling below.

  • The newly launched nodes need time to warm up (fill caches, compile code, etc.) and will exhibit higher latency, which temporarily reduces cluster capacity. Also, the new nodes will run costly startup tasks such as opening database connections and triggering membership protocols. These behaviors are infrequent, so a sudden increase in them may lead to unexpected results.
  • During an outage that involves a high load, adding more capacity to one service will often just move the bottleneck to somewhere else. It typically does not solve the problem.
  • Reactive auto-scaling makes it harder to do post-mortem analysis, as the timeline of metrics adjusts in various ways to both the incident, whatever actions humans are taking to mitigate, and the auto-scaler.

Therefore, we advise teams to avoid using reactive auto-scaling, preferring instead to use predictive auto-scaling such as KEDA’s cron that adjusts a cluster’s size based on expected traffic levels throughout the day.

All of these localized mechanisms are good at dealing with different failure types. However being localized has its own downsides, now we are going to dive into why localized solutions can only get you so far and why a globalized observation and intervention would be preferable. 

Shortcomings of existing countermeasures

All the reliability techniques we employ have a similar structure consisting of three components: measurement of operational conditions, identification of problems through rules and settings, and actions to take when issues arise. For example, in the case of load shedding, the three components are:

  • Measure: calculates the recent history of service latency or errors
  • Identify: uses mathematical formulas and pre-set parameters to determine if the service is at risk of being overloaded
  • Action: denies excess incoming requests

For circuit breaker, they are:

  • Measure: evaluates downstream service’s error rate
  • Identify: checks if it exceeds a threshold
  • Action: stops all outgoing traffic to that service

However, existing localized mechanisms suffer from similar shortcomings in that:

  • They use the metrics that are local to the service to measure operating conditions; however, many classes of outages involve an interaction between many components, and it requires one to have a global view of the system to make good decisions about how to mitigate the effects of an overload condition. 
  • They employ very general heuristics to determine the system’s health, which is often not precise enough. For example, latency alone can not tell whether a service is overloaded; a high latency could be caused by a slow downstream service.
  • Their remediation actions are limited. Since the mechanisms are instrumented locally, they can only take local actions. Local actions are usually not optimal for restoring the system to a healthy state since the true source of the problem might be elsewhere.

We are going to discuss how to overcome these shortcomings and make the mitigation more effective.

Utilizing globalized controls: Aperture for reliability management

A project that moves beyond local countermeasures to implement globalized load control is implemented by Aperture, an open-source reliability management system. It provides a reliability abstraction layer that makes reliability management easier across a distributed microservice architecture. Unlike existing reliability mechanisms that can only react to local abnormalities, Aperture offers a centralized load management system that enables it to coordinate many services in response to an ongoing outage. 

Aperture’s design

Like existing countermeasures, Aperture monitors and controls the system’s reliability with three key components. 

  1. Observe: Aperture collects reliability-related metrics from each node and aggregates them in Prometheus. 
  2. Analyze: An independently running Aperture controller is constantly monitoring the metrics and tracks deviation from SLO
  3. Actuate: If there are any abnormalities, the Aperture controller will activate policies that match the observed pattern and apply actions at each node, like load shedding or distributed rate limiting. 

Our experience using Aperture

Aperture is highly configurable in how it detects and acts to the system abnormalities. It takes in policies written in YAML files that guide its actions during an outage. For example, the code below, taken from Aperture doc and simplified, computes the exponential moving average (EMA) latency. It takes latency metrics from Prometheus and triggers an alert when the calculated value is over a threshold. 

circuit:
    components:
      - promql:
          evaluation_interval: 1s
          out_ports:
            output:
              signal_name: LATENCY
          query_string:
            # OMITTED
      - ema:
          ema_window: 1500s
          in_ports:
            input:
              signal_name: LATENCY
          out_ports:
            output:
              signal_name: LATENCY_EMA
          warm_up_window: 10s
      - decider:
          in_ports:
            lhs:
              signal_name: LATENCY
            rhs:
              signal_name: LATENCY_SETPOINT
          operator: gt
          out_ports:
            output:
              signal_name: IS_OVERLOAD_SWITCH
      - alerter:
          alerter_config:
            alert_name: overload
            severity: crit
          in_ports:
            signal:
              signal_name: IS_OVERLOAD_SWITCH
    evaluation_interval: 0.5s

When an alert is triggered, Aperture automatically executes actions according to the policies it is configured with. Some of the actions it currently offers include distributed rate limiting and concurrency limiting (aka load shedding). The fact that Aperture has a centralized view and control of the entire system opens up numerous possibilities for mitigating outages. For example, one can configure a policy that sheds loads on an upstream service when a downstream service is overloaded, allowing the excessive requests to fail before reaching the problematic subgraph, which makes the system more responsive and saves costs.

To test out Aperture’s capability, we ran a deployment of Aperture and integrated it into one of our primary services, all within a testing environment and found it to be an effective load shedder. As we increased the RPS of the artificial requests sent to the service, we observed that the error rate increased, but the goodput remained steady. On a second run, we reduced the compute capacity of the service, and this time we observed that the goodput reduced, but the latency only increased slightly. Behind the scenes of both runs, the Aperture controller noticed an increase in latency and decided to reduce the concurrency limit. Consequently, our API integration in our application code rejected some of the incoming requests, which is reflected by an increased error rate. The reduced concurrency limit ensures that each accepted request gets enough compute resources, so the latency is only slightly affected.

With this simple setup, Aperture basically acts as a load shedder, but it is more configurable and user-friendly than our existing solutions. We are able to configure Aperture with a sophisticated concurrency limiting algorithm that minimizes the impact of unexpected load or latency. Aperture also gives an all-in-one Grafana dashboard using Prometheus metrics, which provides a quick glimpse of the health of our services.

We have yet to try out the more advanced features of Aperture, including the ability to coordinate mitigation actions across services and the possibility of having escalation policies in which autoscaling is triggered after a sustained load. Evaluating these features requires more elaborate setups. That being said, a reliability solution is best tested out in the production environment where real outages happen, which are always unpredictable.

Aperture integration details

It’s worth a deeper dive into how Aperture is integrated into an existing system. A deployment of Aperture consists of the following components:

  • Aperture controller: this module is the brain of the Aperture system. It constantly monitors the reliability metrics and decides when to execute a mitigation blueprint. When a blueprint is triggered, it sends the appropriate actions (e.g. load shedding) to the Aperture agent.
  • Aperture agent: each Kubernetes cluster runs an instance of Aperture agent, which is in charge of tracking and ensuring the health of the nodes running in the same cluster. When a request comes into a service, it will be intercepted by an integration point, which forwards the relative metadata to an Aperture agent. The Aperture agent records the metadata and replies with a decision of whether to accept the request. Such a decision is based on the information given by the Aperture controller.
  • Integration point: services that want to benefit from centralized reliability management can integrate with Aperture in three ways. If the services are built on a service mesh (currently only supporting Envoy), Aperture can be deployed on the service mesh directly without changing the application code. There are also Aperture SDKs that one can use to integrate application code with Aperture endpoints. For Java applications, one can also use Java Agent to automatically inject Aperture integration into Netty. To illustrate what this integration does, below is a code snippet that demonstrates how to use the Aperture SDK in Java.
  • Prometheus & etcd: these are databases that store the reliability metrics and are queried by the Aperture controller to get a measure of the current operating condition.
private String handleSuperAPI(spark.Request req, spark.Response res) {
    Flow flow = apertureSDK.startFlow(metadata);
    if (flow.accepted()) {
        res.status(202);
        work(req, res);
        flow.end(FlowStatus.OK);
    } else {
        res.status(403);
        flow.end(FlowStatus.Error);
    }
    return "";
  }

Conclusion

Existing reliability mechanisms are instrumented at the local level of individual services, and we have shown that globalized mechanisms work better at dealing with outages. In this blog, we showed why keeping a microservice system running reliably is a challenging problem. We also give an overview of our current countermeasures. These existing solutions effectively prevent many outages, but engineers often poorly understand their inner workings and don’t configure them optimally. Additionally, they can only observe and act inside each service, which limits their effectiveness in mitigating outages in a distributed system.

To test out the idea of using globalized mechanisms to mitigate outages, we investigated the open-source reliability management project Aperture. This project elevates reliability management to a primary component of the system by centralizing monitoring and controlling responsibilities rather than having them handled by individual services. By doing so, Aperture enables automated, efficient, and cost-effective methods for addressing outages. We had a positive experience during our initial trial, and we are excited by its potential.

At DoorDash, we’re committed to broadening access to opportunity for women to advance their careers. In addition to empowering equal outcomes through our efforts in hiring, pay equity, and promotions, we’re also using pillar moments throughout the year to highlight women-owned businesses on our platform and spotlight women who are leaders in their communities.

For Women’s History Month, we’re taking the time to reflect on the significant contributions of women and show appreciation for their stories. To celebrate in collaboration with our Women@ Employee Resource Group, we’re hosting a variety of hybrid events, offering opportunities to come together in person and virtually. 

To kick off Women’s History Month, three of our women leaders will make up an International Women’s Day panel to share background on their career journeys. Colleagues will tune in remotely or in our office hubs in San Francisco, Tempe, and New York to learn about the careers of Aditi Reddy, Director, MX Partnership Marketing; Crystal Boson, Senior Manager, Learning Design; and Nev Milanovic, VP, People Business Partners.

Other industry professionals will join during the month to share their experiences through events like a fireside chat with Opalia Meade, the co-founder of Designing in Color, and a Women in Logistics Event, which will be a celebration and informational event about DashMart, the Women@ DoorDash ERG, and women in the Logistics & Supply Chain industry.

Programming throughout the month also includes an IamRemarkable series to share about the importance of self-promotion in your personal and professional life, an empowerment and mental health support workshop hosted in collaboration with our Black@ ERG by HealHaus, a book club around “Lessons in Chemistry” by Bonnie Garmus, and a celebration of the incredibly inspiring women who work at DoorDash through our company Slack channel.

Our Entrepreneurship and Access work has helped women merchants on our platform grow their businesses. Serving more than 115 restaurants across the U.S. with 59% of participants identifying as women, Accelerator for Local Restaurants participants received a $20,000 grant, training, businesses advising, marketing, and more. Through our Accelerator for Local Merchants, participants, 40% of which were women, received a $5,000 grant, the opportunity to sell their goods via DashMart, and joined a six-week educational program designed in partnership with Next Street aimed at providing educational resources for participants to grow their businesses. We’re also proud to empower women Dashers and others through our ongoing Dasher financial empowerment work in partnership with the National Urban League, U.S. Department of Veterans Affairs, International Rescue Committee, and WoodGreen Community Services.

At DoorDash, our work to support women-owned businesses is an ongoing effort that is reflected in our platform, voice, and resources. As we celebrate Women’s History Month and the contributions they’ve made, we’re equally excited and looking forward, optimistically, to a more equitable world.

Our efforts to create a workplace where everyone feels welcomed, supported, and valued is one of the reasons we were recently recognized as one of America’s Greatest Workplaces 2023 by Newsweek. To learn more about this award and how we’ve driven the culture our employees experience over the last year, click here.

At DoorDash, teams are empowered to own all aspects of their work — from how they navigate career growth to how they manage their work-life integration.

Teams are encouraged to take advantage of our flexible vacation policy and have access to mental wellness resources, but Mariam Boni, Director of Regional Sales, saw an opportunity to get 1% better in supporting her team’s work-life integration upon returning from maternity leave last year. 

“Through analysis of employee feedback and internal surveys, we got a better understanding of how our teams were operating, and many of them were battling burnout,” Mariam said. 

“We are an organization of builders, which inspires us to do our best work every day. And we saw the benefits of having a winter slowdown, which coordinated time for our people to truly unplug from work in a coordinated way. That encouraged us to develop and introduce a pilot program called WeCharge days, where teams take the day to recharge, reset and come back to work even stronger.”

WeCharge isn’t just a day away from work. Mariam, Tiara Adams, and the SMB sales teams have developed the program into days of celebration, where the teams that participate commit to truly unplugging from work, documenting how they enjoyed their time away, and when they return, sharing their experiences. 

For the pilot of the program, the teams strategically picked days that coincided with long weekends. The pilot was a hit, with Mariam and the team not only seeing an increase in employee engagement, but also in productivity, performance, and employee sentiment. 

“We dreamed big, started small, and have been able to leverage this to make it an actual initiative across many teams for both salaried and hourly team members.” Mariam continued. “I don’t think when we rolled WeCharge out that we realized the impact this could have on our teams.”

Following the pilot of the program, an overwhelming majority of those involved with the program reported feeling highly satisfied with the additional time away, directly correlating the program with an improvement in work-life integration and a motivation factor.

“To work at DoorDash, you have to have grit, you have to be a builder. Everyone here is focused on the one team, one fight mentality,” Mariam said. “This program has really given us the data that shows when you invest in people as we have at DoorDash, they become more satisfied, more motivated, and even more productive.”

Currently, WeCharge has rolled out to include nine departments, with others interested in joining the program in the future. As our teams build new strategic functions and initiatives, they’re encouraged to continue identifying the best ways of working based on their respective needs, whether that means taking part in the WeCharge program or building something new entirely.

Our efforts to create a workplace where everyone feels welcomed, supported, and valued is one of the reasons we were recently recognized as one of America’s Greatest Workplaces 2023 by Newsweek. To learn more about this award and how we’ve driven the culture our employees experience over the last year, click here.

While most engineering tooling at DoorDash is focused on making safe incremental improvements to existing systems, in part by testing in production (learn more about our end-to-end testing strategy), this is not always the best approach when launching an entirely new business line. Building from scratch often requires faster prototyping and customer validation than incremental improvements to an existing system. In the New Verticals organization at DoorDash, we are launching and growing new categories such as alcohol and other regulated goods, health, retail, convenience, and grocery. Often we’re going from zero to one. We needed to move quite fast during one recent expansion of our business, which required a local development experience that could keep up. In this article we will provide some context and then explain how we were able to speed up our development by enabling easy local development with PostgreSQL 

Deviating from the typical DoorDash dev environment

Ideally, the infrastructure and requirements already are in place when we develop a backend microservice, which typically is the case for new applications at DoorDash. Concrete requirements and existing infrastructure streamline the path for development environments to integrate easily and safely, eliminating some of the need for rapid iteration because the application design can be front-loaded based on the requirements. Such existing stability helps avoid unexpected behavior within the application, ensuring that deployments are a safe operation.

However, this entirely new microservice could not be built on any existing infrastructure for compliance reasons. Instead, we had to develop our application in parallel with infrastructure planning and spin-up. As backend developers, we needed to stay unblocked while the infrastructure — in this case AWS resources — was being created. Our backend had to be developer-friendly and allow the team to iterate rapidly to deal with evolving requirements and work independently on separate tasks without the testing interrupting anyone’s work. With the amorphous nature of the task, the typical DoorDash local development environment approach was not suitable.

Creating a new local development approach

To kick off the creation of a local dev environment, we first had to take stock of our desired infrastructure as well as our available tooling and resources before charting out how to set up the environment quickly and efficiently. We knew we’d be deploying a Docker container to Fargate as well as using an Amazon Aurora PostgreSQL database and Terraform to model our infrastructure as code. It was fair to assume that we would use other AWS services, particularly SQS and AWS Secrets Manager

One local development approach would have been to mock, or create dummy versions of our cloud resources. Local mocks may work well under some circumstances, but it’s difficult to be fully confident in the final end-to-end experience of an application because the mocks may be incorrect, lack important features, or ultimately have unanticipated behaviors.

Given these considerations, we developed a strategy for architecting our local development environment that would maximize the tradeoffs between development speed, ease of use, and how closely it matches production. We broke the strategy into four steps: 

  1. Use Docker Compose for our Docker application and all of its required resources.
  2. Set up a locally running containerized PostgreSQL database.
  3. Use LocalStack to enable locally running AWS resources.
  4. Utilize Terraform to create consistent AWS resources in LocalStack.

Understanding the tradeoffs 

Our local development approach involved a number of benefits and drawbacks, including: 

Pros:

  • Quick and easy for anyone new to the project to get the local development environment running for themselves.
  • Consistent local development environments between machines and between environment startups.
  • No chance of accidentally touching any production data or systems.
  • Easy to iterate on the desired infrastructure and add new application capabilities. 
  • No infrastructure required in the cloud.
  • No long waits during startup. Initial runs require some extra time to download Docker images, but each subsequent startup should be speedy.
  • All mastered in code, with the application and its complete environment mapped out via Docker Compose and Terraform.
  • Backend microservice framework and language agnostic.

Cons:

  • Because it’s not actually running in production, the final result may not be an entirely accurate reflection of how the microservice ultimately will perform in production.
  • Because there is no interaction with any production resources or data, it can be tough to create the dummy data needed to accurately reflect all testing scenarios.
  • Adding additional home-grown microservices that have their own dependencies may not be straightforward and may become unwieldy. 
  • As the application and infrastructure grows, running everything locally may become a resource drain on an engineer’s machine.
  • Some LocalStack AWS services do not have 1:1 feature parity with AWS. Additionally, some require a paid subscription.

The bottom line is that this local development approach lets new developers get started faster, keeps the environment consistent, avoids production mishaps, is easy to iterate on, and can be tracked via Git. On the other hand, generating dummy data can be difficult and as the application’s microservice dependency graph grows, individual local machines may be hard-pressed to run everything locally.

Below we detail each element of our approach. If using your own application, sub out your specific implementation details with any related to our application, including such things as Node.js, Typescript, AWS services, and environment variable names.

Clone the example project

Let’s get started by checking out our example project from GitHub. This project has been set up according to the instructions detailed in the rest of this post.

Example project: doordash-oss/local-dev-env-blog-example

In this example, our backend application has been built using TypeScript, Node.js, Express, and TypeORM. You’re not required to use any of these technologies for your own application, of course, and we won’t focus on any specifics related to them.

This example project is based on an application that exposes two REST endpoints — one for creating a note and another for retrieving one.

POST /notes

GET /notes/:noteid

When posting a note, we also send a message to an SQS queue. Currently, nothing is done with these messages in the queue, but in the future we could wire up a consumer for the queue to later asynchronously process the notes.

Install the prerequisite packages to get the example project to start. Note that these instructions are also located in the project README

- Node version >= 16.13 but <17 installed.
 - https://nodejs.org/en/download/
- Docker Desktop installed and running.
 - https://www.docker.com/products/docker-desktop/
- postgresql installed.
 - `brew install postgresql`
- awslocal installed.
 - https://docs.localstack.cloud/integrations/aws-cli/#localstack-aws-cli-awslocal
- Run npm install
 - `npm install`

Set up Docker Compose with your application

Docker Compose is a tool for defining and running multi-container Docker environments. In this case, we will run our application as one container and use a few others to simulate our production environment as accurately as possible.

1. Start by setting up the application to run via Docker Compose. First, create a Dockerfile, which describes how the container should be built.

dockerfiles/Dockerfile-api-dev

FROM public.ecr.aws/docker/library/node:lts-slim


# Create app directory
WORKDIR /home/node/app


# Install app dependencies
# A wildcard is used to ensure both package.json AND package-lock.json are copied
COPY package*.json ./
COPY tsconfig.json ./
COPY src ./src
RUN npm install --frozen-lockfile


# We have to install these dev dependecies as regular dependencies to get hot swapping to work
RUN npm install nodemon ts-node @types/pg


# Bundle app source
COPY . .

This Dockerfile contains steps specific to Node.js. Unless you are also using Node.js and TypeORM, yours will look different. For more information on the Dockerfile spec, you can check out the Docker documentation here.

2. Next, create a docker-compose.yml file and define the application container.

docker-compose.yml

version: '3.8'


services:
 api:
   container_name: example-api
   build:
     context: .
     dockerfile: ./dockerfiles/Dockerfile-api-dev
   ports:
     - '8080:8080'
   volumes:
     - ./src:/home/node/app/src
   environment:
     - NODE_ENV=development
   command: ['npm', 'run', 'dev']

Here we have defined a service called api that will spin up a container named example-api that uses the Dockerfile we previously defined as the image. It exposes port 8080, which is the port our Express server starts on, and mounts the ./src directory to the directory /home/node/app/src. We’re also setting the NODE_ENV environment variable to development and starting the application with the command npm run dev. You can see what npm run dev does specifically by checking out that script in package.json here. In this case, we’re using a package called nodemon which will auto-restart our backend Node.js express application whenever we make a change to any TypeScript file in our src directory, a process that is called hotswapping. This isn’t necessary for your application, but it definitely speeds up the development process.

Set up a locally running database

Most backend microservices wouldn’t be complete without a database layer for persisting data. This next section will walk you through adding a PostgreSQL database locally. While we use PostgreSQL here, many other databases have Docker images available, such as CockroachDB or MySQL.

1. First, we’ll set up a PostgreSQL database to be run and connected to locally via Docker Compose.

Add a new PostgreSQL service to the docker-compose.yml file.

docker-compose.yml

postgres:
   container_name: 'postgres'
   image: public.ecr.aws/docker/library/postgres:14.3-alpine
   environment:
     - POSTGRES_USER=test
     - POSTGRES_PASSWORD=password
     - POSTGRES_DB=example
   ports:
     - '5432:5432'
   volumes:
     - ./db:/var/lib/postgresql/data
   healthcheck:
     test: ['CMD-SHELL', 'pg_isready -U test -d example']
     interval: 5s
     timeout: 5s
     retries: 5

Here we have defined a service and container called postgres. It uses the public PostgreSQL 14.3 image because we don’t need any customization. We’ve specified a few environment variables, namely the user and password needed to connect to the database and the name of the database. We’re exposing the default PostgreSQL port 5432 locally and using a local folder named db for the underlying database data. We’ve also defined a health check that checks that the example database is up and accessible.

Now we can connect our application to it by adding relevant environment variables that match our configured database credentials.

docker-compose.yml

api:
   container_name: example-api
   build:
     context: .
     dockerfile: ./dockerfiles/Dockerfile-api-dev
   ports:
     - '8080:8080'
   depends_on:
     postgres:
       condition: service_healthy
   volumes:
     - ./src:/home/node/app/src
   environment:
     - NODE_ENV=development
     - POSTGRES_USER=test
     - POSTGRES_PASSWORD=password
     - POSTGRES_DATABASE_NAME=example
     - POSTGRES_PORT=5432
     - POSTGRES_HOST=postgres
   command: ['npm', 'run', 'dev']

One interesting thing to note about connections between containers in a Docker Compose environment is that the hostname you use to connect to another container is the container’s name. In this case, because we want to connect to the postgres container, we set the host environment variable to be postgres. We’ve also specified a depends_on section which tells the example-api container to wait to start up until the health check for our postgres container returns successfully. This way our application won’t try to connect to the database before it is up and running.

2. Now we’ll seed the database with some data whenever it starts up.

If you’re testing your application in any way, it’s probably useful to have a local database that always has some data. To ensure a consistent local development experience across docker-compose runs and across different developers, we can add a Docker container which runs arbitrary SQL when docker-compose starts.

To do this, we start by defining a bash script and an SQL file as shown below.

scripts/postgres-seed.sql

-- Add any commands you want to run on DB startup here.
CREATE EXTENSION IF NOT EXISTS "uuid-ossp";


CREATE TABLE IF NOT EXISTS notes (
 id         UUID NOT NULL DEFAULT uuid_generate_v4(),
 contents   varchar(450) NOT NULL,
 created_at TIMESTAMP WITHOUT TIME ZONE DEFAULT now(),
 updated_at TIMESTAMP WITHOUT TIME ZONE DEFAULT now()
);


-- Since data is kept between container restarts, you probably want to delete old inserted data so that you have a known state everytime the the database starts up
DELETE FROM notes;


INSERT INTO notes (id, contents) VALUES ('6a71ff7e-577e-4991-bc70-4745b7fbbb78', 'Look at this lovely note!');

This is just a simple SQL file that creates a database table called “notes” and inserts a note into it. Note the use of IF NOT EXISTS and the DELETE, which ensure that this script will always execute successfully, whether it’s run after the database is first created or multiple times after.

scripts/local-postgres-init.sh

#!/bin/bash


export PGPASSWORD=password; psql -U test -h postgres -d example -f /scripts/postgres-seed.sql

This bash file executes our postgres-seed.sql script against our database.

Next, define the Docker service and container in docker-compose to run the script and the SQL.

docker-compose.yml

postgres-init:
   container_name: postgres-init
   image: public.ecr.aws/docker/library/postgres:14.3-alpine
   volumes:
     - './scripts:/scripts'
   entrypoint: '/bin/bash'
   command: ['/scripts/local-postgres-init.sh']
   depends_on:
     postgres:
       condition: service_healthy

This spins up a container with the name postgres-init that runs our bash script from above. Like our application, it waits to start until our database container itself is up and running.

Speaking of our application, let’s also make sure that it waits for our database to be seeded.

docker-compose.yml

api:
   container_name: example-api
   build:
     context: .
     dockerfile: ./dockerfiles/Dockerfile-api-dev
   ports:
     - '8080:8080'
   depends_on:
     postgres:
       condition: service_healthy
     postgres-init:
       condition: service_completed_successfully
   volumes:
     - ./src:/home/node/app/src
   environment:
     - NODE_ENV=development
     - POSTGRES_USER=test
     - POSTGRES_PASSWORD=password
     - POSTGRES_DATABASE_NAME=example
     - POSTGRES_PORT=5432
     - POSTGRES_HOST=postgres
   command: ['npm', 'run', 'dev']

Set up LocalStack

If you’re taking full advantage of AWS, your local development environment likely wouldn’t be complete without access to the AWS services you rely on — or at least mocks of them. LocalStack lets you run many of your AWS resources locally alongside your application, ensuring test data is always separated from the rest of your team while maintaining an application environment that’s as close to prod as possible.

1. First, set up LocalStack to run with Docker Compose.

Just like our database or application, we define a LocalStack service and container in our docker-compose.yml file. The configuration we’re using is based on the recommended configuration from LocalStack.

docker-compose.yml

localstack:
   container_name: 'localstack'
   image: localstack/localstack
   ports:
     - '4566:4566'
   environment:
     - DOCKER_HOST=unix:///var/run/docker.sock
   volumes:
     - '${TMPDIR:-/tmp}/localstack:/var/lib/localstack'
     - '/var/run/docker.sock:/var/run/docker.sock'

Here we’ve defined a service named localstack with a container named localstack. It uses the publicly available LocalStack image and exposes port 4566, which is the default port LocalStack runs on. Per their config suggestions, we set an environment variable that connects LocalStack to Docker and a couple of volumes, one of which is required for Docker connectivity while the other specifies where LocalStack should store its data.

2. Now that you have LocalStack running alongside your application, we can create some AWS resources with which your application can interact.

This can be done manually by using the LocalStack CLI: 

awslocal s3api create-bucket --bucket my-test-bucket        

awslocal s3api list-buckets
{
    "Buckets": [
        {
            "Name": "my-test-bucket",
            "CreationDate": "2022-12-02T21:53:24.000Z"
        }
    ],
    "Owner": {
        "DisplayName": "webfile",
        "ID": "bcaf1ffd86f41161ca5fb16fd081034f"
    }
}

For more information on commands, see the AWS CLI v1 wiki and the LocalStack docs on AWS service feature coverage. Instead of using aws, you just use awslocal.

Let’s also make sure our application doesn’t try to start up without LocalStack already running.

docker-compose.yml

api:
   container_name: example-api
   build:
     context: .
     dockerfile: ./dockerfiles/Dockerfile-api-dev
   ports:
     - '8080:8080'
   depends_on:
     localstack:
       condition: service_started
     postgres:
       condition: service_healthy
     postgres-init:
       condition: service_completed_successfully
   volumes:
     - ./src:/home/node/app/src
   environment:
     - NODE_ENV=development
     - POSTGRES_USER=test
     - POSTGRES_PASSWORD=password
     - POSTGRES_DATABASE_NAME=example
     - POSTGRES_PORT=5432
     - POSTGRES_HOST=postgres
     - AWS_REGION=us-west-2
     - AWS_ACCESS_KEY_ID=fake
     - AWS_SECRET_ACCESS_KEY=fake
     - SQS_NOTES_QUEUE_URL=http://localstack:4566/000000000000/notes-queue
   command: ['npm', 'run', 'dev']

Stay Informed with Weekly Updates

Subscribe to our Engineering blog to get regular updates on all the coolest projects our team is working on

Set up Terraform

While it’s great to be able to create AWS resources on the fly for your application locally, you probably have some resources you want to start up every single time with your application. Terraform is a good tool to ensure a consistent and reproducible AWS infrastructure.

1. To start, define the infrastructure in Terraform.

We’re going to define our infrastructure in a stock standard .tf file. The only difference is that we need to specify that the AWS endpoint we want to interact with is actually LocalStack. 

Let’s add a queue.

terraform/localstack.tf

provider "aws" {
 region                      = "us-west-2"
 access_key                  = "test"
 secret_key                  = "test"


 skip_credentials_validation = true
 skip_requesting_account_id  = true
 skip_metadata_api_check     = true


 endpoints {
   sqs = "http://localstack:4566"
 }
}


resource "aws_sqs_queue" "queue" {
 name = "notes-queue"
}

Here we’ve set up a very basic Terraform configuration for AWS resources. All the values in the provider section should stay as-is except for the region, which is up to you. Just remember that your application will need to use the same region. You can see we set up an SQS Queue called “notes-queue” and we’ve made sure to set the SQS endpoint to localstack.

2. Continuing the theme of automation via Docker Compose, we can now use Docker to automatically apply our Terraform config on startup.

Let’s create a new Docker-based service+container in our docker-compose.yml file with a Dockerfile that installs Terraform and the AWS CLI, and then runs Terraform to create our resources. Yes, you heard that correctly. This container is going to run Docker itself (Docker-ception!). More on that in a second.

First, we need our Dockerfile. Looks complicated but it just involves these straightforward steps.

  1. Install required prerequisites.
  2. Install AWS CLI.
  3. Install Terraform.
  4. Copy our local script, which runs Terraform, onto the container image.
  5. Have the image run our Terraform script when the container starts up.

dockerfiles/Dockerfile-localstack-terraform-provision

FROM docker:20.10.10


RUN apk update && \
   apk upgrade && \
   apk add --no-cache bash wget unzip


# Install AWS CLI
RUN echo -e 'http://dl-cdn.alpinelinux.org/alpine/edge/main\nhttp://dl-cdn.alpinelinux.org/alpine/edge/community\nhttp://dl-cdn.alpinelinux.org/alpine/edge/testing' > /etc/apk/repositories && \
   wget "s3.amazonaws.com/aws-cli/awscli-bundle.zip" -O "awscli-bundle.zip" && \
   unzip awscli-bundle.zip && \
   apk add --update groff less python3 curl && \
   ln -s /usr/bin/python3 /usr/bin/python && \
   rm /var/cache/apk/* && \
   ./awscli-bundle/install -i /usr/local/aws -b /usr/local/bin/aws && \
   rm awscli-bundle.zip && \
   rm -rf awscli-bundle


# Install Terraform
RUN wget https://releases.hashicorp.com/terraform/1.1.3/terraform_1.1.3_linux_amd64.zip \
 && unzip terraform_1.1.3_linux_amd64 \
 && mv terraform /usr/local/bin/terraform \
 && chmod +x /usr/local/bin/terraform


RUN mkdir -p /terraform
WORKDIR /terraform


COPY scripts/localstack-terraform-provision.sh /localstack-terraform-provision.sh


CMD ["/bin/bash", "/localstack-terraform-provision.sh"]

Now we have to set up the corresponding Docker Compose service and container.

docker.compose.yml

localstack-terraform-provision:
   build:
     context: .
     dockerfile: ./dockerfiles/Dockerfile-localstack-terraform-provision
   volumes:
     - /var/run/docker.sock:/var/run/docker.sock
     - ./terraform:/terraform
     - ./scripts:/scripts

This points to that Dockerfile we just created and makes sure the container has access to the running instance of Docker, as well as the Terraform and scripts directories.

Next, we need to create the aforementioned shell script.

scripts/localstack-terraform-provision.sh

#!/bin/bash


(docker events --filter 'event=create'  --filter 'event=start' --filter 'type=container' --filter 'container=localstack' --format '{{.Actor.Attributes.name}} {{.Status}}' &) | while read event_info


do
   event_infos=($event_info)
   container_name=${event_infos[0]}
   event=${event_infos[1]}


   echo "$container_name: status = ${event}"


   if [[ $event == "start" ]]; then
       sleep 10 # give localstack some time to start
       terraform init
       terraform apply --auto-approve
       echo "The terraform configuration has been applied."
       pkill -f "docker event.*"
   fi
done

This script first runs a Docker CLI command that waits until it sees a Docker event, indicating that the LocalStack container has started up successfully. We do this so that we don’t try to run Terraform without having LocalStack accessible. You can imagine how it might be hard to create an SQS queue if SQS for all intents and purposes didn’t exist.

It may be a confusing move, but we’re also going to make sure our localstack container waits for our localstack-terraform-provision container to start up. This way we guarantee that the localstack-terraform-provision container is up and watching for LocalStack to be up before LocalStack itself tries to start. If we don’t do this, it’s possible that our localstack-terraform-provision container would miss the start event from our localstack container.

docker.compose.yml

localstack:
   container_name: 'localstack'
   image: localstack/localstack
   ports:
     - '4566:4566'
   environment:
     - DOCKER_HOST=unix:///var/run/docker.sock
   volumes:
     - '${TMPDIR:-/tmp}/localstack:/var/lib/localstack'
     - '/var/run/docker.sock:/var/run/docker.sock'
   Depends_on:
     # We wait for localstack-terraform-provision container to start
     # so that it can watch for this localstack container to be ready
     - localstack-terraform-provision

Finally, we make sure our application doesn’t start until we’ve finished executing our Terraform.

docker-compose.yml

api:
   container_name: example-api
   build:
     context: .
     dockerfile: ./dockerfiles/Dockerfile-api-dev
   ports:
     - '8080:8080'
   depends_on:
     localstack:
       condition: service_started
     localstack-terraform-provision:
       condition: service_completed_successfully
     postgres:
       condition: service_healthy
     postgres-init:
       condition: service_completed_successfully
   volumes:
     - ./src:/home/node/app/src
   environment:
     - NODE_ENV=development
     - POSTGRES_USER=test
     - POSTGRES_PASSWORD=password
     - POSTGRES_DATABASE_NAME=example
     - POSTGRES_PORT=5432
     - POSTGRES_HOST=postgres
     - AWS_REGION=us-west-2
     - AWS_ACCESS_KEY_ID=fake
     - AWS_SECRET_ACCESS_KEY=fake
     - SQS_NOTES_QUEUE_URL=http://localstack:4566/000000000000/notes-queue
   command: ['npm', 'run', 'dev']

Starting up your local development environment 

If you’ve followed along and have your application set up accordingly, or you’re just playing around with our example project, you should be ready to start everything up and watch the magic!

To start up Docker Compose, just run docker-compose up.

You should see that all required images are downloaded, containers created and started, and everything running in the startup order we’ve defined via depends_on. Finally, you should see your application become available. In our case with the example project, this looks like

example-api                 | Running on http://0.0.0.0:8080

There will be a folder called db created with some files inside of it; this is essentially your running database. You’ll also see some more files in your Terraform folder. These are the files Terraform uses to understand the state of your AWS resources.

We’ll have a database running that is seeded with some data. In our case, we added a table called notes and a note. You can verify this locally by using a tool like psql to connect to your database and query it like this:

export PGPASSWORD=password; psql -U test -h localhost -d example

select * from notes;

                  id                  |         contents          |         created_at         |         updated_at
--------------------------------------+---------------------------+----------------------------+----------------------------
 6a71ff7e-577e-4991-bc70-4745b7fbbb78 | Look at this lovely note! | 2022-12-02 17:08:36.243954 | 2022-12-02 17:08:36.243954

Note that we’re using a host of localhost and not postgres as we would use within our docker-compose environment.

Now try calling the application.

curl -H "Content-Type: application/json" \
  -d '{"contents":"This is my test note!"}' \
  "http://127.0.0.1:8080/notes"

If we check back in our database, we should see that that note should have been created.

id                  |         contents          |         created_at         |         updated_at

--------------------------------------+---------------------------+----------------------------+----------------------------

 6a71ff7e-577e-4991-bc70-4745b7fbbb78 | Look at this lovely note! | 2022-12-05 16:59:03.108637 | 2022-12-05 16:59:03.108637

 a223103a-bb24-491b-b3c6-8690bc852ec9 | This is my test note!     | 2022-12-05 17:26:33.845654 | 2022-12-05 17:26:33.845654

We can also inspect the SQS queue to see that a corresponding message is waiting to be processed.

awslocal sqs receive-message --region us-west-2 --queue-url \
  http://localstack:4566/000000000000/notes-queue

{
    "Messages": [
        {
            "MessageId": "0917d626-a85b-4772-b6fe-49babddeca76",
            "ReceiptHandle": "NjA5OWUwOTktODMxNC00YjhjLWJkM",
            "MD5OfBody": "73757bf6dfcc3980d48acbbb7be3d780",
            "Body": "{\"id\":\"a223103a-bb24-491b-b3c6-8690bc852ec9\",\"contents\":\"This is my test note!\"}"
        }
    ]
}

Note that the default localstack AWS account id is 000000000000.

Finally, we can also call our GET endpoint to fetch this note.

curl -H "Content-Type: application/json" "http://127.0.0.1:8080/notes/a223103a-bb24-491b-b3c6-8690bc852ec9"


{
  "id":"a223103a-bb24-491b-b3c6-8690bc852ec9",
  "contents":"This is my test note!",
  "createdAt":"2022-12-05T17:26:33.845Z",
  "updatedAt":"2022-12-05T17:26:33.845Z"
}

Conclusion

When developing cloud software as a part of a team, it is often not practical or convenient for each person to have a dedicated cloud environment for local development testing purposes. Teams would need to keep all of their personal cloud infrastructure in sync with the production cloud infrastructure, making it easy for things to become stale and/or drift. It is also not practical to share the same dedicated cloud environment for local development testing because changes being tested may conflict and cause unexpected behavior. At the same time, you want the local development environment to be as close to production as possible. Developing on production itself can be slow, is not always feasible given possible data sensitivity concerns, and can also be tricky to set up in a safe manner. These are all tough requirements to fuse together.

Ideally, if you’ve followed along with this guide, you’ll now have an application with a local development environment that solves these requirements — no matter the backend application language or microservice framework! While this is mostly tailored to Postgres, it’s possible to wire this up with any other database technology that can be run as a Docker container. We hope this guide helps you and your team members to iterate quickly and confidently on your product without stepping on each other’s toes.

As DoorDash made the move from made-to-order restaurant delivery into the Convenience and Grocery (CnG) business, we had to find a way to manage an online inventory per merchant per store that went from tens of items to tens of thousands of items. Having multiple CnG merchants on the platform means constantly refreshing their offerings, a huge inventory management problem that would need to be operated at scale. To solve this scaling problem our team built a write-heavy inventory platform that would be able to keep up with all the changes on the platform. 

Before we dive in, let’s define some important terminology. In simple terms, “inventory” refers to the list of items present in a specific store of a Convenience and Grocery (CnG) merchant. This list also comes with store-specific information, most importantly price and availability. Along with inventory, “catalog” refers to the information about an item that is typically common across all stores of a business. The combined information from inventory and catalog make up the view that customers see when they land on a store page on doordash.com. 

This article outlines the challenges we faced while building the inventory platform and how we solved them after multiple iterations of experimentation and analysis.

Note: A few months back, our peers at the DashMart engineering team released an article elaborating on how they used CockroachDB changefeed to support real-time inventory changes. Organizationally, the DashMart team currently operates on a slightly different architecture than the rest of the CnG platform. While that team focused more on a specific aspect of inventory (real-time change propagation), we will focus on general pitfalls and how to circumvent them while building a write-heavy inventory ingestion platform.  Additionally, the Fulfillment engineering team recently released this article about how they use the CockroachDB to scale their system. We also got similar benefits by using the CockroachDB in our system. 
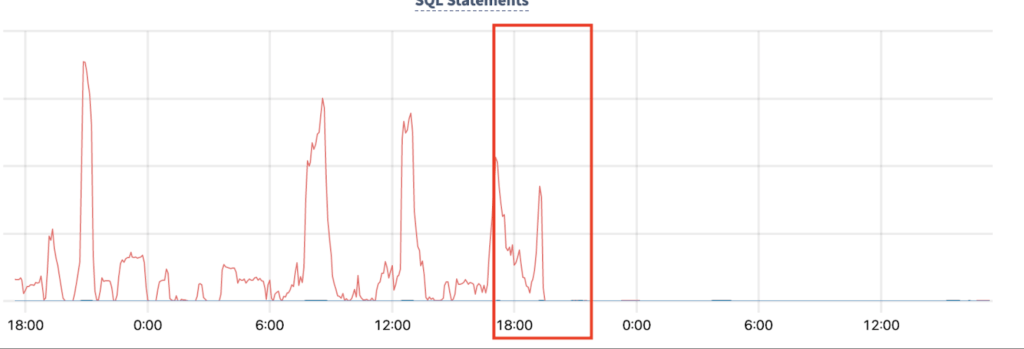
The challenges associated with supporting CnG inventory management 

DoorDash refreshes the inventory of CnG merchants multiple times a day in three different ways: 

  • updates are done automatically by ingesting flat inventory files received from the merchant 
  • our Operations team loads the inventory data through internal tools
  • the inventory is updated via signals from the Dasher app used by a Dasher shopping at a CnG store

Since the number of CnG stores is in the higher tens of thousands, and each store may contain tens of thousands of items, refreshing could involve more than a billion items in a day.  To support these operations we built an inventory platform to process these items in a reliable, scalable, and fault-tolerant way. This system would ensure that we could provide an accurate and fresh view of all sellable items in stores to our customers.

The technical requirements of our ideal inventory platform 

Any inventory platform has to fulfill a number of requirements: it needs to process a very high volume of items per day to provide a fresh view of the in-store inventory of a merchant. We need to satisfy the following technical requirements: 

  • High Scalability
    • As our business grows, the inventory platform needs to support more items that are added to the system
    • Frequent updates need to be supported so that inventory freshness is maintained 
  • High Reliability
    • Our pipeline should be reliable, so that all of the valid inventory update requests from merchants should eventually be processed successfully
  • Low Latency
    • The item data is time-sensitive, especially the price and availability attributes. So we need to make sure we process all of the merchant’s items with a reasonable latency. The gap between receiving data from the merchant and displaying data to the customer should be as small as possible.
  • High Observability
    • Internal operators should be able to see the detailed and historical item-level information in the inventory management system.
    • The pipeline should have lots of validations and guardrails. Not all of the merchant-provided items can be shown to the customer and the system should be able to answer why an item provided by the merchant is not being displayed to the customer.

Functional architecture 

To begin the technical discussion we will start with the high-level architecture of our inventory ingestion pipeline, outlining the flow and transformation of inventory data. Then we will review the primary components in the following sections.

Figure 1 shows a high-level design of our inventory ingestion pipeline, which is an asynchronous system ingesting inventory from multiple different sources, processing them, and passing them to downstream systems where the view is served to customer-facing entities.

Figure 1: High-level design of inventory ingestion pipeline

API controller

Our gRPC-based API controller acts as the entry point of inventory data to the platform, and is responsible for receiving and validating inventory signals from multiple sources: merchants, internal operators, Dashers, etc.

Raw feed persistence

Most of the inventory processing after the API controller is asynchronous and is executed via Cadence workflows. We store the raw input received from a merchant in order to serve subsequent read use cases for other workflows (for example, Self-Serve Inventory Manager is a merchant-facing tool providing real-time inventory information to the merchants which is obtained from the persisted raw feed). It also helps in observability and troubleshooting when unexpected data surfaces in customer views.

Hydration 

As mentioned earlier, the detailed view of a store item involves both inventory and catalog attributes. The inventory ingestion pipeline at DoorDash is responsible for hydrating (i.e. enriching) raw inventory information with catalog attributes. We fetch these attributes from a service that an independent sister team maintains. 

Price calculation

Similar to hydration, we also rely on external configuration fetched from a dependent service to perform per-item price calculation as and when required. For example, the price of a weighted item such as a bunch of bananas or a bag of potatoes is derived from its unit price and average weight.

Out-of-stock predictive classification

Serving an accurate availability status for a store item is a hard problem as Merchant inputs are not always the most accurate, nor very frequent. Availability signals from Dashers when they do not find items in a store bridge the gap, but not completely. We eventually implemented a predictive model which learns from historical order and INF (item-not-found) data and classifies whether an item can be available in-store or not. This classifier also acts as an important component of the ingestion pipeline. 

Guardrails

No pipeline is without errors caused due to code bugs in their own systems and/or issues in upstream systems. For example, there could be an issue with an upstream module that is responsible for standardizing inventory input for a merchant before pushing them to our inventory platform; this could result in incorrect over-inflated or under-inflated prices. These errors are significant as they have a direct customer impact. For example, a bunch of bananas can show up as $300 instead of $3.00 in the customer app due to price conversion bugs in the pipeline. To protect against such price surges, the inventory platform needs to establish best-effort guardrails (and alerting mechanisms) which can detect and restrict updates when certain conditions are met. 

Observability

The inventory platform executes the inventory ingestion pipeline for tens of thousands of convenience and grocery stores, each having tens of thousands of items in them. It is very important to have full visibility into this pipeline at an item level as well as a store level (aggregated statistics). We need to know if an item was dropped due to some error in the pipeline, as that directly relates to the item not being available on the store page. The observability options that the inventory platform offers help business and product personnel monitor the inventory status for each merchant, as well as calculate business OKRs:

  • Item-level processing details are passed on to a Kafka layer which is read by a Flink job and populated in Snowflake (which can be queried separately) 
  • Store-level details are aggregated and persisted in one of our Cockroach DB prod tables directly from the pipeline 
  • Input and output payloads to and from the pipeline are stored in S3 for troubleshooting purposes

Reliability 

Because of the extensive amount of computations and dependent services, our inventory pipeline needs to be asynchronous. Cadence is a fault-oblivious & stateful workflow orchestrator that satisfies this responsibility for us. We execute a lot of our business logic in long-running Cadence jobs. Thankfully, Cadence provides us with reliability and durability characteristics out of the box. 

  1. Retry: Cadence has the capability to automatically retry a job if it fails abruptly. It also provides good control over the retry mechanism with the ability to set the maximum number of attempts.
  2. Heartbeat: We also send heartbeats from our worker to the orchestrating Cadence server to indicate the alive-ness of our job. This is a capability that comes bundled with Cadence itself.

These durability characteristics using Cadence enable the platform to be more reliable and fault-tolerant. 

Incremental changes to the solution after the MVP 

Our MVP was focused on doing as much as necessary to get the functional architecture up and running, i.e. we were initially more focused on functional correctness than scalability. When updating our MVP to the next iteration, we made incremental improvements as we gradually rolled out more merchants onto our system and/or identified performance bottlenecks in the evolving system. Let’s go over a few of those incremental changes. 

Change item-level API to batch API 

Initially, our goal was to build an item-based system through and through. For the MVP version (shown in Figure 2), we built an item-level API, and to create/update one item, the caller needs to call our API once. If a store has N items, the caller will need to call the API N times, which can happen in parallel. But when we need to update the serving source (aka Menu Service) for a big merchant, which could have tens of thousands of stores with each store potentially selling tens of thousands of items, the throughput may become too high to handle. We could have scaled up by adding more resources but we thought about this differently. 

Figure 2: The first iteration of inventory platform with item-level API

Let’s think about the use case again: when we update one store, the caller already knows the complete list of items and they could simply send us the complete list of items in one API call. The most common use case would make it possible to batch the items and send them to our service within one request so our service will take much fewer API requests. Our service could save the payload in S3 and consume it asynchronously through a Cadence job.

Of course, it is important to note that we wouldn’t want to increase the batch size indefinitely because of network bandwidth limitations as well as durability concerns. So we have to find the right balance between sending enough data in a batch but also not too much. 

Figure 3: Inventory platform with item-level API gets changed to a batch API

After making it a batch API (shown in Figure 3), we observed improvements in the processing speed, but it was still far from what we desired. 

Database table optimization

As we added more metrics on each step, we found the database access to be a significant bottleneck. We use CockroachDB which is a distributed SQL database and is widely used across DoorDash. After more investigation and discussion with our internal storage team, we took the following actions to optimize our database: 

Choose a natural primary key instead of auto-incrementing a primary key

The tables that we were working with had been created some time ago with an artificial primary key which auto-increments. This primary key had no relation to DoorDash’s business parameters. One could argue that such a key makes sense for some use cases, but looking at our query and insert/update patterns, we realized that we can reduce the load by changing the primary key to be a combined primary key naturally constructed from business parameters. Using a natural composite key helped us reduce columns and query more efficiently because all our queries are mostly centered around those business parameters. A discussion about primary key best practices for CockroachDB can be found in this documentation.

Cleanup DB indexes 

  • Add missing indexes for all the queries. Over time we had added new columns, and with the fast pace of development, we had missed adding indexes that were necessary for the types of queries we were making. We carefully gathered all our queries and added the missing DB indexes.
  • Remove unnecessary indexes. We had changed parts of our implementation with time and hadn’t removed the unused indexes. Also, our natural primary key was combined and constructed from a few different fields and we did not need indexes for each of them separately, as the combined index also serves the case for querying one or more of the columns in the combined index. For example, if there is already an index for columns (A, B, C), we don’t need a separate index for querying with (A, B). Note that we would need an index for (B, C), however. 

Reduce the column count

Our table originally had around 40 columns and all of the columns can be updated at the same time for most cases. So we decided to put some of the frequently updated columns into one single JSONB column. There are pros and cons to keeping them separate vs putting them together. For our use case of simple text and integer attributes merged into a JSON, it works just fine. 

Configure time-to-live for fast-growing tables

In order to keep the database volume and subsequent query load in check, we finalized a few high-intensity-write tables which do not need to have data for too long and added TTL (time-to-live) configurations for those in CockroachDB. 

These database optimizations improved the system significantly, but we weren’t quite there yet.

DB and dependency retrieval logic modified to be store-level from item-level

To update one item, we will need to fetch a lot of information from the store level and the item level, such as the store-level inflation rate and the item-level catalog data. We could choose to fetch that information on demand as we are processing each item. Or, before we start processing, we could fetch all the necessary store-/item-level information in batch (shown in Figure 4), and pass it to each individual item to process. By doing so, we would save a lot of QPS for downstream services and databases, and improve performance for our systems as well as theirs.

Figure 4: The inventory processing flow with dependencies moved to the store level

Stay Informed with Weekly Updates

Subscribe to our Engineering blog to get regular updates on all the coolest projects our team is working on

Batch the DB upsert within one request to CockroachDB

Every time we finished item-level processing, we saved the result to the database by using a single item upsert – this caused very high QPS in the database. After discussing with our storage team, it was suggested that we batch the SQL requests. So we adjusted the architecture: after each item processing is complete, we collect the result and keep it in the memory of the processor. Then we aggregate the queries with 1,000 per batch and send the batch within one SQL request (shown in Figure 5). 

Figure 5: The inventory processing flow with aggregated write queries
Before the batch query

Request 1 

USPERT INTO table_name (column1, column2, column3, …)VALUES (value11, value12, value13, …);

Request 2 

USPERT INTO table_name (column1, column2, column3, …)VALUES (value21, value22, value23, …);

Request 3

USPERT INTO table_name (column1, column2, column3, …)VALUES (value31, value32, value33, …);
After the batch query

Request 1

UPSERT INTO table_name (column1, column2, column3, …)
VALUES (value11, value12, value13, …);
UPSERT INTO table_name (column1, column2, column3, …)
VALUES (value21, value22, value23, …);
UPSERT INTO table_name (column1, column2, column3, …)
VALUES (value31, value32, value33, …);

After the above change, we observed that the DB request QPS dropped significantly, and we were getting closer to a desirable outcome. 

Rewrite the batch upsert from multiple queries to one query 

After a few months, we onboarded more and more merchants to this new system, and we observed the database hardware resource consumption increased significantly. We did investigate further and it was suggested that we rewrite the batch queries. We are using JDBI as our interfacing layer with the DB, and we had incorrectly assumed that providing the @SqlBatch annotation would automatically give us the best performance.

Before the query rewrite

Previously we batched the queries by using a JDBI built-in batch function, and that function batched the queries by adding them line by line but didn’t rewrite the queries into one query. This reduced the number of connections needed by the service to write to the DB, but on reaching the DB layer, the queries were still item-level.

UPSERT INTO table_name VALUES (v11, v12, v13,…v1n);UPSERT INTO table_name VALUES (v21, v22, v23,…v2n);UPSERT INTO table_name VALUES (v31, v32, v33,…v3n);…UPSERT INTO table_name VALUES (vm1, vm2, vm3,…vmn);
After the query rewrite

Now we are customizing the rewrite logic to merge those upsert queries into one query and CockroachDB only needs to execute one query to upsert all of those values. 

UPSERT INTO table_name VALUES (v11, v12, v13,…v1n), (v21, v22, v23,…v2n), (v31, v32, v33,…v3n), (v41, v42, v43,…v4n), (v51, v52, v53,…v5n);

After the query rewrite change, we observed our service performance improved significantly at application layer and storage layer 

  • The per item processing time reduced by 75% (shown in Figure 6)
  • The storage QPS dropped by 99% (shown in Figure 7)
  • The storage CPU utilization dropped by 50% (shown in Figure 8)
Figure 6: Per item processing time dropped right after the query rewrite enabled
Figure 7: QPS dropped 99% due to the query rewrite
Figure 8: CPU utilization dropped 50% in the same cluster due to the query rewrite

Conclusion

Building and scaling a digital inventory is difficult as the data size of digital inventory could be gigantic, and at the same time it needs to be accurate to provide the correct in-store view of inventory. Also, it is time-sensitive because we need to show the correct price and availability of an item to the customer as soon as we get that information from the merchant. We learned a lot about how to maintain such a write-heavy, scalable, and reliable system, which could be applied to similar problems in other domains. We would like to point out a few key takeaways. 

At the beginning of the implementation, put effort into creating an exhaustive metrics dashboard, so when performance issues arise, it is easy to narrow down the bottleneck of the system. In general, having high visibility into the real-time system from the start can be very useful.

Save data in a way that can help the read-and-write pattern. Inventory data may not be a flattened list of data–they may have a certain level of hierarchy. They could be saved as item-level or store-level, it is all about determining the read-and-write pattern for the service. In our serving layer, we store the menu as a tree because we frequently read at a menu level, while in the ingestion layer, we store them as item based because of the frequent item-level writing. 

Batch whenever possible in API and DB. Most of the time, when we update inventory, we would update a whole store’s or geolocation’s inventory. Either way, there are multiple items to update, so it’s best to try to batch the update instead of updating single items for each request or query. 

If the business unit allows asynchronous processing, make computations asynchronous and establish a strong SLA for job time per unit (i.e. store or item). Time for single-item processing includes time spent in network communication, which adds up when there are potentially billions of items to process. Instead, if we send the entire store’s inventory via one request, and on the server side use a blob storage to save the request payload, and process it asynchronously, then the client side can save the waiting time and the service can have high throughput. On this note, also establish the idea that content will be updated  in near-real time instead of real-time. Cadence is a good tool for processing near-real-time jobs and has many built-in features to improve system reliability and efficiency.

Follow best practices for the applicable DB–each database will provide best practices guidance on the performance, such as CockroachDB performance best practice. Reading these carefully can help us determine the anti-patterns in the services.

Make sure to keep indexes simple and concise based on the relevant queries–no more, no less.

Building an ML-powered delivery platform like DoorDash is a complex undertaking. It involves collaboration across numerous organizations and cross-functional teams. When this process works well, it can be an amazing experience to work on a product development team, ship ML models to production, and make them 1% better every day. 

The process usually starts with first identifying a product that we could improve by using Machine Learning. Once we identify an opportunity, we usually start small by testing the ML hypothesis using a heuristic before deciding to invest into building out the ML models. If the initial heuristic works, we build out and replace the heuristic with the ML models. This step is usually then followed by building out more tooling and infrastructure so that we can continue to experiment with different ML models and keep making the models 1% better.

In this post, we will outline all of the thought and work that goes into achieving that end product. As an example, we dive into how we decided to optimize when the restaurants should start preparing orders  and when the Dasher should be dispatched to pick them up.

Scoping out the business problem: optimizing food prep times 

Before our ML development journey starts we have to scope out the business problem and try to identify an opportunity for improvement. While different teams are focused on different aspects of our three-sided marketplace, we often create collaborations to solve joint business problems. 

One example is around delayed food prep times that increase Dasher wait times. Long Dasher wait times are a negative experience because it’s time Dashers could otherwise be using productively to maximize their earnings, and merchants may not want Dashers waiting for orders to be ready in a possibly small foyer. On the flip side, we don’t want premature food prep times which could increase “food wait time,” the time prepared food is sitting on the counter getting cold before the Dasher arrives to pick it up. 

In order to achieve an optimal meal prep time and optimal Dasher wait time, we rely on both internal and external systems and operations. We aim to time the Dasher’s arrival at the store with the food ready time. In most cases, we rely on the restaurants to start preparing the food ahead of the Dasher’s arrival. Different restaurants start preparing food at different times – sometimes due to other pending orders, sometimes due to higher sensitivity to food waiting on the counter. In some cases, restaurants may wait for the Dasher’s arrival to prepare the food, which may cause higher wait times for the Dashers. With this high-level business problem the next step is to dig into the details and figure out exactly what’s going on so we can find an opportunity to optimize. 

When do restaurants start preparing food?

Usually, restaurants start preparing an order once it’s been confirmed (see Figure 1). At the same time, right after the order is confirmed by the merchant, we kickstart the matching and dispatch process. Once a Dasher accepts the order, they will be en route and notified when the order is ready for pickup.

Figure 1: aligning the Dasher dispatch with the restaurant’s food prep time

One of the examples where we adjust our decisions and algorithms to the unique needs of our merchants is in the case of “quick service restaurants” – restaurants that generally require very low food preparation times and are more sensitive to food wait times. Merchants at these types of restaurants used to begin preparing these orders only when the Dasher arrived, to ensure the quality of the food upon delivery. This resulted in higher Dasher wait times and longer delivery times and led us to develop the Auto Order Release (AOR) process. 

Auto Order Release (AOR)

We mentioned earlier that in a traditional dispatch flow the restaurants start preparing the food as soon as they confirm the order. In the AOR flow, the merchants confirm the order, but the order is held from being released to the kitchen (Figure 2). The order will be automatically released to the kitchen only when a Dasher is at a certain distance from the store. This distance is determined using geolocation indicators and is called the “release distance.” When the Dasher enters this predefined geofence, the order is released to the kitchen so they can start preparing the food.  

In order for a merchant to be onboarded on this flow, they will work directly with our merchant teams. Once the merchant is onboarded, our merchant and analytics teams will work to define which stores should be defined as AOR stores, and what the release distance should be for each store. When a store is onboarded with AOR, all of its deliveries are placed on a delayed release.

Figure 2: the food prep time starts when the Dasher is in close proximity to the store

Delving into the Dasher wait-time problem: 

Introducing AOR reduced Dasher wait times and delivery times compared to the earlier state where restaurants were waiting on the Dashers to arrive first since the restaurants started preparing the food a bit earlier. While this flow still protected the food quality, it did introduce some new business challenges over time:

  • The delayed release setting is defined on a store level. This offers very little flexibility and caps our ability to optimize wait times
  • The merchant efficiency teams started noticing that more and more merchants were notifying us about Dashers waiting at stores
  • Continuous data exploration identified that we are far from optimizing the time the Dashers spent waiting on orders to be prepared. The actual variance in food preparation and Dasher arrival times was not represented well enough when relying only on hardcoded geofences
  • Adding new merchants to AOR became challenging to scale since it required manually defining geofences for each store

Building a strategy and a team

We saw an opportunity to update the AOR flow from a hard-coded heuristic based flow to a more dynamic decision-making system to optimize Dasher wait times at the store without degrading the food quality. This kind of task is hard to achieve without cross-functional collaboration. It requires updating our assignment system and upstream services, as well as maintaining a deep understanding of the merchant’s operation and experience. 

We formed a formal cross-functional working group consisting of Strategy and Operations, Data Science & Machine Learning, Product, Analytics, and Engineering. Our end goal was to develop a feature that dynamically decides on the optimal order release time for each delivery and reduces Dasher wait times without increasing food wait times. 

Defining milestones through collaboration and iteration

While our goal was to launch a new ML-based feature, to align with our “dream big, start small” mentality we had to define very well-scoped milestones and steps and divide responsibilities efficiently. We wanted to balance reaching faster short-term results and maintaining our long-term vision. To achieve that, we agreed on these high-level milestones:

MVP: heuristics-based

Starting with a simple set of conditions allows us to first implement a simple approach that we believe can perform better in production than our current solution. The MVP is driven mostly by our strategy and analytics team, and we relied on engineering to make the needed architectural updates.

  1. Add the infrastructure ability to decide for each order if:
  • The order should be instantly released to the kitchen (traditional flow)
  • The order should be placed on a delayed release (original AOR flow)
  1. Define and test an initial set of heuristics to decide on the order release type 

Final feature: ML-based 

  1. Develop an ML model to estimate the time needed for AOR merchants to prepare food
  2. Update our architecture to call ML models to decide if an order should be placed on a delayed release or an instant release
  3. Use ML models to define the optimal geofence 

Let’s go through a few of the main milestones to understand what our main considerations were at each step.  

Stay Informed with Weekly Updates

Subscribe to our Engineering blog to get regular updates on all the coolest projects our team is working on

New feature, starting simple

Our starting point was a flow that’s hard coded on a store level. So if a store was put on AOR, we couldn’t change the release strategy for an order even if we had indicators that the store needs more time to prepare the food. The first thing that we had to do was to change the architecture and add the ability to dynamically decide for each delivery, if the order should be placed on a delayed release (regular AOR) or released to the kitchen immediately (if we anticipate the store needing more time to prepare the food). 

To get started, we defined a new set of simple conditions (heuristics) to trigger the decision for each order. For example, we know that larger orders at certain times require longer to prepare. This way, even if a store is placed on AOR, if we believe that the required prep time will be longer than a threshold, releasing the food immediately will allow more time and therefore reduce Dasher wait times. Our analytics and merchant teams identified some stores with high Dasher wait times and partnered with some merchants to launch an experiment to examine if we can lower Dasher wait times without degrading any of our core food quality metrics. Once the MVP was ready, we were able to start experimenting in production. 

Launching experiments as soon as possible

Kickstarting experimentation as soon as possible enables us to start gathering insights and keep the development going at the same time. Incorporating ML required additional development, both on the architectural and research side (we need to connect to more services to make calls to get our ML predictions and we need to develop and add new models to our training and prediction pipelines). Taking this simple, heuristics-based approach first allowed us to start gathering insights and answering questions such as: 

  • Does the feature work in the production environment as expected?
  • Are merchants following the new process as expected?
  • Can we observe the anticipated dasher wait time reduction in the production environment? Are there any unknowns that we did not account for? 

In our case, we immediately saw a reduction in the wait times that the Dashers were experiencing. Adding the ability to decide on a release strategy for each delivery vs. on a store level resulted in higher prep time orders being released earlier, giving merchants more time to prepare food. This bias for action paid off, and when concluding this experiment, we already had: 

  • A working, simple MVP that can be shipped in production (the result of our initial experiments)

Also, since we used the time we ran the experiment to keep developing a more dynamic solution we were also ready with:

  • A testable system that can connect to multiple services to get real-time predictions 
  • A set of ML models that are good candidates to replace our initial heuristics

And beyond the technical progress, getting the MVP out as soon as possible got us:

  • Improvement in our core metrics
  • Buy-in from stakeholders that gained us more time to incorporate ML models into our feature

Adding an ML layer to better optimize Dasher wait times

Once we have established our MVP and shipped it in production, we started gradually introducing more complexity and sophistication into our system. 

Building a set of new predictors

In order to decide when to release an order to the kitchen, we developed a set of new predictors to estimate the time needed for the restaurant to prepare the food against the time needed for a Dasher to arrive at the restaurant and pick up the food. We relied on a few existing models to estimate the Dasher arrival time. While we already have various prep time models, we had to develop a new predictor for the AOR purpose since there are a few unique features in this case that were not captured in the general marketplace models. We used a LightGBM model that reached both great performance offline and proved to work and scale well in similar use cases at DoorDash.  

Evaluating the models’ performance against business metrics

One of the main challenges of selecting the best model offline is the limited predictability of the business metric impact. Our core model predicts the food preparation time and the product goals were reducing the Dasher wait times without degrading the end-to-end delivery time and without increasing food wait times. Moving quickly to experiments helped us determine how to tune our loss function to capture these unique business requirements. One of the great advantages of using LightGBM was the ease of adjusting the loss function to bias and tuning the model’s performance to our unique business needs.

Through the finish line

After a few months of work, we have reached the majority of our original plan – a new feature that leverages ML models to dynamically decide when an order should be released to the kitchen. We had a few more hypotheses we wanted to test and a goal of leveraging the above architecture and models to dynamically define the optimal release distance for each order that was placed on a delayed release. One of the surprising challenges was defining when our work is complete and when we move to a different type of development life cycle – continued maintenance and monitoring. We decided to scope some additional work to test a new Dasher speed estimation model. This new model improved our accuracy and provided another incremental win to wrap up our development work.  

Conclusion

In this post we described how we applied a few important practices to design and ship a new feature; start simple, break it down into milestones and work iteratively. While these are relatively common practices, there are a few unique work characteristics here at DoorDash that enabled our success: 

  • Strong bias for action: it might be difficult to define what ‘good enough’ actually means and not be paralyzed by all the different ways we can make something better. We are a very experimentation-oriented team and we encourage each other to ship as soon as we can make a positive impact
  • We operate in a unique way that allows us to construct teams around great ideas to see them mature and ship them in production. This team was constructed from the bottom up — solid analysis and cross functional collaborations led us to build a formal team
  • Providing incremental results was the fuel that we needed to get time and buy-in to reach our longer term goal. Building ML infrastructure and developing models that can perform in production takes time and can be a risk. We constantly maintain some balance between these short term and long term bets
  • Building out the necessary tooling to support the feature as it grows – operations tooling for easily onboarding stores, tooling for faster debugging, and frameworks for rapid experimentation

We hope these steps and approach can pave a path for others who are facing similar challenges and sheds some light around ML development at DoorDash.