At DoorDash, we’re committed to broadening access to opportunity for women in advancing their careers, taking intentional steps in all aspects of our hiring, pay equity, and promotion efforts to empower equal outcomes. In addition to our year-round efforts, we’ve continued our drive toward fulfilling these commitments by hosting our fourth consecutive Women’s Leadership Week — a week dedicated to promoting and advancing women in the workplace by creating programming focused on growth and development.
This year, we hosted a blended hybrid experience, featuring in-person and virtual opportunities to learn, connect with other leaders, and most importantly, G.R.O.W. (Grow and Recognize Our Women)!
To kick off Women’s Leadership Week, our CEO, Tony Xu, hosted a fireside chat with Catherine Engelbert, an industry pioneer who serves as the Commissioner of the Women’s National Basketball Association (WNBA) and who previously served as Deloitte’s first woman CEO about all things career growth, imposter syndrome, and what it means to be a leader.
Our Chief Restaurant Advisor and the CEO of Slutty Vegan, Pinky Cole joined our very own Anuja Perkins, Senior Director of New Verticals, to share how Pinky grew her business, built resilience, and even reminisced about her early days as a Dasher!
To round out our week of fireside chats, VP of Public Policy, Max Rettig; Senior Director of HR, Liane Hajduch; Senior Director of Platform Operations, Sagar Patel; and Senior Manager of Employee Relations, Kara Jones joined our VP of People, Katy Shields to discuss the respective roles they play in supporting, coaching and enabling growth for our women.
We followed the week of fireside chats with a series of in-person happy hours hosted by our Women@ Employee Resource Group across our office hubs in San Francisco, Los Angeles, Tempe, Chicago, Seattle, New York, Melbourne, and Sydney.
And to round out the week of learning and engagement, we designed four virtual workshops for employees who identify as women built around growth, covering topics such as how to consider influence as a part of collaboration, the “ABCs” of coaching for team effectiveness, how to build a personal action plan for making work-life harmony a reality, and how to own your career growth.
Women’s Leadership Week is just one example of how DoorDash is committed to advancing women. From our Women@ ERG to leadership programs and networking events for employees to our Made By Women program for women-owned Merchants and the earnings opportunities we create for women Dashers, we are committed to increasing visibility for women across every part of the DoorDash community. And as we look ahead, we continue to invest in growing women into future leaders at DoorDash.
Watch our recap of the engaging week, check out career opportunities below, and learn more about our commitment to creating an environment where everyone feels welcome, supported, and valued here.
Running thousands of experiments effectively means carefully balancing our speed with the necessary controls to maintain trust in experimental outputs–but figuring out that balance is never easy. Traditionally, experimentation velocity tradeoffs are focused on minimizing the false positive rate (FPR), which heavily leans towards maintaining the status quo. For example, in Figure 1 we show the Type I (false positive) and Type II (false negative) error rates from typical experiments. In this traditional setup, the experimenter makes an explicit assumption that accidentally shipping a false positive has four times the risk relative to the opportunity cost of not shipping a completely valid treatment.
Figure 1: This figure shows conventional error rate tradeoffs, where an experimenter uses an alpha of 0.05 and a power of 0.8. The colored areas highlight the size of the Type I error (red) and Type II error (yellow).
While this thinking has generally been the norm in both industry and academia, it creates certain challenges when it comes to product development. Specifically, it creates the following problems:
It means doing fewer experiments with higher confidence requirements. These conditions reduce velocity and create serious difficulties for product development whose processes rely on a very rapid feedback loop.
It makes experimentation less accessible as a tool for companies and teams that don’t have large sample sizes but have a lot of ideas they want to test.
It ignores that the conventional criteria for decision-making are simply guidelines and error rates should be set on a case-by-case basis. For example, Jacob Cohen, who was an American psychologist and statistician best known for his work on statistical power and effect sizes, was very open that his guidelines for thresholds are “values chosen [that] had no more reliable basis than my own intuition” (pp. 532, Cohen, 1988), and that a researcher should create their own guidelines when it is warranted.
This post will highlight a few ideas for driving successful experimentation and how to balance velocity with experimentation confidence:
Greater velocity drives impact: In this section,we’ll illustrate why increased velocity can be a big driver of impact and why it is useful to frame experimentation tradeoffs in the context of reward maximization instead of minimizing the false positive rate.
Increasing confidence through standardization: In this section we will highlight that there are better ways of increasing trust and reducing inflated Type I error that don’t rely on conservative rule-of-thumb thresholds.
Why experimentation velocity matters
We can build a simple simulation model to understand the impact of velocity on experimentation. Let’s assume there are two start-ups that compete in an identical industry. Each startup is led by CEOs who have somewhat divergent views on experimentation.
High-trust CEO comes with a strong research bias. This means that all experiments need to be carefully planned, and findings are valid only if they pass the conventional threshold p-value of 0.05. Note that this CEO is the baseline for how decision-making is done by teams that use experimentation in both industry and academia.
High-velocity CEO values flexibility and cares not only about the validity of experiments, but about the speed of iteration and business impact. Because all experiments have directional hypotheses, a one-side threshold of p=0.05 is considered good enough. Moreover, any experiments that have the treatment effect with one standard error pointing in the opposite direction to the hypothesis get terminated early (i.e., we are allowed to peek once mid-way through our target sample size and make a continue/discontinue decision).
The two CEOs care about a single metric, which is order-revenue-per-user that stands at $30. We will assume that 20% of the true effects tested have a negative impact, 60% lead to no impact, and the remaining 20% lead to a positive impact. Moreover, we assume that all experiments have preset Type I and Type II error rates of 5% and 20% respectively. Under a constrained environment, where these CEOs have more ideas they want to test than experimental bandwidth, which CEO is likely to have a higher return on experimentation?
In our simulation, the one-time peeking and one-sided alpha threshold would lead to a much higher false positive rate than the alternative choice. If our goal is to minimize the false positive rate, the high-velocity CEO has failed to accomplish that objective. Nonetheless, as Figure 2 shows, the high-velocity CEO is able to run 50% more experiments and achieve $1 more in real revenue impact. By making a tradeoff around p-values and early stopping criteria, the high-velocity CEO is able to get a higher reward even after accounting for the negative consequences of an increased false positive rate. This example of comparing high trust versus high velocity highlights that focusing on reward maximization strategies in experimentation can dominate conventional criteria that minimize false positive rates.
Figure 2: This figure shows the cumulative number of experiments run, real metric impact, and false positive experiments shipped as time progressed. In cases when we have more ideas and less experimental bandwidth, we should make a tradeoff that favors velocity.
Stay Informed with Weekly Updates
Subscribe to our Engineering blog to get regular updates on all the coolest projects our team is working on
Please enter a valid email address.
Thank you for Subscribing!
The benefits of maintaining high velocity
Velocity is a big reason why DoorDash so emphatically cares about variance reduction and its benefits. Nonetheless, it is more useful to think of velocity in the context of the overall experimentation lifecycle. Velocity is measured from the moment someone comes up with an idea to the moment they are able to make a decision based on experimental outputs, so focusing on multiple velocity initiatives outlined in Figure 3 can have high payoffs. Within DoorDash, among teams that optimize their workflows around experimentation velocity, we have observed the following strengths:
Better metric understanding: Experiments provide a great opportunity to be more in tune with the drivers of company metrics, understand mediation effects, find instrumental variables, make tradeoffs, and run meta-analyses. We have consistently observed that people build better perspectives of their products and metrics and more empathy about their users because experiments are a forcing function for doing so.
Greater reliability: If you launch an experiment once, you might occasionally have the codebase filled with magic numbers or undocumented forks, because you might tell yourself that “this is not going to be used or modified much”. If you’re required to launch dozens of experiments, you’re explicitly given a motivation to do a better job in setting up clear configuration files, automating repetitive tasks, and writing code that is more functional, decoupled, and refactorable. Experimentation forces better coding and architecture decisions because you’re always thinking about how to introduce flexibility to launch new changes faster, make modifications easier, and reduce the impact of harmful rollouts.
Greater autonomy: To enable higher velocity, a company is required to trust experimenters to operate in a fail-fast and learn-fast culture. Individual teams are asked to handle themselves with ownership and accountability, and there is no general supervisory body through which decisions are bottlenecked. This autonomy is a great motivator for high-performance teams.
Figure 3: There are many ways of improving velocity that range from improved statistical inference to improvements in metric selection or streamlining the overall experimentation process.
Velocity is not always the goal
The tradeoffs we make between velocity and trust are driven by the industry and by the cost of rolling out a treatment that might have a negative impact. Decisions around hiring, drug treatments, credit approval, or social policy require a higher burden of evidence. Similarly, decisions that are not easily reversible and require an increased maintenance burden should also need more evidence. Nonetheless, many industries and contexts don’t benefit from a decision process that prescribes conventional restrictions on velocity, and experimenters should be encouraged to focus on reward maximization instead of minimizing the false positive rate.
Moreover, the tradeoff between velocity and trust should be mitigated by how efficiently teams run and are using their experimental capacity. If a team runs one experiment when they have the capacity to run ten, there is a benefit to being more conservative because there is no opportunity cost from a delay in decision-making or slower idea iteration.
Why experimentation confidence matters
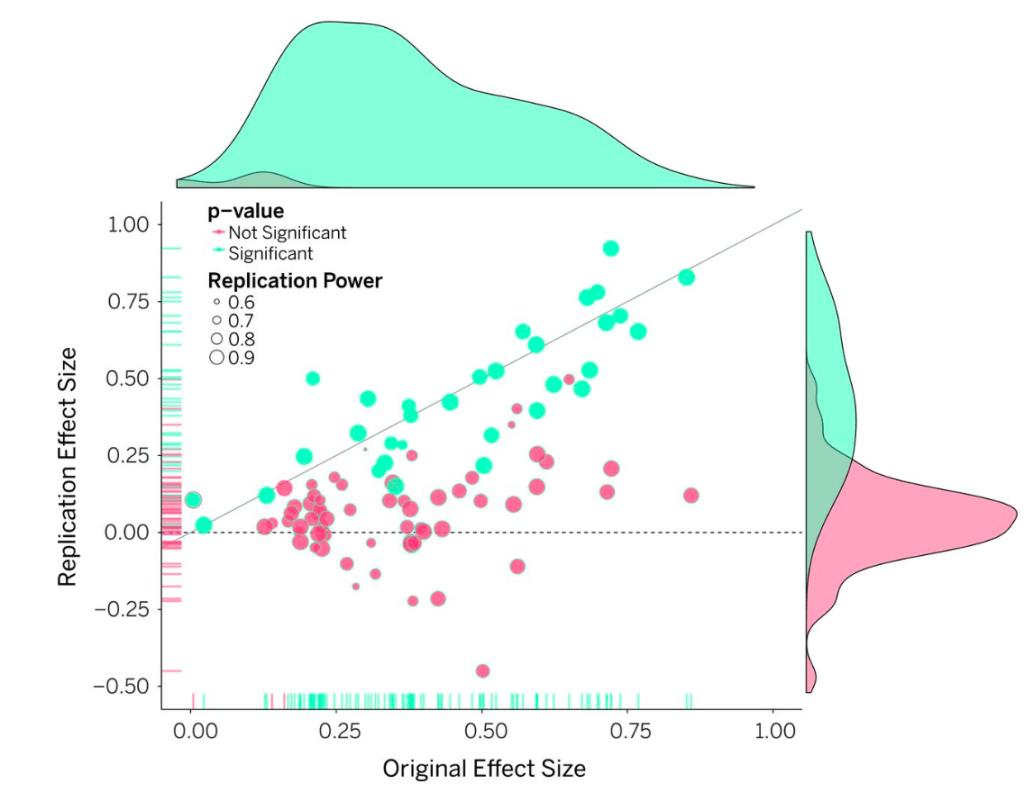
Failed replication is common in academic research settings, where the likelihood of being published in top journals is very low, articles go through multiple reviews, and there are high levels of scrutiny–yet “publish or perish” incentives are inevitable. For example, in 2015, Nosek et. al published a comprehensive replication study in the journal Science highlighting that among 100 prominent psychology experiments, roughly ~66% failed replication attempts (see Figure 4). Nonetheless in an industry setting, we can also be compromised by incentives, such as desire for recognition and for fostering good relationships with stakeholders around us. That human desire can bias us to seek outcomes or engage in practices that can lower trust in experimental outputs.
Figure 4: Two-thirds of experiments failed replication attempts or had effect sizes that were far smaller than what were observed in the original study.
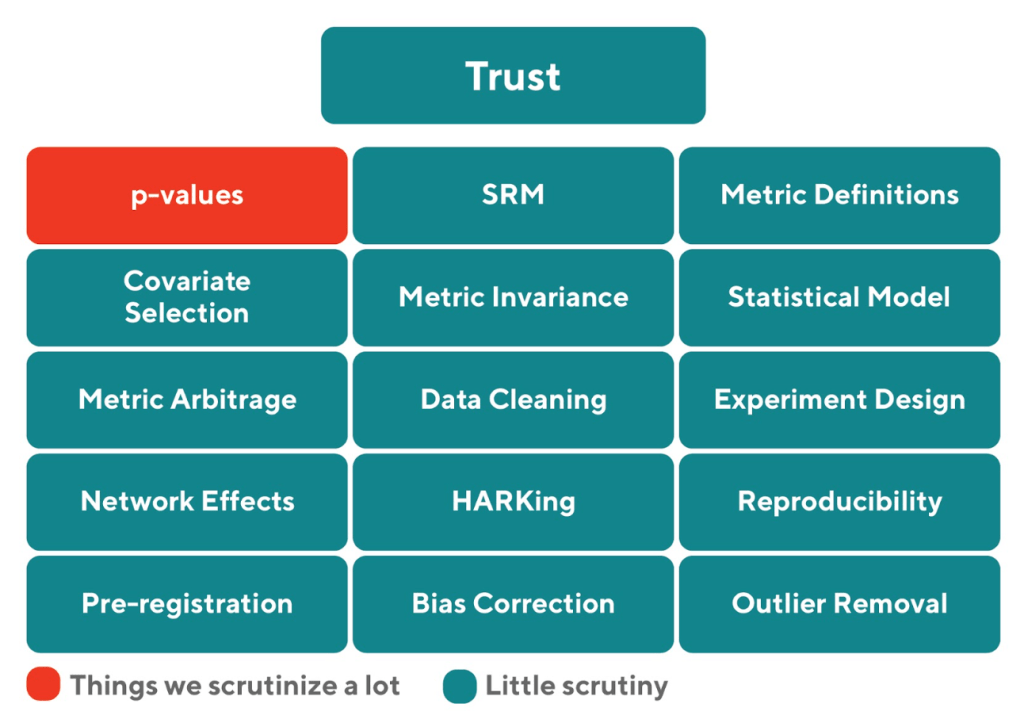
There are many factors that affect experimentation trust (see Figure 5). Although convention can push us to scrutinize specific things like p-values, the root of many experimentation issues has to do with not putting things down in writing things like what the hypothesis is, how to test it, what your metrics will be, covariates, the experiment duration, the unit of randomization, and statistical model you’ll use to analyze the data beforeexperiment launch. Recording these factors has a tremendous impact in reducing researcher degrees of freedom, getting more precise feedback from stakeholders, and reducing p-hacking. Any person can look at the analysis and compare it to the experiment design and call out inconsistencies in planning.
In this section, we will highlight two topics that affect trust and are particularly challenging to solve at scale:
Preventing metric arbitrage and
Ensuring metric invariance.
Figure 5: There are a lot of aspects that affect experimentation trust. Although the alpha threshold for p-values receives a lot of scrutiny by researchers, other factors play an equally important role. We recommend having a more holistic view of trust rather than focusing only on p-values.
How metric arbitrage eliminates experiment wins
Metric arbitrage happens when a team has a primary and a guardrail metric. The team wants the primary metric to be positive and statistically significant and for the guardrail metric to stay flat or generate no deterioration. Metric arbitrage specifically affects large organizations where teams operate in a decentralized context. As companies scale and grow, entropy increases. In order to remain productive and ensure increased focus, teams that own a large area of the product get subdivided into separate teams that sometimes have competing priorities. For example, we might have the following subteams:
Team Growth has the goal of adding more users under some efficiency constraint represented by $cost/user. The team is willing to spend at most $10 to acquire one new consumer. If they acquire a consumer under that $10 guardrail, they are doing great.
Team Pricing focuses on profitability and is responsible for pricing the product. They are willing to save at least $10 even if it means losing one consumer.
Both teams operate from the same tradeoffs, which in itself is very rare. Nonetheless, even if teams operate from fundamentally the same tradeoffs, they might engage in many actions to make the primary metric more likely to pass statistical significance while the guardrail metric is deemed as not statistically significant. For example:
Team Growth might ship a promotion that will bring more users with a p < 0.01, but will ignore the potential increase in costs to $15/user because p-value is 0.2.
Team Pricing might increase prices, which will bring an incremental $1/user, but will ignore the potential risk of a decrease in user growth because p-value is 0.3.
Although the outcomes described above might seem incongruous, given that the variance of a metric across teams should not change, these types of outcomes can be easily achieved simply by deciding to apply variance reduction selectively only on the primary metric and not on the guardrail metric (see Figure 6). When we apply variance reduction, we reduce the standard error around the primary metric while keeping the standard error for the guardrail metric wide.
Figure 6: Metric arbitrage can lead to accepting small, but statistically significant results seen in primary metrics (left panel) at the risk of ignoring large, but non-statistically significant results in guardrail metrics (right panel). The outcomes can be achieved by how one filters data or applies variance reduction.
As companies become larger, having a shared understanding of metrics and tradeoffs becomes paramount. Even if you have top-notch experimentation tooling, research methods, tracking, and telemetry, if teams are allowed to operate without metrics consistency and alignment, arbitrage can completely eliminate the benefits of running experiments since teams cancel out each other’s improvements. Although there are statistical approaches that focus on equivalence testing that specifically deal with testing for the absence of evidence, the core problems are driven by a lack of standardization and researcher degrees of freedom. Within the Experimentation platform, we attempt to reduce metric arbitrage by having a good integration with our internal Metrics platform. To reduce arbitrage, we specifically focused on the following:
Standardized metric definitions. The first solution is to make sure that teams use a set of shared metric definitions. It is very easy during the process of running an experiment to reinvent definitions or adjust them slightly to your specific subteam. Although experimenters should be allowed to define new metrics or redefine metrics, since that process encourages exploration of new ideas, stakeholders need to clearly be able to see that the new metric definitions are inconsistent with standardized metrics used across the company.
Always on guardrails. The second solution is to make sure that when an internal user launches an experiment, they are not allowed to opt out from tracking a set of guardrail metrics that the majority of stakeholders within the company care about.
Metric insights. This third solution is to expose to teams how tradeoffs are being made within the platform by reporting on historical experiments. For example, we can allow stakeholders to filter on a specific metric and see all historical experiments that were launched that affected that metric. They would then be able to drill down to experiments where the metric was negative and ask different subteams what made them make a launch decision that led to a detrimental metric impact. By increasing this transparency, internal teams can have a more open debate around tradeoffs.
The integration with a Metrics platform allows teams to more efficiently and transparently communicate how they make tradeoffs or surface cases when teams compete against each other on a set of priorities. We hope to showcase the work on the Metrics platform in a future blog post.
How lack of metric invariance affects generalizability
We commonly assume that water boils at a temperature of 100 °C (212 °F). Yet if you run multiple experiments under different conditions, you’ll find that this assumption does not generalize. Instead, atmospheric pressure often affects the boiling temperature of water, with increased elevation seeing a lower boiling point. This is why at the top of mount Everest, water boils at 70° Celsius, and pressure cookers are becoming a staple appliance in kitchens due to how efficiently they can speed up the cooking process. The inconsistent relationship between temperature and boiling point for water is an example of a metric lacking invariance. In one experiment you might be able to establish a relationship between X and Y, but that relationship changes based on many mediator variables present in the environment. If your environment changes, you have to adjust the assumptions you made.
We find a lack of metric invariance in a large portion of our experiments.
A seasonal cuisine carousel is very impactful in driving a higher order rate, but it requires one to correctly match and regularly update the carousel to the relevant season. Providing users a carousel of ice-cream offerings during winter months because an experiment in summer months showed higher conversion would likely be a miss.
We might assume that if we improve how quickly a page loads, we will see increased revenue. Nonetheless, time is a reality perceived by the user and there are perceptual and cognitive limits below which users are likely not sensitive to changes in page load times. Therefore, you might find that a 0.2s improvement doesn’t translate to any meaningful impact when your latency is already perceived to be fast.
We might build a more efficient lever for managing supply-demand, yet the presence of healthy supply means that this lever rarely gets deployed, which leads to flat metrics. In an undersupplied environment, the lever could be very impactful.
We might find that a new UI drives engagement up, but long-term impact stays flat due to novelty effects.
The best solution to this problem is to view experiments as a learning opportunity, regardless of the outcome of a specific experiment. This scrutiny and exploration have several benefits.
They allow us to increase the success rate of experimental launches. If a team has a success rate of 20% for a first experiment launch, that number can often double after a relaunch because the first experiment instructs us how to adjust the treatment in the follow-up experiments.
All experiments provide meaningful lessons and serve as a rich source of potential projects. The magic of experimentation is that every time you complete one experiment, you’re often left with enough ideas to follow up with two or three other treatments.
Lastly, follow-throughs can allow us to understand under what conditions our treatment will generalize. For example, when we build levers for addressing supply-demand imbalance, we might ship flat global results if we have enough evidence to suggest that the treatment effect increases as a function of undersupply in the market.
Overall, for any experimentalist, it is worth investing the time in getting familiar with some of the causal inference tooling that goes beyond simple ATE estimation (see Imai, King, & Stuart, 2008).
Conclusions
A successful experimentation paradigm requires one to operate with high trust and high velocity. Unfortunately, those two often compete against each other. We generally recommend focusing on the following to help balance the two.
If you have a long backlog of ideas and high execution capacity yet experiments take longer to run, focus on things that improve velocity: variance reduction, higher alpha thresholds, sequential testing, standardization and automation, and rapid experiment review process. Sometimes this can lead to a higher false positive rate, but as long as the team makes more experimental bets, they are likely to maximize experimentation impact.
If you notice a lack of metric consistency, replication failures, or a tendency to rationalize any experiment result, then focus on standardization by asking experimenters to pre-register their proposals, carefully track metrics, and be very explicit about how they make decisions ahead of experiment launches. The best way of mitigating the Type I error is by adopting better research practices rather than by compensating through more conservative thresholds.
If you are passionate about building ML applications that impact the lives of millions of merchants, Dashers, and customers in a positive way, consider joining our team.
Acknowledgements
Thanks to Jared Bauman and Kurt Smith for feedback on this article and the overall Experimentation team for engaging discussions about how to maximize experimentation impact.
On Veterans Day in the US and Remembrance Day in Canada, all of us at DoorDash celebrate and honor veterans for their service. Today, and throughout the month of November, we’re reflecting on what it means to serve and how we can act on our gratitude by supporting veterans and their caregivers.
Throughout November, in partnership with our Veterans@ Employee Resource Group, veterans and allies at DoorDash participated in local 5k events and volunteer initiatives, with a blend of in-person and virtual opportunities designed for everyone to get involved. In the week leading up to Veterans Day and Remembrance Day, veterans and allies reflected on their service and joined together to share their favorite photos from active duty. On November 11, our teams participated in a moment of silence to remember those that made the ultimate sacrifice for our freedom, and we rounded out the day by bringing our veteran community together through a virtual beer and cheese tasting event.
“As we continue to grow, the Veterans@ ERG’s mission is to foster an inclusive community of veterans, military spouses and allies and support DoorDash’s commitment to hire from the military community and be a military-friendly employer of choice.” – Cassie Cristo, Sourcing Specialist II
DoorDash is proud to support veterans and their families on Veterans Day and Remembrance Day, but we know our work doesn’t stop there. Since launching our Veterans@ ERG last year, we’ve brought together a community of proud veteran employees and allies who have bonded through shared experiences and supported each other through career development and professional growth.
We’ve also continued to work closely with the Veterans@ ERG in veteran recruitment, committing to the Veteran Hiring Pledge to actively hire veterans of the U.S. Armed Forces and joining the Department of Defense’s Military Spouse Employment Partnership, which provides career opportunities for military spouses. Earlier this year, to honor these commitments, we hosted our inaugural “DoorDash Hires Heroes” event, dedicated to veterans, transitioning service members, and military spouses.
To all the courageous veterans and to those who care for you: we at DoorDash thank you for your service, sacrifice, and bravery.
DoorDash engineers are constantly working to get 1% better, and hackathon events allow them to come up with innovative products, cross functional tools, and fresh new ideas. These events give our engineering and product teams an opportunity to take a break from day-to-day development efforts and work together to build the best “hack” or innovative new feature, experience, or tool.
This year, DoorDash’s theme was “Going Global,” with over 90 teams joining together in-person in San Francisco, Mountain View, Seattle, Los Angeles, New York, Toronto, Australia, and in remote locations to work across three divisions: Going Global open division, Environmental Sustainability, and Supporting Diverse Communities.
In the Going Global open division, we challenged teams to take a look inward at our current tools and processes across the globe and showcase an impactful innovation. The division was also an opportunity to get creative and propose any cool new feature, experience, or capability for the platform.
Events like the hackathon are really good opportunities to meet new people and strengthen many skills, from knowledge sharing to leadership. Hackathons are also a great low-risk environment to foster our entrepreneurial spirit by working together to bring new ideas to life and get feedback from the rest of our organization,” said Jodie Lu, Software Engineer and a member of the Going Global division winning group. “As someone who not only builds the product, but also uses it almost daily, I’ve amassed a list of features and improvements that I would love to see in the product, and I know others have as well! Getting to discuss a diverse set of ideas on how the product can change and improve helps me better understand how others use the product, and I can incorporate those insights into my day-to-day, even after the hackathon ends.”
As we scale and expand globally, so does our environmental footprint. In the Environmental Sustainability division, we challenged our teams to identify technical or non-technical solutions to reduce DoorDash’s environmental footprint.
“It was a really insightful experience to work with engineering and design teams from all across the business. Our collaboration brought so many interesting ideas, problems and solutions to the table. I’m glad our project resonated with the judges – I know each of us is super passionate about finding ways to make DoorDash greener!” – Insha Ardron, Senior Policy Research Analyst, part of the Environmental Sustainability winning group and part of the Best in Show winning group
At DoorDash, we recognize that our employees, merchants, consumers, and Dashers are members of diverse communities with unique challenges. In the Supporting Diverse Communities division, we partnered with our Employee Resource Group leadership and Global Employee Engagement team to judge and engage with impactful solutions developed by our teams to tackle challenges faced in local communities around the globe.
“The hackathon experience was great because I had the opportunity to meet engineers from different teams and was able to take away learnings from them,” said Minesh Javiya, Software Engineer and a member of the Supporting Diverse Communities division winning team. “Working on the hackathon made it feel like I was back in college, just coding because that’s what I love to do. Hopefully we can make our project a reality because much like our other efforts at DoorDash, it could impact thousands of people.”
We’re proud to share that Abhinav Pandey, Benny Lin, Ely Alamillo, Insha Ardron, John Park, John Quinye Jiang, Jorge Ibarra, Josh Woods, Sravan Konda, and Zuocheng Ding from combined efforts to be the division winner in the Environmental Sustainability division, which also took Best in Show. Congratulations also go out to Alan Lin, Justin Wang, Bonnie Wang, Cody Zeng, Jodie Lu, Sharne Sun, Ryan Teshima, Will Gan, and Rachel He on winning the ‘Going Global’ division and Michelle Lee, Minesh Javiya, Ankit Agarwal, Ying-Chun Wang, and William Gao on winning the Supporting Diverse Communities division.
These teams follow in the footsteps of previous winners who have had their projects implemented, ranging from Kitchens Without Borders to Dark Modeand our WeDash Dashboard.
At DoorDash, we use experimentation as one of the robust approaches to validate the incremental return on the marketing investment. However, performing incrementality tests on advertising platforms can be challenging due to various reasons. Nevertheless we strive to creatively apply proven testing approaches to enable scientifically rigorous experimental designs wherever and whenever possible.
One recent example comes in the form of pulling off a lift test of advertising on an app marketplace. In the past, we struggled to determine the impact of our search advertising campaigns on driving downloads of the DoorDash app through that app marketplace. Challenges include lack of control over the marketing intervention (e.g., users in the treatment group will have the opportunity to see the advertising while others in the control group will be intentionally withheld from seeing the advertising) and a lack of precise geo-targeting on the ads platform. Despite these complications, we were able to come up with a viable approach leveraging switchback testing alongside baseline calculations to overcome the limitations of the platform and successfully perform a statistically rigorous incrementality test.
Challenges of experimentation
Digital marketing channels typically have several characteristics that make it hard to conduct scientific experiments. We identified three main roadblocks with regard to the testing on that app marketplace:
No A/B testing framework
No capability of supporting precise geo-targeting experiment
No easy way to conduct user-level randomization, as users have the choice to block the IDFA identifier at the app level
No robust approach of causal inference using synthetic control
We will discuss each of these roadblocks in detail and address how they impact our capabilities of conducting an incrementality test.
Stay Informed with Weekly Updates
Subscribe to our Engineering blog to get regular updates on all the coolest projects our team is working on
Please enter a valid email address.
Thank you for Subscribing!
No A/B testing framework
The publisher we used only allows advertisers to measure the lift of different ads creatives. This new testing capability doesn’t enable us to run experiments to understand the true incremental value of ads on business performance. Traditionally, an effective incrementality test starts with the random selection of a treatment group and a control group, where the treatment group receives an ad and the control group does not. Unfortunately, our publisher doesn’t have infrastructure in place to support randomized A/B testing of this nature.
No capability of supporting a geo-targeting experiment
An alternative approach to user-level A/B testing is running a geo-targeted experiment. Geo experiments are a quasi-experimental methodology in which non-overlapping geographic regions (geos) are randomly assigned to a control or treatment group, with ads being served only to geos of the treatment group. Correct execution of the geo experiment would require the ad platform to target ads to the relevant level of location (city, DMA, state, etc.) and link to conversions at a geo-level. However, users can turn off location-based ads per ads preference policy and thus precise geo targeting is not guaranteed.
No easy way to conduct user-level randomization
With the changes of advertising dynamics such as restrictions on user data collection, users have more control over whether or not to be targeted for advertising, and thus we cannot assign truly randomized control or treatment groups. Additionally, user-level data sharing between the advertiser and publisher becomes more stringent as the industry values the protection of sensitive PII Data (personally identifiable information).
No robust approach of causal inference using synthetic control
Another commonly-used approach is to use the synthetic control methodology to conduct causal inference study. The idea is to find a synthetic control group and use a time series of the outcome prior to the marketing intervention from control to predict the outcome during the marketing intervention (counterfactual) and then measure the lift between the counterfactual and actual. Since we will measure the app download, in this case, we can try to build a relationship between Android and iOS two platforms. However, given the fact that our campaigns across different marketing channels are optimized on a regular basis, the distribution of Android versus iOS is constantly changing. As a result, there is no easy way to build a robust synthetic control model to conduct such causal inference study.
How we were able to design an incrementality test
To circumvent these obstacles, we developed an adapted switchback experiment, which can provide insights into the true return on investment of this publisher. The prerequisite of this approach is that you need to measure a conversion that happens right after the ad click, say app installation. If the conversion you want to measure has a time lag after the ad click, then the conversion lift needs to be measured via a scalar factor. For example, the success metric we want to measure is new user acquisition. However, we are not able to directly measure new users acquired because the lag between ads clicks and first orders could be days apart. Hence we first calculate our intermediate metric: app downloads for new users. Next, we determine the conversion rate of new users (download to first order). Lastly, we multiply the app downloads and conversion rate to determine incremental new user acquisitions.
Below is the process we developed to implement this experiment:
Identify the campaigns of interest which target new users
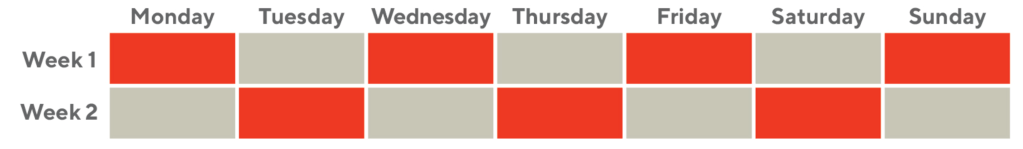
Randomize the variant (campaign on or off) for each day in week 1 and reverse the sequence of variants in week 2, so on and so forth until the campaign ends. With this approach, each time unit is a randomized experimental unit.
Collect the metric of app downloads on each day during the test duration
Aggregate the metric by group (campaign on or off) In Figure 1, assuming the test would run for two weeks, orange and gray cells denote two groups of the test, with orange cells representing campaigns turned off and gray cells representing campaigns turned on. App downloads are aggregated in a new week as shown in each color.
Define the incremental metric by measuring the difference between two groups.
Combined with conversion rate, calculate the incremental new customers. This is based on two assumptions that ads don’t directly drive incremental conversion rate and historical data suggests conversion rate is relatively stable with low volatility.
Figure 1: an example of the test design. Each row represents the actual week and the columns represent days of a week. The goal is to have randomized campaign off ( red) and Campaign on ( gray) days to construct the new n-day period.
Next, we need to determine our level of confidence that the incremental app downloads are driven by ads, rather than random volatility. There is no doubt that variation of the measured metric, app downloads, is always present. Thus, we need to find a baseline of such variation without marketing intervention.
Calculating the baseline
To successfully measure the difference of app downloads, we need to determine whether the statistical power is sufficient to detect the incremental downloads brought by ads. We ran a t-test on the difference of app downloads by looking at historical data, calculating the baseline of the difference of app downloads.
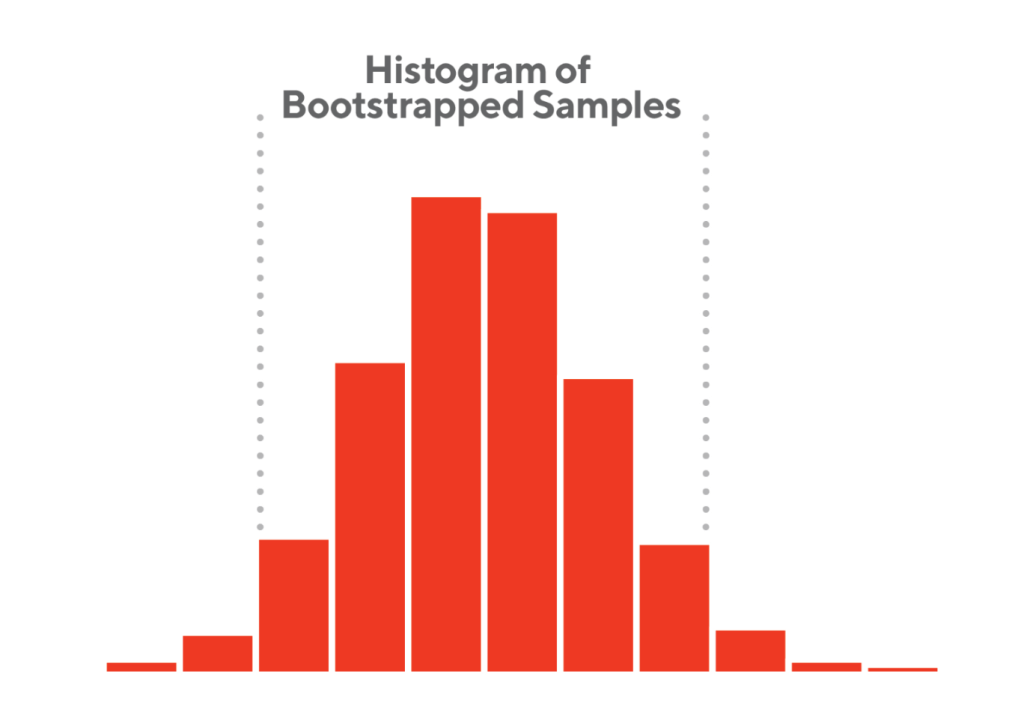
Using weekly data points limits the scale of historical data, particularly after excluding holiday weeks. We chose bootstrapping, which provided more data points using random sampling with replacement. Here are the steps we developed to bootstrap the data to get a suitable baseline:
Consistent with the test design, create new weeks based on the same pattern of randomization of days
Calculate the difference between two consecutive new weeks
Repeat step two for a large number of times
Calculate each sample mean and based on bootstrapped samples from step three, measure the confidence interval
After the baseline calculation, as shown in Figure 2, we determined the difference of app downloads at a 95% confidence interval, which denotes the variation of app downloads without media intervention.
Figure 2: an example of bootstrapped samples of app downloads. The two dashed lines denote the 95% confidence interval.
Consideration for experiment unit randomization
We conducted pre-experiment analyses based on historical data by contemplating the following three randomization methods:
Through the analysis, we reflected on the pros and cons of different randomization methods:
Simple random sampling is not recommended as this doesn’t consider the day-of-week effect, which creates the imbalanced control and treatment groups.
Stratified random sampling may reduce the biases, however, we need to sample from a longer time window as illustrated above. The longer test will hurt the business growth goal as we cannot reach the target audience during a longer no-campaign period.
Alternating time intervals may increase some biases with the benefit of reducing the variances. We also have a balance of weekends assigned to both control and treatment groups. When we analyzed the historical data, by simulating the starting point to either campaign on or off, we didn’t see a significant increase of biases.
With business implications and methodology rigor in mind, we chose the last randomization method for the analysis.
Some checkpoints before conducting the test
Given the unique nature of this test, there are some additional checkpoints we need to consider to determine the feasibility of such a test.
User behavior when seeing an ad, especially: the time lag between a user seeing the ad and downloading the app. If downloading is not an immediate action after seeing an ad, the current test design won’t be applicable. For example, if a user sees the ad during a “campaign on” period, but downloads it during a “campaign off” period, the treatment and control scenarios will not be successfully isolated.
The time lag for intervention, e.g. how soon a pause/unpause will take to go into effect. For example, we have observed that it typically takes a couple of hours for ads to disappear after we pause them. To compensate, we plan ahead and incorporate this time window into the test.
The appropriate definition of the conversion window. We pre-define a conversion window aiming to capture the majority of the conversions.
Before we formally conclude the design of this test, we need to consider the limitations of what this test can measure.
Limitations of the incrementality test
The test design is prone to unforeseeable disruptive events during the test period. If there is a system outage, e.g. the app marketplace is down, this could impact the results.
The baseline requires relative consistency. In other words, the trend of the historical baseline should persist through the test period. This is also part of the reason which motivates us to take into consideration business knowledge such as known seasonality for randomization, so that we can observe the consistent trend of baseline and test periods.
Bidding pressure from competitors. For example, competitors might react to the bidding dynamics during the test period and change their bidding strategy which would bring external impact on users’ actions to our ads.
Conclusion
For data-driven companies like DoorDash, we lean on the learnings of incremental benefits generated by marketing investments from such incrementality tests, which will guide the DoorDash marketing team on where best to spend its advertising dollars. Previously, we were unable to tell if and to what degree such ads on the app marketplace are driving incremental new customer acquisition due to lack of experimentation infrastructure on the publisher’s platform. The proposed switch-back technique provides a reasonable testing alternative. Suggested applications are outlined below:
Coupled with incrementality tests for other channels, such lift insights will be used to inform calibration of Marketing Mix Models as well as future budget allocation across various paid channels.
In conjunction with other attribution methods (e.g last-click, multi-touch, linear), we can calculate the so-called incrementality scalar, ie., the ratio between experimentation-based incrementality and attribution. This can provide marketers a heuristic rule for right-sizing the magnitude of existing attribution results.
This approach can be applicable to other use cases as well. For example, for other advertising platforms that don’t have the experimentation infrastructure to support the classic A/B testing, we can consider such adapted switch-back experiment in which we assign different time windows instead of individual users to treatment versus control when conditions below are met:
Success metric can be measured directly within a reasonable lag of intent to action
Similar trend between historical baseline and test period
Robust randomization of experiment units
Acknowledgments
Thanks to all members of the cross-functional team for the support to review this post and provide constructive feedback, Jessica Lachs, Gunnard Johnson, Athena Dai, David Kastelman, Sylesh Volla, Ruyi Ding, Ariel Jiang, Juan Orduz and Ezra Berger.
In this blog post, we introduce a functional testing approach that does not need any manual setup and can be run like unit tests locally or in a Continuous Integration (CI) pipeline. Specifically, this approach does the following:
Helps catch and reproduce more bugs during local development and greatly reduce debugging time, as well as early bug detection and release confidence.
Accelerates internal refactorings by testing API contracts without getting involved in internal implementation details.
Provides greater code coverage than traditional unit tests.
Serves as concise and human-readable documentation for business logic.
Functional tests vs. Unit tests
Before we dive into the details, let’s provide a background on the similarities and differences between functional tests and unit tests.
The following properties demonstrate some of the similarities between functional tests and unit tests are:
Automated – Both can be run on a developer’s local machine without any manual setup and both can be run in a CI pipeline.
Hermetic – Both avoid network calls to external dependencies.
Deterministic – If nothing related to the code being tested changes, then test results from both should not change.
Behavioral – Both will codify expected behavior and are sensitive to changes in the behavior of the code.
Predictive – If the tests all pass, then the code is suitable for production as both will prevent regressions when making code changes and can catch bugs before any code changes go to production.
Debuggable – Both will help when debugging by providing a quick way for developers to run their code locally with a reproducible state. They also provide an opportunity for developers to debug their code in an Integrated development environment (IDE) by adding breakpoints, inspecting code and controlling execution.
Stay Informed with Weekly Updates
Subscribe to our Engineering blog to get regular updates on all the coolest projects our team is working on
Please enter a valid email address.
Thank you for Subscribing!
The following properties demonstrate some of the differences between functional tests and unit tests:
Test Scope
Refactoring Sensitivity
Self Documenting
Unit and functional tests differ in Test Scope because functional tests focus on public API endpoints while unit tests focus on the implementation details. Functional tests will only exercise the public API endpoints, which will in turn exercise all layers of code including making real calls to databases and downstream dependencies. Unit tests will test each layer of a system by short circuiting immediate dependencies through mocking. Mocking is a process by which dependencies are replaced with an implementation that is controlled by the test. Note that functional tests avoid mocking by instantiating compatible dependencies in place of the real downstream dependencies. A compatible dependency could be an embedded database, an embedded message queue, or an embedded service that is listening for actual HTTP and gRPC requests.
These types of tests also differ in Refactoring Sensitivity because functional tests typically do not need to be updated when changing or refactoring internal Classes and Methods. Unit tests and their mocks will need to be re-written when internal Classes and Methods are changed, which can be very tedious even for minor changes. Functional tests only need to be updated when the API or business logic changes, when the APIs for downstream dependencies change, and when the database schema changes.
The last difference between these types of tests is in being Self Documenting since functional tests will resemble API contracts as they only exercise the public API endpoints while unit tests do not. Understanding unit tests requires internal knowledge of every Class and Method that is being tested and unit tests are usually interspersed with mocking logic.
The following summarizes the pros and cons of Functional testing vs Unit testing.
The pros and cons of Functional testing vs Unit testing.
A good rule of thumb is to cover all expected API behavior with functional tests first. Then write unit tests for internal utilities and libraries that are mostly static and require minimal mocks.
How we implemented Functional Tests
At DoorDash, services are written in Kotlin and use Guice for dependency injection. The APIs are exposed using gRPC, and the database is either Postgres, CockroachDB, or Cassandra. Tests are written using JUnit. JUnit is a test framework that allows developers to automatically run unit tests on their machines as well as in CI.
A functional test typically has the following steps:
Test setup: Spins up an instance of the service, cleans up databases, and anything else that may carry state between tests.
Prepare block: Sets up any required state in the database and stubs downstream services to set up a given scenario.
Act block: Sends a network request to the service API.
Verify block: Asserts on the network response and side-effects such as database changes.
Test setup
The majority of the work in writing functional tests lies in its setup. Since functional tests do not mock internal Classes and Methods, we needed to figure out how to write and execute functional tests in JUnit by spinning up the service along with compatible implementations of all of its dependencies. These are the strategies we followed for the test setup.
Use real databases which we can freely wipe
We used Testcontainers to spin up any database we want. docker-compose can also be used to spin up a database, but they need to be manually set up before running the tests. On the other hand, Testcontainers can be set up and torn down programmatically by JUnit.
Stub network responses instead of mocking classes and methods
Services at DoorDash interact with other services either using gRPC or REST, and we wanted to test those interactions as much as possible. We made use of gRPCMock to handle interactions with gRPC services instead of mocking calls to gRPC clients. Similarly, we use WireMock or MockServer to handle interactions with REST services instead of mocking calls to HTTP clients. All of these libraries spin up real servers and allow tests to set up responses to requests. This way, we test not only the service’s code but also the gRPC/HTTP client code it interacts with, thereby covering a lot more code than unit tests do.
Start a live version of the service
As the final step, we spun a live instance of the gRPC service and used it to test our APIs. Most services use Guice for dependency injection, and we used the same Guice injector in tests, with some overrides to allow it to run locally. Depending on the tests, the overrides could be something as simple as injecting local configuration into some of our dependencies or something more sophisticated such as a custom feature flagging implementation that allows per-test overrides. While Guice overrides are convenient, we try to use them sparingly as they increase the difference between local and production environments. In addition to Guice, a lot of our services also have their configuration exposed as environment variables and we made use of System Rules to set them up.
Create a gRPC Client to connect to the service
In order to test our gRPC service, we need to be able to make calls to it. We created a gRPC client and pointed at the service spun up in the previous step.
The test setup strategies we used above ensured that the service was tested with its setup as close to the production environment as possible so we have high confidence in how it would function in production.
Prepare Block
After the test setup process is complete, we set up state in the DB and stub responses from downstream services for the scenario being tested.
Act Block
In order to test a scenario or an API, we make API call(s) to the service using the gRPC client created in the test setup.
Verify Block
We assert on the response from the API call and verify it is as expected. If necessary, we also query the DB state and verify that it is as expected and verify from the downstream stubs that calls got made to the downstream services with the right inputs.
A sample functional test
Let’s consider a simplified version of the DoorDash Subscription Service having an API to subscribe new users to a subscription plan. As input, the API takes in the ID of the user subscribing and the ID of the plan being subscribed to. As output, the API will either return an error if a user is ineligible to subscribe to the plan, or a success result with custom text to be shown to the user.
In order to determine subscription eligibility, the Subscription Service will need to:
Query Location Service, an internal gRPC service, to check if the plan is available at the user’s location.
Query the Subscription Service Postgres database to see if the user already has an active subscription. There can only be one active subscription at a time!
The Subscribe API checks the user’s eligibility, verifies the user is not already subscribed, and persists a new subscription for the user.
Like many other services in DoorDash, Subscription Service is written in Kotlin, exposes its APIs via gRPC, and uses Guice for dependency injection. We will use simplified pseudo-Kotlin code for this example.
Our service has a function that is an entry point to instantiate the Guice injector and start the gRPC server.
fun instantiateAndStartServer(guiceOverrides: Module): Injector {
    val guiceInjector = Guice.createInjector(
        Modules.override(SubscriptionGrpcServiceModule()).with(guiceOverrides)
    )
    val server = guiceInjector.getInstance(SubscriptionGrpcServer::class.java)
    server.start()
    return guiceInjector
}
Test setup using a base Class
As we already described above, we need a way to start up a database using Testcontainers, stub network responses using GrpcMock, start a live version of the Subscription Service, and create a gRPC Client to connect to the running service. To do so, we defined a base Class to make setting up, configuring, and reusing resources easier between tests.
open class AbstractFunctionalTestBase {
    companion object {
        // All fields in companion object are static
        // and can be reused between instances.

        val postgresContainer =
            PostgreSQLContainer(DockerImageName.parse(" postgres :15.0"))

        val locationService = GrpcMockServer("location-service")

        val guiceOverrides = Module {
            // Use locally running Postgres instance.
            it.bind(PostgresConfig::class.java).toInstance(
                PostgresConfig(
                    host = postgresContainer.host,
                    port = postgresContainer.port,
                    user = "root",
                    password = ""
                )
            )

            it.bind(LocationServiceClientConfig::class.java).toInstance(
                LocationServiceClientConfig(
                    host = "localhost", port = locationService.port
                )
            )
        }

        val guiceInjector = instantiateAndStartServer(guiceOverrides)
    }

    val postgresClient: PostgresClient =
        guiceInjector.getInstance(PostgresClient::class.java)
    val subscriptionServiceGrpcClient =
        SubscriptionServiceGrpcKt.SubscriptionServiceCoroutineStub(host = "localhost")

    @BeforeEach
    fun beforeEachTest() {
        // Delete any rows written by previous tests.
        postgresClient.flushAllTables()
    }
}
Prepare, act and verify blocks for a happy path
Now that we’ve set up our base Class, we can write tests that use the same production postgres client to write data and define response stubs for our requests to our dependencies. Let’s start with a test of the happy path. Our test will create a test subscription plan for a user in the USA by creating a test user, subscribing the user to the plan, and making sure that the subscription record created in the DB is as expected. A happy path test might look like this:
class SubscriptionFunctionalTests : AbstractFunctionalTestBase() {
    fun `eligible user should subscribe to monthly plan`() {
        // Prepare: A DoorDash user that is eligible for a monthly plan.
        val monthlyPlan =
            postgresClient.writeNewPlan(type = "Monthly", area = "USA")
        val user = postgresClient.writeNewUser(email = "[email protected]")
        locationService.stubFor(
            method = GetUserAreaRequest,
            request = """
                {"user_id": ${user.id}}
            """,
            response = """
                {"area": "USA"}
            """
        )

        // Act: We call subscribe.
        subscriptionServiceGrpcClient.subscribe(
            """
                {"user_id": ${user.id}, "plan_id": ${monthlyPlan.id} }
            """
        )

        // Verify: User should be subscribed.
        val subscription = postgresClient.getSubscription(userId = user.id)
        assertEquals("active", subscription.status)
    }
}
Since we are reusing the same control flow as in production, code coverage for this test will include any internal components used to retrieve, write, and transform data, thus reducing the need for finer-grained unit tests, while providing a readable, high-level test that documents the happy path business logic of this endpoint.
Functional tests allow us to quickly reproduce and fix bugs
The functional testing approach allows us to quickly reproduce and fix bugs with the confidence that we can add a new functional test that will exercise all layers of the code at once. Imagine that DoorDash is launching a new type of plan in the US that renews annually. However, after launch, we get reports of users in Canada subscribing to this plan and discover that there is a bug in the location check logic in the Annual Plan implementation.
The fastest way to both reproduce and fix the bug would be to write a functional test that reproduces the issue, and modify our code until this new functional test passes. Since we can recompile the code and re-run the tests in our development machine quickly, we can quickly roll out a fix!
The new functional test would look like this:
fun `users in canada should not be able to subscribe to annual plan`() {
    // Prepare: An annual plan which is available only in USA, and a user from Canada.
    val annualPlan = postgresClient.writeNewPlan(type = "Annual", area = "USA")
    val canadaUser =
        postgresClient.writeNewUser(email = "[email protected]")
    locationService.stubFor(
        method = GetUserAreaRequest,
        request = """
                {"user_id": ${canadaUser.id}}
            """,
        response = """
                {"area": "CA"}
            """
    )

    // Act: A user from Canada tries to subscribe to the annual plan.
    val response = subscriptionServiceGrpcClient.subscribe(
        """
                {"user_id": ${canadaUser.id}, "plan_id": ${annualPlan.id} }
            """
    )

    // Verify: We should get an error response back and not create any subscription.
    assertEquals("error", response.getError())
    assertNull(postgresClient.getSubscription(userId = canadaUser.id))
}
Challenges we faced and how we overcame them
Spinning up a real instance of our app, real database, and stubbing gRPC servers takes significantly longer than just mocking them. To help with this, we made JUnit extensions that ensured we spin up only one instance of resources, such as our app, database, and gRPCMock, and any state left over from the previous test is cleaned up before the next test is run. The extensions look very similar to the “AbstractFunctionalTestBase” class in the example above, but with more bells and whistles for ease of use and cleaning up the application state.
Another big challenge is the flakiness of tests due to sharing local databases and application instances. To address this, the following measures can be taken:
Clean up the state of the app and its dependencies before launching the application.
If the act block of the test spawns asynchronous jobs, such as new threads, workflows, etc., they should be joined before moving on to the verify block. We also used a package such as awaitility to test such interactions.
Tests need to be run sequentially and are not thread-safe. We are looking into how to safely run them in parallel.
Ideally, only network responses are mocked, but sometimes that’s not practical without a lot of extra work. In that case, we might be tempted to use mocks. Instead, we recommend that a good middle-ground is to implement a fake class instead. For example, we found that it was easier to fake our internal experimentation library so we could change feature flags seamlessly between tests. In a lot of scenarios, it was also easier to inject fake configuration classes instead of setting up separate config files and/or setting up environment variables. However, overrides and fakes are discouraged, and we are working on eliminating their necessity, but it will require more time.
Finally, in order to make it easy for teams and services to adopt this testing approach, we did the following:
Provided JUnit extensions that make it easy to write functional tests.
Provided extensive documentation on how to write functional tests.
Built common helper functions to set up the state for tests including stubbing gRPC calls and populating database tables.
Results
Our development process and developer happiness improved a lot, as it is now possible to quickly set up a test scenario locally, and then keep running and re-running tests, which is very helpful when debugging. Developers also liked that they can use their IDE to debug and inspect an API execution path end to end.
Code coverage also went up significantly, up by even 20% in some services, simply because we cover a lot more code than unit tests. This also boosted our confidence in releasing our code to production.
Most of the new tests are in a functional style and serve as living documentation of our API contracts. In many cases, we also do not have to write additional unit tests for internal implementation details as long as the functional tests cover all possible business scenarios.
Conclusion and future work
While it initially took considerable effort, we found that developers report higher velocity and happiness once functional tests are adopted. For the Subscription Service, more than 600 tests currently cover a myriad of business cases.
This approach has been adopted by several other services, and we plan to continue developing tooling and documentation to encourage further adoption. We are also working on approaches to run these tests in parallel and reduce the total time taken to run them sequentially.
We are also working on integrating filibuster to functional tests. This will give further value by discovering and codifying faults that our services should tolerate.
With varied experience across different financial organizations, Grace Hill describes her path to DoorDash more than a year ago and growth to now a Senior Associate as serendipitous.
From the very beginning, the vision was clear on how Grace could have an impact at DoorDash by wearing different hats to support business partners while overseeing G&A expenses such as rent, payroll, and 3rd party services.
“It was a no-brainer,” Grace said. “I was ready to move anywhere and learn anything to join DoorDash. Within the first week, I could feel a shift in how I perceived myself and my ability to create value.”
Grace gained much of her experience working through a financial leadership development program fresh out of college, developing a suite of skills and gleaning insights on multiple aspects of financial planning and analysis function. Upon joining DoorDash, much of the siloed work she’d experienced elsewhere wasn’t in place. Instead, she found an “open sandbox” and an opportunity to build resources to be shared and used by others.
“DoorDash is an incredible place to grow. It’s rare, and extremely motivating to feel so supported that the fear of failure isn’t hindering you in some way.
“I’m pushed to develop new skills every day, especially in my weaker areas, and it’s given me the space and confidence to explore and round myself out.” – Grace Hill, Senior Associate, Finance & Strategy
Both large and small projects at DoorDash started on Day 1 for Grace, empowered to own her career growth and take on opportunities that lacked ownership.
“Within my first 90 days, I was able to support a new planning tool implementation and conduct training, model corporate real estate transactions, and drive quarterly planning with all new business partners,” Grace said. “Being in such a fast-paced environment forces you to constantly evolve.”
Support in understanding how to navigate building and fostering cross-functional relationships — in addition to combating against the ever-present imposter syndrome — has stemmed from guidance from leadership and Grace’s involvement in our Women@ Employee Resource Group.
“The (Women@ ERG) has been a wonderful resource to form connections with peers and mentors across the company,” Grace said. “When I first joined, I couldn’t shake the imposter syndrome and small mistakes made me doubt my abilities. Leaning on and learning from an internal network helped reframe and soften my definition of success.
As Grace continues to grow her career at DoorDash, she’s found balance in work-life integration, thriving in our Flexible Workplace model.
“We actually have a working group that focuses on boosting engagement within the F&S team. Whether it’s a week-long offsite or a local happy hour, a recharge day after a long sprint, or a mentorship program, our team is always planning events to help boost team morale,” Grace said. “Living near corporate headquarters feels like the best of both worlds. Remote work offers an added layer of flexibility, but nothing will replace a live white boarding session!”
All of Grace’s experiences add up to what she sees as a bright future for herself while the company continues to grow.
“It’s been an especially exciting time to be on the team,” Grace said. “We’ve built out enough basic reporting that we now need to strategically think through operational complexity and measure progress, versus ticking and tying numbers. This work will uniquely challenge and elevate each one of us regardless of team or title, and that’s what makes it so exciting. The growth potential feels limitless, as long as we show up each day in search of our 1% improvement.”
Learn about opportunities to grow your career as part of our Finance and Strategy team at our upcoming technical event. Check out open opportunities today.
For Kanaka Pattabiraman, no two days are the same at DoorDash. Since joining two years ago, Kanaka finds her work as Senior Director, Merchant Services & Operations at DoorDash rewarding. This includes onboarding merchants to the DoorDash platform with speed and quality, and helping them operate flawlessly.
Working for a company in its hyper growth stage was compelling for Kanaka when she began looking for her next role. With significant experience in the tech industry with companies in a similar stage, she has become well adapted to sustaining high performance while managing burnout.
“I enjoy working on problems at the tremendously fast pace that the hyper growth stage demands, but what has helped me sustain that over time is engineering ways to recharge,” Kanaka said in 10 minutes of hiring wisdom. “Whether it’s on a weekly basis, a monthly basis, take the time you need to recharge”.
Her perspective is that it’s a marathon, not a sprint and you have to know when to step on the gas pedal and when to step off to recharge to make work-life balance sustainable. Kanaka says it’s also important to ruthlessly prioritize work based on impact instead of trying to “keep everything in the air.”
Her focus at the time was on how to keep juggling everything on her plate, which led to burnout. Taking advice from her mentor helped shift Kanaka’s mindset to prioritize tasks that are important to juggle and giving herself permission to drop “unimportant” ones.
”For me, one of the most rewarding things has been to coach others who are also struggling in this space with the demand of the work, with work-life balance, and then offering some strategies and always checking to make sure they’re not on the verge of burnout,” she said. “It’s been a valuable lesson for me to learn, but even more valuable for me to impart.”
Check out more about Kanaka’s journey to DoorDash, tips on how to manage the interview process, and more in the video:
If you’re excited about the opportunities to work on impactful projects, own your career growth, and to be part of the future of DoorDash, check out open positions today.
DoorDash offers an immersive internship experience where all our interns fully integrate with Engineering teams in order to get real industry experience that is not taught in the classroom. This is the second blog post in a series of articles showcasing our 2022 summer intern projects. If you missed the first article the link is here. You can read about each project below.
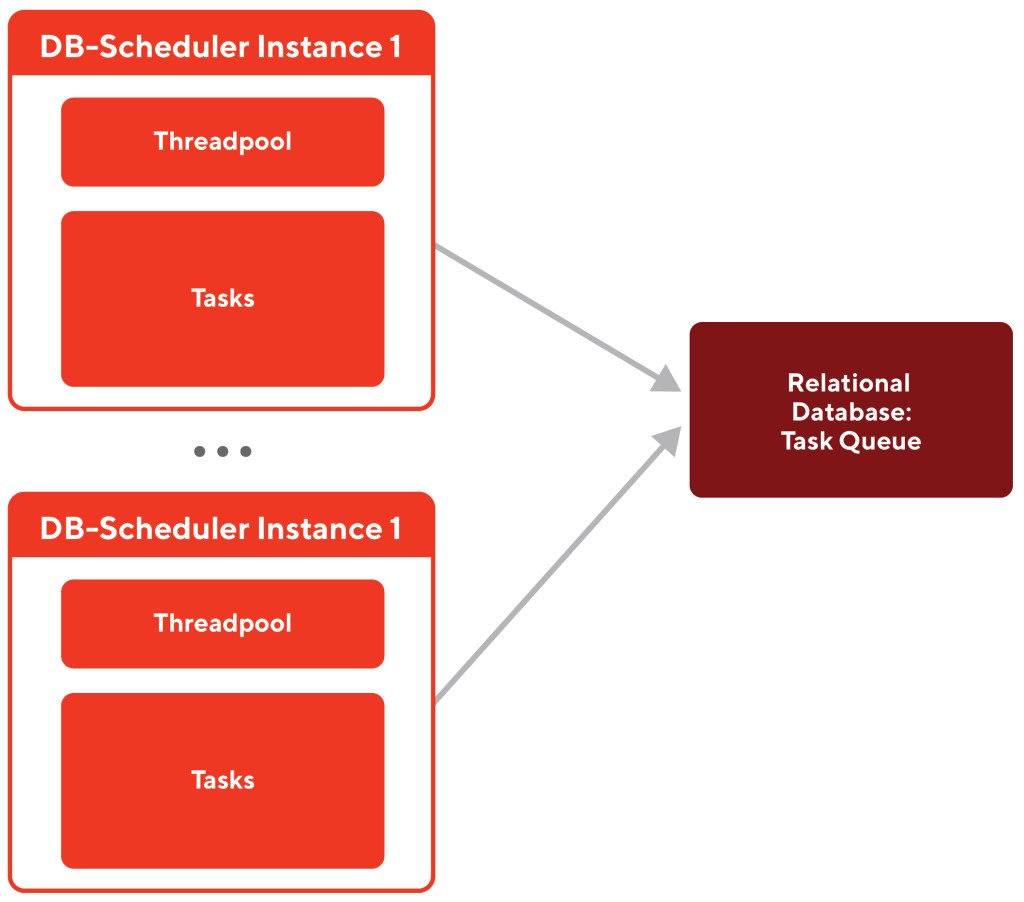
Db-scheduler is an open-source task scheduler, which utilizes the relational database as a task queue and supports multiple scheduler instances to cooperate to do job scheduling. Db-scheduler uses a simpler data model and is more scalable than other alternative solutions, such as Quartz.
Db-scheduler was DoorDash’s chosen scheduling technology when building our Cart Abandonment flow (additional use cases are WIP), which notifies users who have added items to their cart but did not check out. Our goal was to improve the async task execution capabilities for db-scheduler so that it could scale out the throughput.
A diagram of the structure of db-scheduler is displayed in Figure 1 below:
Figure 1: Db-scheduler schedules a large list of tasks with a smaller pool of threads
Why we need async task execution for scheduling
In today’s micro-service oriented architecture, a typical task is usually dependent on a set of external microservices, which implies a task may contain one or several async operations (e.g., gRPC calls). Unfortunately, the legacy db-scheduler DoorDash was using is based upon the blocking threadpool execution model. Threads remain blocked during the whole task duration. If a task contains async operations, it will simply block the thread, a process that appears to be inefficient in comparison to the non-blocking model, which allows the scheduler to utilize better thread resources instead of wasting threads waiting for tasks to finish execution.
How we improved asynchronous task execution capabilities
Our strategy for improving the scheduling efficiency through better task execution involved introducing future-based task execution APIs (major API change shown in Figure 2), to decouple the task scheduling (threadpool) from task execution (having async operations).
To be more specific, we leveraged CompletableFuture to make schedulers accept pending results from task executions so that tasks can be executed asynchronously. This would result in another advantage, as CompletableFuture is compatible with Kotlin Coroutines. For example, if we have a Deferred object, it is easy to transfer it to Java CompletableFuture with the built-in method Deferred { … }.asCompletableFuture().
Figure 2: We introduced future-based task execution APIs to enable async task execution
Results
We conducted load tests to confirm the performance of our improvement. We used an example async task which contains a one-second delay simulating async calls. Check the core code snippets in Figure3:
Figure 3: The example task delays one second and returns as a CompletableFuture
Tests were run with multiple configurations to measure the throughput (execution/s) of both original and future-based db-scheduler:
PostgreSQL was used as the database.
The container host had 12 physical cores.
The lower limit was 4.0 and the upper limit was 20.0. These are parameters controlling the number of due task executions fetched by each batch.
Every scheduler instance was running on a separate container using lock-and-fetch strategy which has been proved to have better performance when there are competing schedulers.
Tests were performed with different numbers of threads (20, 100, 300).
After running some tests, we were able to test whether we had succeeded in increasing task execution throughput. From the test results shown in Table 1, we can see that there is a big jump in performance. Under the same configuration, the throughput of the future-based db-scheduler is much larger than the original version, up to nearly 27 times when there are four competing scheduler instances each with 20 threads. Furthermore, the throughput of the original db-scheduler is highly proportional to the number of threads. The future-based db-scheduler, however, is not linearly related to it. These results indicate that we succeeded in decoupling the task execution from the scheduling process.
In addition, to reach 285 TPS, the original db-scheduler needs 300 threads, while our version can outperform with even just one thread. Since threads occupy memory resources, this comparison shows the potential of significant memory overhead reduction.
Conclusion
In summary, we made an enhancement to db-scheduler by introducing future-based major API changes. Performance tests have shown that our improvement can significantly increase task throughput and reduce the occupation of system resources. Now, the future-based db-scheduler is more competent for high concurrency scenarios with long-running tasks and scalable systems. Our work would lead to a win-win situation. What we did can bring benefits to db-scheduler and the whole open-source community, since this is a critical change.The new db-scheduler will also boost performance for DoorDash specific use cases such as cart-abandonment.
Improving the Grocery Search Experience with Query and Index Normalization
By Shuyang Wu
Part of providing a quality product discovery experience includes showing customers the products they are looking for, but that can often be easier said than done. Sometimes DoorDash’s search engine shows different results with similar queries, which is not a good search experience because queries with the same search intent should show the same results. This lack of uniformity comes from the fact that we do not add normalization when running ranking and precision models. Lack of normalization also increases the sparsity of features we use in the model, which can lead to unoptimized search results. Normalization takes the core meaning of a word, while ignoring the form (e.g. pluralization, tense, etc). With proper application, implementing normalization can improve search results for customers.
Figure 1: Grocery search without appropriate normalization led to inconsistent results for similar queries “grape” and “grapes”
Why lack of normalization creates a negative search experience
For queries like “grape” and “grapes”, it’s likely that customers have the same exact search intent, and therefore should see the same results . However, sometimes our search results differ a lot for these two queries. As Figure 1 shows, if customers search for “grapes” but not “grape”, there are fewer options to choose from. Since the queries have the same search intent, they should show the same results and not have a significant drop off.
This begs the question: why aren’t our searches showing the same results? In Elasticsearch(ES), we have internal normalization that turns both “egg” and “eggs” to “egg”, so items retrieved from that query in ES should be the same. The normalization problem occurs during the ranking and filtering part of the process that is executed after retrieval, which is where we were mainly focused. The normalization happens in ES, but the search service gets documents with original unnormalized fields. Thus we are using the original queries and item fields to calculate the model’s lexical text features, and then different results are shown to DoorDash consumers. Lack of normalization also affects the quality of these text features and decreases general search relevance, because without normalization, we would consider different words and different forms of the same word equivalent, and furthermore increase the spasticity of the features and lead to poorer results.
To measure the performance of importing normalization and whether it could improve the search experience, we would mainly use the following four search-based metrics for the evaluation:
Add To Cart rate (ATCr): the percentage of searches that ends with a Cx adding an item to cart.
Click Through Rate (CTR): the percentage of searches that ends with a Cx clicking an item
Perfect Search Rate (PSR): the percentage of searches that ends with a Cx adding an item in the first 10 search result positions to their cart
Null Search Rate (NSR): the percentage of searches that end with zero results being shown to a Cx
How to implement normalization
For the implementation, the basic idea is to extract normalization out of Elasticsearch. We implemented our own normalization methods based on the same Apache Lucene features we use in ES. To apply the same methods to query and item fields for matching them, we added the normalization before sending to ES on the retrieval side, and also when enriching menu and catalog data on the indexing side. Then after the match happens in ES, we could get items with normalized fields to calculate text features.
At DoorDash we would like to get early results to prove the hypothesis with minimal effort. Also since populating fields for each item in ES is time-consuming and it is hard to remove the added fields, it is not a good idea to directly test on ES. The implementation was divided into three steps
We first tested different normalization methods locally, manually filtering out those that have high latency or poor performance.
After that, we applied the rest of the methods after the retrieval for lightweight comparison. With a slight elevation of the latency, we normalized the query and all item fields during the searching time, so we could use them to calculate and improve text features. Then we ran the online experiment and found the most suitable normalization method in grocery scenarios.
The final project milestone was to move normalization from runtime to indexing. To reduce the latency, we used the selected normalization method to populate normalized names and descriptions of items in index documents, so we could directly access them without calculating in runtime.
Customizing normalization in a grocery scenario
Besides having optimized model features and stable results for customers, implementing our own normalization could also give us the ability to better customize normalization in the grocery scenario. At the start of the project, based on what we were using in ES, we proposed a dozen different normalization algorithm combinations, and selected the best one after rounds of experiments.
Also with customization, we removed accents in non-English Latin language, so customers could get items in “creme” and “crème” when searching for either of them, which meets the typing habits of different people, solves the issue of mistyped item names, and also help people search for non-English words in the United States like ”jalapeño” or “L’Oréal.” We also normalized the punctuations, including merging straight and curly quotes, and turning some common symbols into their name for more accurate matches in ES.
Interactions with other search service features
Search is not limited to matching the query and items, we also provide other features to better customers’ search experience. To make sure each feature functions, it is also important to consider the interactions between normalization and these features.
Spell Check – fix typos automatically. Normalization aims to work on correct words, so it should be executed after spell check. As we allow customers to disable spellcheck, which means customers would like to search exactly what they typed in, we should also disable normalization and avoid editing the query.
Synonyms – search related items. Synonyms work in ES, so we should avoid normalizing and changing the query in the synonym list or the synonym search won’t be triggered. And thus we need to maintain the same synonym list in the search service as in ES.
Autocomplete – make typing easier. For the same reason as the spell check, since autocomplete tends to work for partial words, we should disable normalization in this situation. When customers click autocomplete query suggestions, which are provided by us and correct, the spell check would be disabled and so would it be with normalization.
Languages – As the proposed normalization method aims to work in the English context, initially we plan to limit it to English searches. But by providing accent removal for non-English searches, we observed significant improvement in metrics from the experiment. So we plan to keep it for all searches.
Result
According to our experiment, with the newly proposed normalization, we could observe a decreased NSR of around relative 3%, slightly increased ATCr and CTR with around relatively 0.5% and neutral PSR. What’s more, with limited data for non-English searches, we could observe a significant improvement of 20% decrease for NSR and 13% increase on PSR, and neutral ATCr and CTR. Also we didn’t observe a notable latency increase for grocery search after we added the normalization.
Empowering Tagging Food Items and Merchants with the Clustering Taxonomy Candidates and Release Pipeline
By Zhiyang Zhang
DoorDash’s dedicated food catalog service uses ML models to tag food items and merchants across the platform, which improves the accuracy of search results and recommendations.To build a predictive ML model that powers these categorizations, we need to provide the ML team with taxonomy data that has enough coverage. Previously, we had a manual process which required a huge effort to provide the ML team with taxonomy data and could result in numerous human errors. To extend the coverage of our food catalog taxonomy more efficiently and to provide the single source of truth for taxonomy, we needed an automated pipeline to import and release jobs. Automating these processes and providing APIs would enable our taxonomy team to focus on the more pressing job of refining and expanding the taxonomy actively.
The problems with the legacy taxonomy expansion workflow
Previously, outputting a mature taxonomy version (a collection of taxonomy that are good to release) needs a lot of involvement from the taxonomy team:
First, building a taxonomy meant manually filtering dirty data to find valuable candidates, which are the food items liked by many people but not existing in current taxonomy. This process started by separating the valuable taxonomy candidates from the raw data every day.
Then after the taxonomy candidates are imported to Synaptica’s Graphite (our taxonomy organization platform), the taxonomy team reviews and organizes them into mature taxonomy versions.
Once the taxonomy is updated, that new version needs to be updated in our taxonomy services database. This process involves the manual export of the taxonomy as a CSV and manual upload into the taxonomy Snowflake table.
Now, the updated taxonomy is in the database, and the ML team can use the latest taxonomy to train the model and food catalog service can tag existing food items or merchants using the model.
Below in Figure 1 is a breakdown of what this process looks like.
Figure 1: The legacy taxonomy expansion workflow
The whole process described above is time-consuming and it has several problems:
Low efficiency and low scalability: The taxonomy team hopes to have active expanding of taxonomy. This process is too slow for rapid iterations
Lack of releasing pipeline: The ML team relies on the taxonomy to train models and the food catalog service needs to consume it as well. We lack a way for teams to easily import and utilize the newest version
Ad-hoc versioning: Version control is also manual and not centralized. It’s hard to map between the taxonomy version and ML model version when we update new versions of the taxonomy.
Daily runs ETL process for clustering taxonomy candidates and an API for releasing mature taxonomy versions
To solve the efficiency, reliability, and manual issues mentioned before, we built an ETL job that runs on a daily basis for clustering taxonomy candidates and also built a gRPC endpoint for releasing mature taxonomy versions. This pipeline will liberate our taxonomy team from the painful importing and the exporting process.
In the importing process, we run an Airflow ETL job every day to get the raw data, and then use clustering algorithms to find popular candidates (the food items liked by many people but not existing in DoorDash taxonomy). Afterwards, we can import all these candidates to Graphite through its API.
In the exporting process, the taxonomy team can make a simple gRPC call, and then our taxonomy version management service will record release information, which enables tracking and managing history versions. Finally, our service will write the mature taxonomy versions to the Snowflake table that provides taxonomies as the metadata of training ML models. Our service can write multiple versions concurrently.
In this way we can automate the highly manual aspect of the taxonomy data collection and filtering.
Figure 2: The automated pipeline of clustering candidates and releasing taxonomy versions
What is clustering and how to find the popular taxonomy candidates?
In the tens of thousands of raw annotation data, many data have little difference and represent the same taxonomy. In order to find such a taxonomy, we need to cluster these similar data into one group. As a result, the size of the cluster can indicate the popularity of the taxonomy, and the most frequent data in this cluster is likely to be the taxonomy candidate. We put a lot of effort into designing this crucial clustering process because it serves as the upstream of everything in this workflow. We’d like to share the details of how we achieve high accuracy in this critical process.
First, we apply text normalization to clean the dirty data before pushing them into the clustering algorithm.
Coming from DoorDash menu items, the raw annotation data has many strange and undesired formats, like metering parenthesis (like “(30 ozs)”), sequence number (like “c6.”), and punctuations (like “;”). All these undesired parts will result in low cohesive clusters because they have no meaning in taxonomy.
So we will first use regular expressions to normalize punctuation characters such as “&” to “and” and to delete all unnecessary characters. Then we apply functions like lower() and trim() to do additional text normalization and remove leading and following white space characters. After applying the text normalization, the size of clusters decreases more than 15%.
Secondly, we fit the model on clean data using DBSCAN as the clustering algorithm, along with Levenshtein distance as the metric.
Among many clustering algorithms, we chose the DBSCAN clustering algorithm considering the non-flat geometry of our dataset and the better performance of DBSCAN compared to other popular clustering algorithms.
Because the existing metric doesn’t apply to the dataset of strings, we turn to the Levenshtein distance. Levenshtein will compute the edit distance between every pair of raw data and then transform the matrix of strings into the matrix of numbers, on which DBSCAN can fit a model.
As a result, the raw annotation data are grouped in such a way that the entity names in the same cluster are more similar to each other then to those in other clusters. So the size of a cluster reflects the popularity of how it is chosen by people. Then, we can import the candidates that only have enough popularity into Graphite.
In the end, this would allow the taxonomy team to work on a handful of important candidates over processing several thousands of redundant and randomly distributed candidates.
Impact of only importing popular candidates and providing the gRPC API for releasing taxonomy
Our pipeline can automatically handle tens of thousands of raw data and import the top 50 frequent candidates into Graphite. It saves the taxonomy team hours every day filtering taxonomy candidates and exporting mature taxonomy versions. This means that they can be more efficient and focus more on expanding the taxonomy efficiently. Also, it provides the ML team with the single source of truth tables for taxonomy versions and they can easily consume and train models.
Overall, we could achieve eliminating hours of manpower per week with this effort and replace repetitive, error prone manual processes with automated processes and proper channels. Thus, our taxonomy team and ML team can focus on their own dedicated area to improve our user experience and meet consumers’ needs of ease and convenience.
Optimizing and Migrating the Dasher Announcements System Out of Nimda
Author: Andy Jiang
Currently, DoorDash heavily relies on emails, SMS, and push notifications to communicate with Dashers; however, we are not able to control these channels, which prevents us from tailoring them to specific use cases. Because communications like emails and SMS can have delivery issues or rely on third party services, we have been slowly shifting towards in-app announcements, which help users get information and resources on our platform without having to leave our app. This communication is especially important for Dashers, our name for delivery drivers, because completing a Dash, our name for a delivery, might involve several notifications which are easier to digest in a single app experience. Unfortunately, we are unable to fully leverage in-app notifications as a Dasher communications channel due to the reliability concerns of the legacy tool. Here we will talk about how we were able to build a new web tool for the Dasher Announcements system and expand its capabilities.
Overview of in-app Dasher announcements
The in-app announcement system is used by operators to present messages to Dashers on the app. It shows important updates and can be located by clicking on the bell icon on the Dash screen of the Dasher app (see Figure 1 below).
Figure 1: The in-app announcement screen on the Dasher app.
The primary tool we use to create and deploy announcements to Dashers is with Nimda, which is an administration tool packaged and built within the Django framework.
The problems with the legacy Dasher announcement system
Our legacy in-app Dasher communication channel did not meet all of our needs. There were two main problems with the legacy system.
Figure 2: The legacy internal tool used by operators to manage announcements.
For one, the tool was unreliable with an unintuitive UI (see Figure 2). The use of announcements has outgrown Nimda as we continue to scale it to larger audiences, and operators frequently run into issues using the tool. Additionally, the tool was not designed for creating announcements targeting a large audience. The tool only allows operators to send announcements to at most 10,000 Dashers at once and selecting a large majority of the submarkets in the tool will cause the request to time out and not send anything. Operators are also unable to schedule the announcements and can only do one-time sends in real time, which makes this manual task less convenient and more prone to human error.
Figure 3: The list announcement endpoint causing high CPU utilization in the pods.
The second issue is that there’s a bottleneck in the current schema in that the list of whitelist Dasher IDs is saved as a JSON blob within the data model. This is a problem since in order to determine relevant announcements to show Dashers, we would need to parse the whitelist JSON blob to determine if the Dasher ID is within it. This logic causes CPU spikes and high latency (> 600ms) when we do this with announcements containing a whitelist with thousands of IDs (see Figure 3).
How we were able to fix these problems
Before diving into our solution, it’s important to understand the existing architecture of the Dasher announcement system.
Part 1: Implementing CRUD announcement gRPC endpoints
Figure 4: Architecture schema showing the implementation of announcement gRPC endpoints in dasher-service, used by the BFF layer (admin-gateway).
Looking at the architecture schema, previously Nimda handled all the operations related to updating/deleting/creating announcements and the mobile clients would simply send a request to the Dasher Mobile back-for-frontend (BFF) layer which would communicate with Dasher Service (Dasher microservice) to fetch the appropriate announcements to show Dashers.
So first we extracted the Dasher announcement from Nimda by implementing CRUD announcement gRPC endpoints in the Dasher Service (see Figure 4). This extraction allows us to have the capability to modify the underlying logic of the announcement operations to suit our use cases. We also leveraged asynchronous processing and granular control of the latency and timeout values to resolve the timeout issues with announcement creation.
Part 2: Implementing CRUD announcement gRPC endpoints
Figure 5: Architecture schema showing the implementation of the redis cache in the CRUD gRPC endpoints in Dasher-service and also the existing list endpoint.
On top of this, to solve the bottleneck that causes high latency when listing announcements, we decided to cache the whitelist column when we created it (see Figure 5).
Figure 6: Architecture schema showing the previous process (without cache) of creating and retrieving relevant announcements to Dashers
To give a little context, before using a cache, during the Create process, we take the new Dasher announcement object and store it in the Dasher database. Then, to list appropriate announcements to Dashers, we take all possible announcements that might be relevant to that Dasher and for each Dasher announcement object, we parse the whitelist and check if the Dasher ID is in the list (see Figure 6). Now, when doing this on whitelists with over 10,000 IDs for several announcements, this can cause extremely high latency and degrade our pods.
Figure 7: Architecture schema showing the new process (with cache) of creating and retrieving relevant announcements to Dashers
To improve these processes to reduce latency, we decided to cache the whitelist column when creating announcements. We cache the column using Redis hash with the key being the announcement ID and then grouping all the Dasher IDs in that whitelist under the key as fields to make it easier to get an announcement’s whitelist and also distinguish between cache miss vs not cached. Then, we would only need to check if the announcement_id + Dasher ID is in the cache by using a series of Redis commands to determine if an announcement should be shown to a Dasher (see Figure 7).
Part 3: Creating the new web tool
Figure 8: Architecture schema showing how the BFF layer (admin-gateway) and frontend was built to support the new announcement web tool
Next, to build the web tool, we onboarded announcements to Forward, which is an internal framework for managing entities with JSON forms, in admin-gateway. We did this onboarding by creating a new client for the announcement gRPC endpoints to communicate with the endpoints we created in the Dasher-service (which is our Dasher microservice), adding announcement GraphQL queries, defining JSON schema used by the frontend for rendering with a new Forward definition, and creating announcement specific permission groups (see Figure 8).
Finally, for the frontend portion, we utilized the EntityForm component with custom renderers and components from the internal Prism design system to build the UI in the web repo.
Results
With the new web tool (see Figure 9), we were able to reduce time spent by operators creating and deploying announcements from 8hrs to mins. Comparing the previous Nimda tool to the new web tool, Nimda offers a suboptimal user experience, with frequent timeout issues, and does not support large audience upload. However, this tool allows operators the ability to select countries rather than having to manually select hundreds of submarkets and support large audience uploads with whitelist Dasher IDs over 10,000.
Figure 9: The new web tool we are rolling out
Additionally, with our solution, we were able to remove announcement dependency on Nimda and resolve the bottleneck with the schema design by using Redis cache. This fixes the CPU spikes, high latency (> 600ms), frequent timeouts, and reduces top level (99 percentile) latency by ~30ms.
Building a Log Analysis Tool to Improve DashMart Operator Experience
By Kenny Chi
DashMart is a team under New Verticals created to deliver convenience store items to customers through an MFC (Micro-Fulfillment Center) – a DoorDash-owned warehouse. One of the main focuses of the DashMart engineering team over the past few months is improving DashMart operator clarity, allowing them to see each action within a facility: receiving items, stocking, moving, picking, etc.
Problems with bin-level inventory management
One might think that the path of an item through a DashMart is simple: receive, stock, pick, sell. Nevertheless, within those steps, there are many possible failure points: moving inventory into a different bin than specified, accidentally damaged inventory, menu sync issues, etc.
Currently, DashMart operators can view the total On-Hand (OH) quantity of an item in their facility. For example, the inventory manager shows that there are 24 bags of chips in both bins A and B. Upon taking a look at the bins, however, the operator realizes that there are only 24 in bin B. This is because 24 chips were “stocked” in bin A and later 24 units were confirmed to be in bin B.
Figure 1: Log data for the previously described actions
In this case, an operator accidentally placed the items in the wrong bin when stocking (giving 24 to bin A), and another operator later adjusted bin B to have 24 bags of chips as well.
Diagnosing inventory discrepancies in DashMarts
Before this project, local operators and site managers were tasked with looking in online dashboards or asking an engineer in Slack to query the database for the history of an item in order to diagnose the discrepancy between what they see on the inventory website versus what they actually see in the bin.
In order to begin giving operators better insight into item history, we decided to create a new access point in the database, allowing operators to click on an item to view its history in that DashMart.
Figure 2: A demo of the page from an operator’s perspective
How we gave operators access to item logs
In order to expose item log data on the front-end website, we needed to create a new API endpoint to access and filter our previously write-only log table. Although the query was on a large table shared by all DashMarts, we were able to optimize the SQL query by filtering on two of the table’s stored indices: Facility ID and Item ID.
On the inventory webpage, the UI allows users to further filter the item’s activities by type, user, and date. This will allow operators to investigate many OH quantity inconsistencies, which will lower INFs (Inventory-Not-Found) across all DashMarts.
Impact
This project gives operators visibility into the data behind each of the actions at a DashMart. Instead of contacting a site manager or a DashMart engineer to manually look at the database, they are now able to get insight into where the items were last seen and their paths in the facility. With over 100 DashMarts open worldwide, this will greatly improve the ability for operators to view the inventory operations in a DashMart and ultimately independently take charge of their facility.
When Laura Rodriguez thought about the next steps in her engineering career nearly four years ago, she was ready for a new challenge and wanted to join a company where she could make an impact in the work she did.
“One thing I really wanted to do was understand the consumer side of things. I wanted to understand the business perspective of what drives us to work on a specific feature over other features rather than just working on pushing out code,” Laura said. “During my interview process with DoorDash I enjoyed the opportunity to wear multiple hats. I got a really good sense for collaboration, and for moving quickly. The logistics space, specifically, is an unsolved problem because there are so many open-ended challenges that are extremely daunting. There’s no shortage of complex, engaging projects to work on.”
As a Staff Software Engineer, iOS at DoorDash, Laura has spent the last few years working in the logistics Dasher area of our business, helping create navigation and engagement solutions for every moment of the Dasher experience. She’s also been instrumental in rolling out features such as dark mode, which evolved from an idea during a company Hackathon.
“Hackathons are pretty unique here at DoorDash because we’ve been able to take an idea to full production,” Laura said. “This was early on, when apps began adopting dark mode and we knew that dashers spend a lot of time on the road, especially in the winter, making deliveries at night. So we developed a quick prototype and I told my manager we really should get it into production. I got the sign off from my manager and worked with designers to come up with a delightful experience of dark mode. We got it fully developed and I was able to project manage and drive it end-to-end, develop all the code, and work to get Android on board as well.”
Integrated into the dasher side of the business means Laura’s team has gleaned deep insights through our flagship employee program, WeDash, where our salaried U.S., Canada, and Australia employees collectively use our Dasher app to complete deliveries and support existing merchants.
“My team looks a lot at the feedback from WeDashes,” Laura said. “All of the issues and feedback that our people uncover goes into our backlog for prioritization, and we work from there to figure out the root causes. The WeDash program is incredibly helpful in identifying and leading to solutions for these issues.”
At DoorDash, the opportunities are endless for our team members to own their career growth, which comes in many different forms. For Laura, that has taken shape in a variety of ways, such as working through our Elevate program, which is designed for women and non-binary employees of color to accelerate their leadership development through sponsorship, coaching, and community. During the program, participants are paired with an Executive Sponsor and an External Leadership Coach. Growth at DoorDash also has meant working on projects inside and outside of her normal day-to-day functions.
“Every time I’ve talked to leadership about an idea and the reasons we should work on it, the answer has always been, ‘How can I help?’ I’ve never found red tape or blockers.
“Having opportunities to work on these really big projects is something I haven’t experienced anywhere else. It’s amazing to feel this level of engagement to the team, the company, and to the end user.” – Laura Rodriguez, Staff Software Engineer, iOS
Ownership at work also means owning her work/life integration, where Laura currently enjoys the flexibility to work from home and come into the office to collaborate with her colleagues.
“I live in Mountain View, and before the pandemic I worked in our San Francisco office. I was commuting an hour and a half each way, every day, which is insane to think about now,” Laura said. “Getting those hours back in my day has been amazing. It is empowering to have the flexibility to work at home heads down in development, or join my colleagues in the office for a meeting or attend our team-wide ‘WeDash and lunch’ events. And outside of work hours, I snooze my notifications unless I’m on call and instead I am intentional in spending time with my family. Because of our flexible work opportunities, I can, for example, work from Portland and spend time with my nephew for a few days.”
As Laura continues to build her career at DoorDash, she also sees a runway for our business to continue evolving.
“When I joined DoorDash, we were primarily thinking about deliveries, mostly food. But I understood that our plans were longer term,” Laura said. “Our main focus was Marketplace, and now we have white-label deliveries, groceries and pharmacies, and more. So I’m really excited about our company expanding into new verticals, and leveraging our logistics engine beyond just deliveries. Come join us!”
If you’re excited about the opportunities to work on impactful projects, own your career growth, and to be part of the future of DoorDash, check out open positions today.