Throughout this exceedingly tough year, many more people grew to appreciate ordering food through DoorDash, restaurants shifted from inside dining to delivery, and Dashers, our term for drivers, found greater demand for their services. And our engineering organization worked tirelessly to improve our platform’s reliability and efficiency to serve these customers, launching new initiatives and continuing to build on our long-term strategy.
Highlights from this year include work on our microservices architecture and migrating business logic, a process begun in 2019, improving our reliability metrics on a platform facilitating millions of deliveries per day. To support the many data-driven aspects of our business, we built new pipelines and found other ways to improve our data infrastructure’s speed, reliability, and usability.
One big project involved integrating the recently acquired Caviar on our platform, giving our engineers the challenge of figuring out how to support two distinct brands on the same backend. We also launched new consumer-facing features, such as food pick-up, which required frontend innovation.
Our Data Science team pushed the envelope, finding ways to improve our forecasting abilities, ultimately leading to better delivery experiences not only for consumers, but also for Dashers and restaurants. Beyond delivery improvement, Data Science projects permeate DoorDash, improving efficiency company-wide.
Facing the fact that we’ve got a lot more engineering work in front of us, we’re expanding our team. Most notably, we opened a new engineering office in Seattle to support specific business initiatives and give new employment options for many talented engineers.
The challenges of 2020 have been unique, but our efforts have made DoorDash’s platform stronger and more reliable to support our business for years to come. We accomplished much more than recounted in these highlights, much of which we detail on the DoorDash Engineering blog.
Moving to microservices
The continued growth of DoorDash’s business brought us to the realization in 2019 that we needed to fundamentally re-architect our platform. Our original monolithic codebase was stressed from the need to facilitate millions of deliveries per day, while a growing engineering organization meant hundreds of engineers working to improve it. To support our scale, we began migrating from the original codebase to a microservices architecture, work that continues through 2020, improving reliability and developer velocity.
As an example of the kind of work required for a project such as this, we migrated the original APIs supporting our DoorDash Drive white label delivery service to the new architecture. Through careful planning, we were able to identify the APIs’ business logic and endpoints, then safely migrate them.
Our new architecture gave us many opportunities to improve our platform. As another example from DoorDash Drive, we implemented a new orchestration engine for asynchronous task retries. By moving our platform to a Kotlin based stack we could upgrade our task processing and orchestration engine from Celery to Cadence, which is more powerful and improved the platform’s reliability.
Building our data infrastructure
Data forms the functional bedrock for a large, very active platform such as DoorDash’s. Obvious data needs include restaurant menus and consumer addresses. Other types of data, such as how long it took a Dasher to make a delivery, lets us analyze and improve our services. Some databases need to support large tables with limited updates, while others, containing quickly changing information, support continual access. We’ve taken a thoughtful approach to building our data infrastructure, designing it to facilitate a variety of internal users, from data scientists to product engineers, and scale with our business.
As an example of DoorDash’s unique needs when it comes to data, we store and make accessible images, including restaurant logos and photos of menu items. Setting up a tool to let restaurants update their logos was a challenge given our gRPC/Kotlin backend. Our solution involved building a new endpoint that could handle image data and communicate with REST APIs.
Working on DoorDash’s platform without disrupting production services is akin to replacing the fuel injectors on Bubba Wallace’s stock car on track during the Daytona 500. When it comes to updating large tables in our infrastructure, adding a column or field presents risk and could be a very time-consuming task. Given this need, we found a way to perform production table updates quickly and safely, ensuring the reliability of our platform.
Delivering for our customers
Consumers, restaurants, and Dashers interact with our services through the web, and our iOS and Android apps. Serving these users requires a flexible frontend architecture that supports experimentation, scales, and enables personalization features. Leveraging our new microservices architecture, we created a concept we call Display Modules, frontend building blocks which we can iterate quickly to deliver a delightful and usable experience.
Beyond this kind of foundational work, our engineers found plenty of opportunity to innovate around new consumer-facing features. For example, our launch of a new pick-up feature, where consumers can place an order at a restaurant and pick it up themselves, required displaying a map of nearby restaurants, as distance became a more crucial factor in choice. Implementing location-based services on the web became an interesting challenge for our engineers, with some valuable lessons learned.
The addition of Caviar to our platform increased delivery opportunities for Dashers, and extended the brand’s reach to consumers and upscale restaurants in new cities. To achieve economies of scale, however, we needed to make a fundamental change, serving two brands, Caviar and DoorDash, from the same backend. Our engineers redesigned these two frontends using React components, which gave us the flexibility to shift the web experience depending on the consumer’s entry point.
Leveraging machine learning
Machine learning is essential for the type of data-driven decisions on which DoorDash builds its business. Modeling based on historic data enables everything from the very functional, such as how much consumer activity we can expect at a given time in a specific city, to the financial, including where our marketing budget can give the greatest return. Our team of data scientists continually innovate with an eye towards the practical needs of the business.
Some of the work we do involves solving general issues in data science, such as how to derive value from experiment results that show little variation between different groups. In this case, we applied causal modeling, a means of determining the impact strength of different product features on experimental groups. This method gives us greater insight into subpopulations when traditional A/B tests show flat results.
Machine learning implies intensive automation, but sometimes we find a need for more traditional solutions. For example, creating tags for our vast database of food items was a task that could only practically be accomplished through machine learning. However, the limits of this solution required that we find the optimal place in the workflow for human agents to ensure the greatest accuracy.
Optimizing efficiency
Along with the work of building models and innovating our methodologies, our platform must serve machine learning models in production quickly and efficiently. Our new microservices architecture, based on gRPC and Kotlin, showed significant network overheads in this area. Addressing this issue with client-side load balancing, payload compression, and transport-level request tracing led to an impressive performance gain, reducing network overheads for model serving by 33 percent.
As the demands on our platform grew, we found that our asynchronous task processing, handled by an implementation of Celery and RabbitMQ, was in need of an upgrade. Among the multiple potential solutions we considered, we landed on Apache Kafka, along with a deployment strategy allowing for a fast, incremental rollout that let us tackle new problems sequentially. Moving to Kafka gave our platform greater reliability, scalability, and much-needed observability.
Looking to the future
Our DoorDash Engineering blog only recounts a fraction of the wins achieved by our engineering team. Maintaining and improving our three-sided marketplace, and launching new business initiatives based on our logistics platform, involves continuous innovation. Frontend engineers may deliver DoorDash’s most recognizable experiences, but database and backend engineers ensure our platform operates at peak efficiency, while data scientists come up with novel means of improving our services.
The growing demand on our platform throughout 2020 made it clear that we will need many more engineers to meet our needs. Preparing for this expansion, we planned our newest engineering office, based in Seattle, joining our San Francisco Bay Area and New York City-based engineering teams. Given the constraints of COVID-19, our Seattle office will remain virtual for the time being, but we hope our new engineers can convene there in the next year.
Interested in joining our dynamic team of engineers and data scientists? Take a look at the many roles open on our careers page!
At the beginning of 2020, DoorDash’s Design Infrastructure team introduced a Theming feature to our Prism design language system, an internal library that makes frontend development projects more efficient while ensuring consistent design across all of our products. Theming provided an API for engineers to define how Prism components would appear on the screen. With the introduction of this new feature, any team building a product for the web could easily bring the Prism design language system into their project and take advantage of the large number of pre-built components, typography elements, and visual color definitions.
Our design language system, which we call Prism, is one of the most powerful tools that our frontend engineers utilize in their projects. Prism’s centralized web, iOS, Android, and Figma libraries contain definitions for the lowest-level elements of our design ecosystem (like our color systems and typography sets) all the way up to higher-level components for utilization in the most common UI interaction patterns (from buttons to navigation bars and alert dialogues).
Designers and engineers alike can use the Prism’s components to quickly build projects with a consistent and cohesive look and feel matching the DoorDash brand. Rather than ten separate teams building ten custom implementations of a “DoorDash-y” button, Prism provides a single implementation that teams can quickly drop into their projects, freeing them to focus on the designs and features that make their project unique.
When first built, Prism was primarily focused on the visual designs and use cases of a small number of DoorDash products. This narrow focus meant teams building projects outside of this scope were unable to leverage the benefits of the system, and had to create their own versions of common UI elements. Narrow adoption of Prism created tech debt, introduced the potential for design drift, and created inefficiencies as teams not using Prism had to use resources creating their own UI elements.
The introduction of Theming to the design language system supported all of our existing projects, while also providing the extensibility to support future products. This innovation played a huge role when we acquired Caviar in 2019, helping us integrate it with our platform.
The advantages and limitations of Prism
When Prism was first introduced, it was built around the main components and patterns that supported our consumer use cases. “Consumer” in this case refers to the set of apps and products used to place orders from restaurants. These consumer-facing apps are how most people experience DoorDash. However, DoorDash is actually a three-sided marketplace, building and supporting an entire ecosystem. These three sides include:
The consumer side, where users can open up the DoorDash app or website to place a delivery or pickup order (mentioned above).
The merchant side, which provides tools and products for businesses to sign up with and fulfill orders through DoorDash.
The Dasher side, which provides the Dasher app and other tools for drivers to deliver orders from the merchant to the consumer.
Engineering teams supporting each side of this marketplace are responsible for an entire suite of unique tools, products, and services. And each has different needs and priorities to ensure that what they build provides the best experience for their end users. To that end, the look and feel of a button that’s used by the consumer iOS app might not match the needs of a button that’s used by the merchant desktop web application.
With Prism’s initial focus on the consumer side, teams building projects outside of this scope, such as merchant, Dasher, or tools used by support agents, were unable to leverage the benefits of the design language system. Instead, they had to create their own custom implementations of common UI elements, such as buttons, input fields, and pagination controls. These one-off custom components meant lost productivity for the teams as they built these patterns from scratch, created tech debt through maintenance and upkeep of these custom elements, and introduced risk that code implementations could drift farther and farther away from a cohesive DoorDash design and experience with every update.
Another significant risk of designers and engineers creating their own custom implementations of these common components was that there is no central “source of truth” for how a component looks and behaves. Prism components don’t only align with visual and interactive patterns that we’ve established for DoorDash products, but they’re also built with key concepts like accessibility and internationalization in mind.
On the interactivity side, if two separate teams are building their own versions of a button then it’s possible that one of those implementations will be missing a key accessibility feature, which could hurt some end users’ abilities to use the application. On the visual side, any updates or refreshes to design patterns in our products would have to be manually, rather than programmatically, updated across every single project using those components and patterns. Visual updates would take excess time and resources for each team, and could very quickly cause design drift between products where one team has updated their designs to the latest look and feel, but the other hasn’t, resulting in a jarring experience for the end user between screens or applications.
As DoorDash continues to grow in size and scope, we want to grow the design language system alongside it. The system is meant to make the lives of our engineering and design partners easier, providing libraries they can easily drop into their projects so they don’t have to spend precious time building and re-building common components and patterns.
Engineers don’t have to make any changes to their code, merely needing to bump the version number in their project dependencies. However, because the design system had minimal support for visual needs other than consumer use cases, many teams were unable to leverage this powerful tool in their code bases. Prism wasn’t meeting our core goal: to make the lives of allour partners easier. So back in the fourth quarter of 2019, we knew we had to introduce Theming to Prism to take it to the next level.
How Theming extends Prism
Theming within our design system means the ability for an engineer using Prism in their code to adjust one or more visual aspects of a common component to align with the look and feel of the rest of the application. In other words, Theming would enable our design system to be used in any DoorDash product, because it could be adjusted to match the visual styles of the product. Before Theming was introduced, an engineer working on a merchant product would have to choose between either:
Making their own implementation of a Prism component (with all of the drawbacks listed above), or
Use a Prism component not specifically designed for their use case, which might not align with the rest of the color scheme or other visual patterns in the rest of the project.
In the first quarter of 2020 we released a major new version of Prism for web that had Theming built in. But introducing something as intricate and expansive as Theming to a robust system that’s already being widely used by developers is a huge challenge. To understand what we faced, we have to look back to October of 2019.
Laying the groundwork: Tokens and Semantics
Before we get into the bones of how we built Theming into our design language system, let’s take a step back and talk about two foundational concepts that exist in Prism (and many other design systems): “Tokens” and “Semantics”.
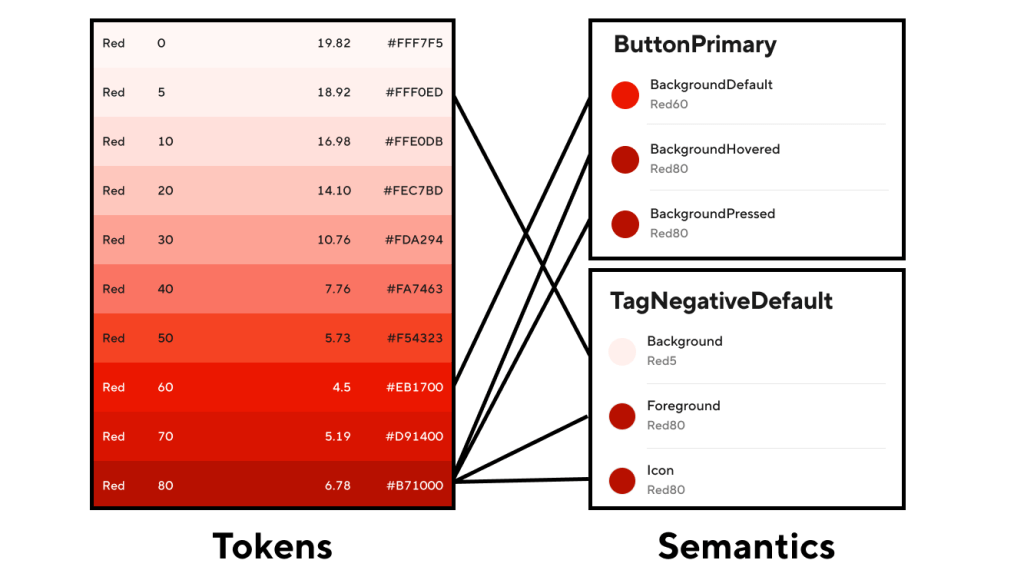
Figure 1: Tokens define the lowest-level value definitions, and each Semantic value is set to one of the Tokens.
Tokens refer to the lowest level of detail within the system; the very basic “atoms” that everything else is built on top of. Tokens provide the final “source of truth” for things like color, spacing, and other design concepts. So within the Prism Color system, for example, Tokens comprise the entire suite of color options available for use in our UI. These Tokens have names like “SystemBlue80” and “SystemBlack”, where the name itself refers to the value it represents. And unlike Semantics, higher-level components, and system-wide patterns, Token values don’t change: they stay the same no matter how or when they’re used.
Semantics, on the other hand, reside in the next level up in the system and are built on top of Tokens. Their values map to a Token’s given value. So for example, no part of a Semantic name like “ButtonPrimaryBackground” indicates what the color value is, but under the hood that Semantic could be mapped to “SystemRed60”. Semantic names are used to describe their context in the system, but have no indication of what their value is mapped to.
Figure 1, above, shows how this relationship works for the colors in Prism: the value of each color Semantic is mapped to a Token, and each Token value is set to a specific hex color value.
(One important note about these Semantics: because Prism is integrated across all four of the platforms we support, Figma for designers, Android, iOS, and web libraries for engineers, we have to make sure any new Semantic or Token we introduce to the system will work for every platform. This means close collaboration within the Design Infrastructure team: Design System Designers and Design Technologists work hand-in-hand to update Prism everywhere.)
So let’s say we want to update a “Button” component in our system to be themeable. The first thing we have to do is update any styles we’ve set on that component to map to a Semantic, and not a Token. So we took the existing Prism libraries and updated any references to Color and Border Radius Tokens to now reference Semantics.
Here’s an example const declaration from our tooltip component before, when it was using Tokens:
Notice that the logic hasn’t been changed at all, we just updated the tooltip’s colors to use Semantics instead of Tokens. But by making these small changes across the library (and across any web projects that were using these color Tokens directly in their custom components), we were now set up to create a tool for dynamically updating what Token a given Semantic was referencing, based on whatever theme was currently being applied.
By using Semantics instead of Tokens for visual aspects of components, we were in a place to say things like “For the default theme, we want this button’s background to be ‘SystemRed60’. But for the Merchant theme, we want this button’s background to be ‘SystemBlue60’.” In both cases, the code under the hood in `component-button` would set the button’s background color to “ButtonPrimaryBackground”. But the Token the Semantic pointed to would be different between theme definitions, because we were no longer pointing to a specific hex value for the color.
Now that all of the packages and components in our web system code were using Semantics instead of Tokens for their Color and Border Radiuses, it was time to officially start building Theming.
Supporting independent packages with React Context
The way our design system is built and used in web projects is actually pretty interesting. While the code lives in a single repository, there are actually separate and independent packages that engineers can download into their projects. If an engineer needs to add Prism Buttons to their page, but doesn’t need a navigation bar, they need only add the “component-button” package to their project’s dependencies. This setup minimizes the amount of additional code engineers have to add to build their features, reducing bundle size and complexity.
But with this independence came a unique challenge for Theming: how do we create a system that customizes the look and feel of any Prism component, when we have no guarantees about what packages engineers are using?
Luckily for us, React includes a first-class Context API. This feature provided exactly what we needed: a way to set global information in a project and to share that information between components, without relying on layered property passing (something that, again, wouldn’t work because of our independent package setup).
As we were investigating how to set up Theming, we looked at several options. One option we considered was using CSS variables, but because Prism is built to support IE11 we did not pursue this avenue. We decided on the Context API for its straightforward way to define a propagating theme across packages and components in one place, the flexibility it would give to allow engineers to set multiple themes within a single project, and because it encouraged us to keep our system up to date with the latest versions and concepts of React, the framework that the majority of our web projects are built on.
Using this API, we set up a brand-new Context Provider in our main Prism package (called “design-language”, which exports the foundational pieces of the system like “Colors”, “Text”, and “Spacing” that are used across all other Prism packages) called “Theming”. In the first introduction of Theming, we set up an export with an “overrides” API that would allow engineers to define any custom overrides to Semantic Colors and BorderRadius values.
So one team could set their project’s Theming overrides to something like this:
And both projects could use the same Prism button component, but with the button styled the way they wanted.
Update Prism components to use Theme overrides
Now that we have a wayto define themes in the system, we need to put those themes and contexts to use. The next step was to create ways for a component to access the overrides set in Theming, and to use those overrides when rendering.
To that end, we created a set of exports that could be used for gaining access to theme values: “ThemingContext” (for use with contextType in Class components, or with the modern useContext hook for non-class components), and “ThemingConsumer” (a Context Consumer which returns a function with our Context values). Once these were created alongside the “Theming” Context Provider, we began going through every single Prism package and updating all of them to use the theme’s values instead of the original values found in the “Colors” and “BorderRadius” exports.
In a Class Component, we set the class’s contextType property as ThemingContext:
With the implementation of Theming to Prism, there’s the potential that engineers would have to use Theming in their projects anddefine every single semantic value in their overrides.
To avoid this scenario (and keep our engineers happy), we built this addition to Prism so that Theming was (and still is) completely optional. There is a default definition for ThemingContext, which contains the original values for all of the Semantics used across our system. We wrote Theming in such a way that the engineer only has to override the properties they want overridden, and it will fall back to the original, default values for everything else. So an engineer could just set an override for a specific button type’s background color (or not set Theming in their project at all), and every package and component in Prism (Tooltips, Modals, Tables, etc.) will continue to work exactly as expected.
The biggest benefit from how we updated the system with Theming is that all an engineer has to do is set any overrides they want set in a single place, and all Prism components they’re using below in their application will automatically be themed, as shown in Figure 2:
Figure 2: The same Prism components automatically update their styles when Theming overrides are set. Each section is using the exact same components and configurations in code; the only difference is the overrides set in a single `Theming` block surrounding each column.
Leveraging Theming for Caviar integration
By the end of 2019 we had Theming set up using the React Context API, all of the packages in the Web Prism repo had been updated to use Theming, and we were close to having the final, new major version ready for release so engineers could start theming Colors and BorderRadius values.
As each team assessed how they would approach integration, we on the Design Infrastructure team realized that, expectedly, Caviar looked nothing like DoorDash. It had a different logo, a different color suite, a different set of icons, and even used a different typography system. In its current form the Prism DLS would not meet Caviar’s needs.
To get over this hurdle, the Design Infrastructure team and the Caviar Design and Engineering teams spent the first quarter of 2020 working closely together, on our side gaining an understanding of their product, and on theirs building an understanding of our design system. All teams worked hand-in-hand to figure out what had to change in order to support Caviar’s distinct brand in a single system that had, until this point, only ever had to support the DoorDash brand.
Figure 3: Theming had to be built in such a way that we could support all of the unique icons, colors, fonts, logos, and common UI elements that were different between the DoorDash and Caviar consumer applications. Gif courtesy of Gerardo Diaz, one of our team’s amazing Design System Designers.
Figure 3, above, shows the difference between the two experiences, and how many pieces we needed to update in Prism to support both the DoorDash and Caviar web applications. Check out the Caviar applications on Android, iOS, and web, and know that all of those projects are built using the Prism Design Language System.
Building the system to meet user needs
When building a design system, the top priority should be creating a product that’s high quality, useful, and meets the needs of the products it serves.
To that end, we had to consider not only the base-level ability to customize Prism components, but how to build the tools and APIs to make this new and powerful feature exciting for everyone to use. So in addition to providing a straightforward place to set overrides, we also provided:
Multiple ways for engineers to access the current theme (through the ContextType and Context Consumers mentioned earlier)
A HOC that users could leverage for their custom elements using styled-components (to avoid theme property passing)
Preset themes such as “Caviar” and “Merchant” that engineers could use to make setting common override sets that much simpler. Figure 4, below, shows how application of these themes changes the visual treatment for the Prism Numbered Pagination component.
Figure 4: We enabled preset themes for use across all Prism components. In the example shown above, we can see default, Caviar, and Merchant themes, each being applied in turn to the Prism numbered pagination component.
By providing these tools in Prism, engineers are able to leverage something as powerful as Theming for the Prism components they were already using, can now use components they couldn’t before because they didn’t meet their design needs, and they can apply Prism concepts and values to the custom features they’re building to make DoorDash products great.
Looking to the future
Theming, like the rest of Prism, is a living organism. The very first version of Theming that we released included the ability to theme Colors, BorderRadius, and Logos. The second one added the ability to customize Typography and also introduced a preset “Merchant” theme. The third version added a preset “Caviar” theme, and included a “withTheming” HOC for enhanced styled-components integration. And with almost thirty minor versions released since we first published Theming to Web Prism in February 2020, the system has only grown and expanded. Even as we write this article, we’re working on integrating new Theming levers like “Shapes” and “BorderWidths” to provide even moreflexibility and customization for all of our internal partners.
“Theming” was an incredible project to take on: we learned so much, got to work closely with so many amazing people, and at the end introduced a major upgrade for Prism to be an even more powerful tool for the incredible designers and engineers we get to work with every day.
Acknowledgements
I want to give a huge thank you to the following people who helped make Theming a reality:
Kathryn Gonzalez: my incredible manager and the leader of Design Infrastructure, for all of her guidance as I built Theming for Web, for creating the original design system our team works on today, and giving me the chance to write this article!
Matt Lew and Gerardo Diaz: the amazing Design System Designers on our team who drove the expansion of our Semantics suite and its integration into our designs
Keith Chu and Ting Shen: two incomparable Caviar engineers for working so closely with me during Project Fusion, providing insight and feedback as I updated Theming to meet their needs.
Gaby Andrade, Ezra Berger, Helena Seo, and Wayne Cunningham: for providing feedback and being beta-readers for this article.
Everyone across Web Engineering who has brought Theming and the Prism system into their projects!
For every growing company using an out-of-the-box search solution there comes a point when the corpus and query volume get so big that developing a system to understand user search intent is needed to consistently show relevant results.
We ran into a similar problem at DoorDash where, after we set up a basic “out-of-the-box” search engine, the team focused largely on reliability. While the search results looked reasonable on the surface, it was common that particular queries in select locations would lead to poor search experiences. At DoorDash’s scale, even having relatively rare negative search experiences would still negatively impact a lot of our users, so we had to improve.
To fix this search relevance problem, we revisited each part of our search flow to understand why it was not performing well. Our analysis focused on the quality of the search results that were produced when a subset of our most frequently searched queries over the previous month were entered. We chose this subset because, like most search systems, our query data is long-tailed, and these frequent queries constitute a substantial portion of our overall search volume, as shown in Figure 1, below:
Figure 1: The distribution of queries we see at DoorDash is representative of what is seen in most search systems. The most popular queries, that have the most query volume, represent a small percentage of the site’s total queries and are called the “head queries”. The remaining queries, which represent the vast majority of all unique queries but are not often searched are part of the “long tail”
Based on the findings from our analysis, we re-engineered our search pipeline with an initial focus on improving the quality of results the consumer sees when they search for a high frequency query. Even with this limited scope, our improvements led to a statistically significant increase in the overall conversion rate. In other words, consumers were more likely to find the type of food they were looking for, and placed an order.
First, we will go over the shortcomings of the legacy system, and then we will talk about how we improved this system for a subset of the head queries.
Overview of our search pipeline
When a user comes to our site and writes text into the search field, that query goes through two steps of our search pipeline to return search results. The first step, recall, retrieves the store and item documents which are relevant to the consumer’s query and within a set distance from their location. The second step, ranking, reorders the documents to best meet a consumer’s needs.
A deeper dive into the recall step
In the recall step, we use Elasticsearch to retrieve the store and item documents which are within an orderable distance from the consumer, and best match the consumer’s query intent.
This process starts with our filtering process, which ensures that all stores are within an orderable distance of a consumer. This filtering process involves a complex interplay between the preferences of the store, the delivery fee, and the distance of the store to the consumer. These nuances deserve a separate discussion, and are left out of this article for the sake of brevity.
Next, our matching process involves making token and n-gram matches of the query against relevant text fields, such as title, description, and store tags, of the documents in our database. This matching approach was sufficient a few years ago because the size and complexity of our online selection was relatively small, but it is not sufficient anymore. DoorDash has grown to serve over 4,000 cities, and has expanded from restaurants to include grocery deliveries. To get a sense of how fast we have grown, we have added about 100 million new items to our index in the last year, roughly doubling the size of our entire item index.
The issues with query ambiguity at scale
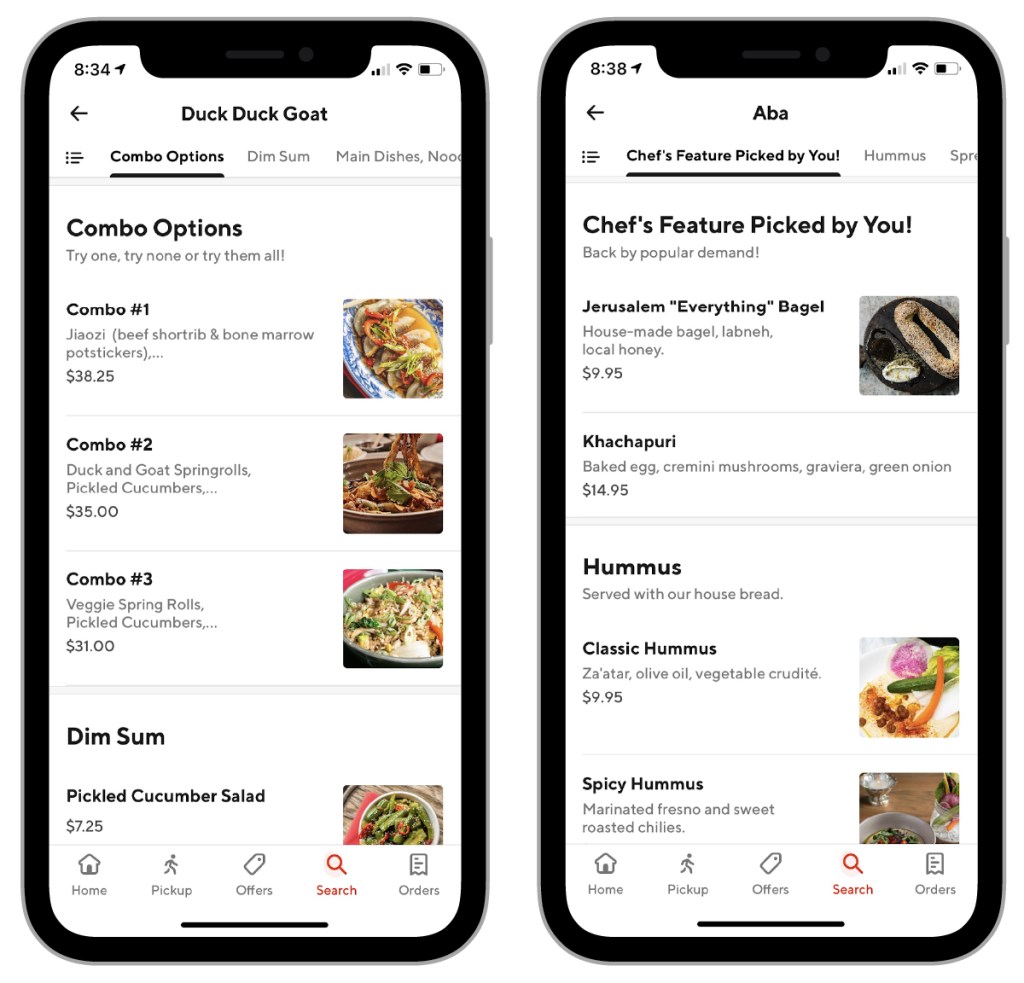
The sharp increase in the size and complexity of our data has accentuated the problems related to query ambiguity. One such problem is that consumers start seeing confusing results which do not match the search query. For example, when consumers searched for “California rolls”, they got results that showed Mexican food restaurants, instead of sushi places, because terms like “California” and “Roll” occurred somewhere in those restaurants’ menus, as shown in Figure 2, below. The issue here is that the search engine treated the query as a Bag-of-words, looking at each word individually rather than as a concept in its entirety.
Another issue was that the search engine had issues discerning exact matches. For example, when we typed in “salsas”, four stores showed up in the results as opposed to the 83 that would appear if the query was just “salsa”, as shown in Figure 3, below. The search engine did not understand that this was the same query, with one just being the plural of the other.
Figure 2: When searching for a “California Roll”, a type of sushi, the consumer might see Mexican restaurants because the words “California” and “Roll” are nestled somewhere within their menus. This happens because the search engine treats the query as two individual words rather than a single phrase or concept.Figure 3: There is a dramatic difference between searching salsa versus salsas. Not only are the top ranked results completely changed by this minor difference, but the number of stores are dramatically different (83 for salsa vs four for salsas). The difference in store counts can be attributed to the fact that most menu items typically use the singular form to describe salsas, like Salsa Verde.
These inconsistencies can lead to frustration and a higher churn rate from our app, since the search results are not really capturing the consumer’s search intent.
How out-of-the-box search ranking struggled with concept searches
After the items and stores are collected in the recall step, we rank them according to the consumer’s needs. However, our search system had no dedicated component to rank the candidate stores returned from the recall step. Instead, the search engine used its original predefined relevance score, which relied on string similarities between the query and search entities, particularly store names.
As a result, the out-of-box search pipeline worked reasonably well when consumers searched for brands such as McDonald’s, Cheesecake Factory, or Wendy’s. However, the out-of-the-box search performed poorly when the query was a non-branded term for broad business categories, such as pizza, noodles, or Chinese.
Non-branded search represents many of the searches, which made fixing this a priority. To fundamentally improve search relevance, we designed a dedicated precision step. This step leverages cutting-edge machine learning techniques and takes account of search context information from multiple aspects, going beyond simple string similarities.
Rethinking the search flow
From our analysis in the previous section, it became clear that there were opportunities for improvement on both the precision and the ranking fronts. On the recall front, one of the key shortcomings of our legacy approach was that we were treating the queries as a Bag-of-words, and not attempting to understand the intent implied by the user. On the precision front, we didn’t have a sophisticated ranking model to incorporate information from the search context beyond the lexical similarities between query and search entities.
We started to fill in the gaps in our understanding on both the ranking and recall fronts, and built a more advanced and well-architected search system to modularize different but essential search components.
Building a base dataset to improve the search pipeline
We decided to focus our improvements on DoorDash’s 100 most popular queries from the previous month. We chose this set for our analysis because it accounts for a substantial percentage, greater than 20%, of our overall query volume. Additionally, it would be easier to begin with a narrow set since that would allow for rapid iteration before investing in a more scalable long-term solution.
Rethinking our fixes on the recall and precision fronts
For the first iteration, we wanted to create the simplest possible search pipeline that could help fix our recall and precision problems. Accordingly, we made the following changes in the two steps of our search pipeline:
On the recall front, we built a three-part pipeline which identifies, interprets, and elaborates upon any query within the base set. This pipeline would help test our hypothesis that the recall can improve if we treat queries as “things” and not “strings.”
On the precision front, we developed a new ranking model using a pointwise learn-to-rank mechanism by including search context information. This new ranking model would help us improve relevance ranking beyond sole lexical similarities, better fulfilling the user’s intent.
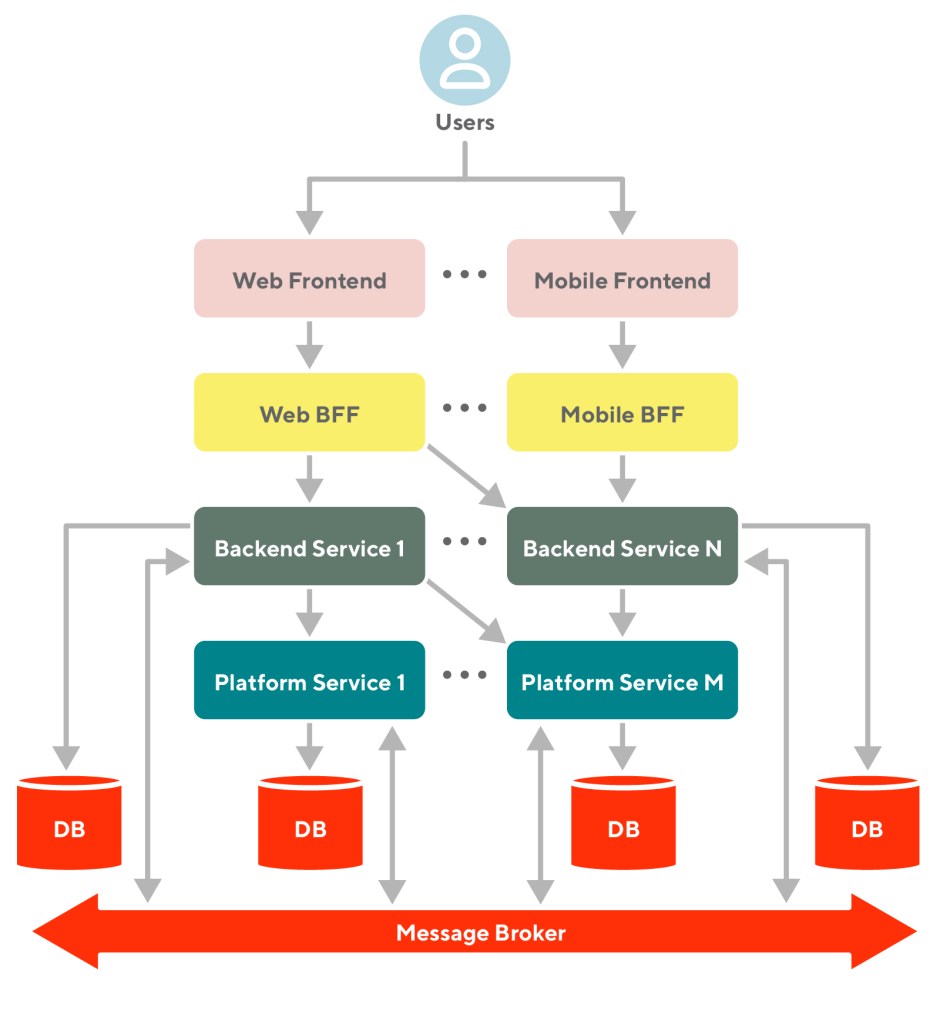
These changes formed the basis of our redesigned search pipeline, outlined in Figure 4, below:
Figure 4: When the search service receives a query, the “recall phase” is responsible for retrieving the documents relevant to the consumer’s intent, and the “precision phase” (or “ranking phase”) reorders the documents to best meet the consumer’s intent.
Redesigning the recall step of our pipeline
Our design of the new recall pipeline had two main goals:
Make search results more relevant for our consumers: The search results should reflect the consumer’s intent even when the consumer makes a minor spelling mistake.
Make our search results more intuitive: When the consumer searches for a concept, they intuitively understand why they are seeing those results and don’t think the search engine misunderstood their query.
To accomplish these goals, we constructed a three-part pipeline, as detailed in Figure 4, above. The three steps are:
Transform the query to a standardized form
Understand the underlying concept of a standardized query
Expand upon the concept that underlies the consumer’s intent
We will describe each of these steps in greater detail below.
Standardizing queries
We noticed that consumers often do not mention a concept in the base set directly, but refer to it using a colloquial synonym. For example, “Poulet Frit Kentucky” is how Canadians refer to KFC. Additionally, there are often minor spelling mistakes in search queries, such as writing KFZ instead of KFC. Despite these minor differences, it is clear that the consumer is referring to the same concept, KFC.
To ensure that these minor differences do not distort our pipeline’s understanding of the underlying concept, our first initiative was to remove noise from each query, and convert them into a canonical or standardized form. Our standardization process involves performing some basic query pre-processing, followed by spell correction (using the Symmetric Delete spelling correction algorithm) and synonymization (using a manually created synonym map). For the examples mentioned above, “Poulet Frit Kentucky”, “KFZ”, and “KFC” would all get canonicalized to “kfc” in our new pipeline, as shown in Figure 5, below:
Figure 5: The search results for “Kfz” and “poulet frit kentucky” produce the same results as “KFC” because they are being reduced to the same canonical form in the search engine pipeline.
Item names need not follow the English dictionary
For our initial tests, we had very relaxed parameters for the spell checker, and the query “Chick’n” was getting canonicalized to “chicken”. While this might seem like a reasonable canonicalization, we actually do have items with the term “Chick’n” in them, as shown in Figure 6, below. A consumer searching for “Chick’n” could actually be searching for a branded item named Chick’n rather than anything labeled chicken.
Figure 6: Having canonicalization be too sensitive would be problematic because some item names are intentionally misspelled, like “Chick’n,” and would not be easily found in search if the query was changed to “chicken”.
This form of ambiguity is common among the item names in DoorDash’s database of food items, and although our spell correction algorithm provided a reasonable correction in most cases, there was no way for us to be 100% sure that we had accurately identified the consumer’s intent. Furthermore, we currently do not have a “did you mean?” button on our platform, and therefore, if our canonicalization is incorrect, there is no way for the consumer to toggle back to the original request.
To avoid ambiguities such as these in our first pass, we made our spell correction criteria very stringent, only activating it when we found no matches between the query and any of the items in our corpus.
Query understanding with concept identification and entity linking
Given the canonical form of the query, we want to:
Use entity-linking to identify the concept in the base set mentioned by the user
Create a knowledge graph traversal to derive similar concepts to the one being queried
Thus, when a consumer enters a search term such as ”Kentucky Fried Chicken”, we know that:
They are searching for a specific concept, in this case food from KFC
That there are related concepts they would potentially be interested in, like other merchants who make fried chicken
Identifying the concept
For our first version, we performed entity-linking by matching the canonical form of a query to the canonical form of its store name. This simplistic approach was sufficient for our use case because we were working with a small entity set wherein issues seen at scale (like entity disambiguation) were a non-issue.
Identifying similar concepts
To identify similar concepts to the one described by the user, we manually created a knowledge graph, which captures the relationship between various concepts or entities within the greater food lexicon. In our knowledge graph, the vertices represent entities (for example, KFC), and the edges in the graph represent relationships between different entities (for example, KFC is a restaurant serving chicken). The entities in the knowledge graph are typically associated with several “types”. For instance, KFC’s “type” is “store”, and it also has a type labelled “Yum! Brands”, KFC’s parent company.
We created the first version of our knowledge graph with two main objectives:
Cover all queries in our base set
Leverage the pre-existing definitions in the DoorDash literature as much as possible
Accordingly, our knowledge graph contained three types of entities and three types of relationships, as described below.
The knowledge graph entities
The Store: As the name describes, this entity is where food is sold. Each store is associated with a primary cuisine, or storecategory in our terminology.
The Store Category: These are clusters of food concepts using a coarse-grained descriptor of the foods sold in a store, such as “Chicken”, “Chinese”, and “Fast Food”. Each category consists of one or more store tags, which describe the popular foods within each grouping.
The Store Tag: A fine-grained descriptor of popular items sold by restaurants on DoorDash’s platform. Examples of tags include “Fried Chicken”, “Dim Sum”, and “Tacos”.
The relationships
Each store belongs to a single category called the primary category.
Each tag belongs to exactly one category.
Each category can have at most one parent category.
A handful of the top 100 queries did not fall under one of the above three mentioned entity types (for example, McFlurry). To keep our approach as simple as possible, we did not include these queries in our base set.
A subset of our knowledge graph is shown in Figure 7, below. In our knowledge graph, the blue rectangles indicate stores, the red diamonds indicate the store categories, and the green ellipses indicate the store tags. In the DoorDash literature, we can have a sandwich category and a sandwich tag. Therefore, we have added suffixes to the entities of various types: “_biz” for businesses, “_cat” for categories, and “_tag” for tags.
For example, the store IHOP, annotated as “ihop_biz”, has the sandwich tag because it is associated with a primary category “breakfast_cat”, which in turn is the parent of the “sandwiches_cat” containing the “sandwiches_tag”.
Figure 7: Our knowledge graph connects queries to similar merchants and food concepts, enabling the search service to better capture the user’s intent.
Expanding on the concept underlying the query
Once the underlying and related entities to a consumer’s query are known, we are no longer constrained by simplistic notions of string matching, like n-grams, to find relevant documents. Our strategy in creating the user query was to give the highest preference to the underlying entity, and using the related entities as a fallback when sufficient results are not found.
When a consumer searches for a store such as KFC, our search query gives the highest preference to the store name, so that KFC is in position 1. The search then returns all stores having one or more of the tags (fried chicken, wings) belonging to the store’s primary category (Chicken), as shown in Figure 8, below:
Figure 8: A search for KFC shows the KFC business first, since that is most relevant to the queried concept.
When a consumer enters a query for a category, such as Asian food, our search service looks for all stores containing one or more tags that are descendents of the category in question, as shown in Figure 9, below. In a search for Asian food, Charm Thai Eatery shows up in the search results because it contains the Thai tag, which is in the Thai category, a descendent of the Asian category). The HI Peninsula restaurant shows up because it contains the Dim Sum tag, which is in the Chinese category, a descendent of the Asian category. La Petite Camille shows up because it contains the Vietnamese tags, of the Vietnamese category, which is a child of the Asian category.
Figure 9: For category queries, the search engine looks for documents that have a tag related to the search category. For the “Asian” query, different types of Asian food show up in the results.
When a consumer searches for a tag, such as sushi, we give the highest preference to stores containing the tag Sushi, and then search for all stores containing any of the tags belonging to the parent category, Japanese, as shown in Figure 10, below.Ramen is a tag under the Japanese category, so stores tagged Ramen would also show up in the results.
Figure 10: When searching for a tag like sushi, the highest preference is given to stores containing the tag sushi, and then to other stores containing tags such as Ramen, which belong to the same parent category, Japanese.
Redesigning the ranking step of our pipeline
Making improvements to the ranking portion of our search pipeline was more difficult than in the recall portion for a couple of reasons:
There is a strong dependency with previous recall steps, and it is hard to develop both at the same time. Particularly, when it comes down to a machine learning (ML)-driven approach for ranking, the model we trained on the dataset generated by the old recall logistic is not generalized to rank well on the new list of candidate stores.
When we were developing this solution, our search service was not integrated with Sibyl, DoorDash’s real-time prediction service. Therefore, we were greatly limited in the ML ranking models we could support from an infrastructure perspective. We decided to address this problem on two fronts. On the ranking front, we trained a basic logistic regression model with store and lexical-based features with the goal of collecting training data for our eventual learn-to-rank model. On the infrastructure front, the team was actively working with the ML platform team to integrate Sibyl with our search backend to empower ML solutions for relevance ranking in the near future.
Because it was not in the prediction service there were limited ML opportunities for search ranking from the infrastructure perspective at the time. Instead, we decided to move forward with a simple heuristic ranker, which takes into account lexical similarity and store popularities. In this way, we could quickly roll out the entire search stack in production for testing and collecting data to train a learn-to-rank model.
Results
We ran an experiment with three buckets: control, new recall plus current ranker, and current recall plus new ranker.
Comparing the new ranker with our current ranker, we did not see any statistically significant improvement in how many consumers placed orders based on their search results, the conversion rate. This suggests that data staleness alone was not the reason the current ranker was underperforming. As of today, we have used these learnings to set up the first version of our face-lifted ranker in Sibyl and are currently in the process of experimentation.
The recall portion validated our hypothesis that treating search queries as “things” and not “strings” dramatically improves search performance, a result that has become conventional wisdom in the scientific community. Despite overly simplifying every step in the pipeline, we saw a 9% improvement in click-through rate, 10% improvement in conversion rate, and 76% reduction in null rate, the search queries that return no results, for our overall store queriesat DoorDash. This translates to a statistically significant increase in overall the conversion rate. Motivated by our results here, we have been working to expand our recall section even more, and plan to share more progress on this effort soon.
Conclusion
Upgrading search to better understand the query intent is a fairly common problem for growing digital commerce companies. We show here that, oftentimes, there is a lot of room for improvement even in the head queries, especially if search has not progressed from what was implemented out-of-the-box. An added benefit to improving the head queries is that the infrastructure and tooling needed to improve the head queries are identical to those needed to improve the long tail. After implementing this pipeline, our next step is to continually refine our approach while expanding our base set to include more of the long tail.
DoorDash operates a large, active on-demand logistics system facilitating food deliveries in over 4,000 cities. When customers place an order through DoorDash, they can expect it to be delivered within an hour. Our platform determines the Dasher, our term for a delivery driver, most suited to the task and offers the assignment. Complex real-time logistic fulfillment systems such as ours carry many constraints and tradeoffs, and we apply state-of-the-art modeling and optimization techniques to improve the quality of assignment decisions.
While the field of delivery logistics has been well studied in academia and industry, we found the common methodologies used to optimize these systems less applicable to improving the efficiency of DoorDash’s real-time last-mile logistics platform. These common methodologies require a stable prototype environment that is difficult to build in our platform and does not allow for the accurate measurement of the algorithm change.
To address our specific use case, we designed an experiment-based framework where operations research scientists (ORS) dive into the assignment production system to gain insights, convert those insights into experiments, and implement their own experiments in production. Our framework allows us to rapidly iterate our algorithms and accurately measure the impact of every algorithm change.
Common solutions to logistics optimization problems
In our previous roles as ORS developing optimization algorithms in the railway and airline industries, we normally worked in a self-contained offline environment before integrating algorithms into the production system. This process consists of three stages: preparation, prototyping, and production (3P).
Figure 1: A typical workflow for algorithm optimization in industry involves a three-step process, Preparation, Prototyping, and Production.
Preparation:
Collecting business requirements: ORS need to work with business and engineering teams to collect the requirements, such as how the model will be used (as decision support or in production system), the metrics to optimize, and constraints that must be followed.
Find data: ORS need to understand what kind of data is needed for modeling and what data is practically available.
Making assumptions: Given the requirements, ORS must make assumptions on the requirements that are unclear or on data when they are not available.
Prototyping
Once we have the requirements, find data, and make appropriate assumptions, we can create a model to solve the problem.
Once the model is available, sometimes a prototype environment needs to be built to help iterate on the model. The prototype environment can be as simple as a tool to calculate and visualize all the metrics and solutions, or as complex as a sophisticated simulation environment to evaluate the long term effect of a model or algorithm.
During the iteration process, ORS may need to work with a business or operations team to validate the solutions from the model and make sure that the results are consistent with expectations.
Production
When the model has been validated in a prototype environment, the engineering team needs to re-implement and test the prototype model and algorithm. ORS will need to validate the re-implementation and make sure the performance of the production model is similar to the prototype. In certain rare scenarios, ORS may work with the engineering team to validate the model through an experiment.
Normally the roll-out would be first performed in a small scale in subsets of the locations or small duration of time to validate the impact.
After the model is fully rolled out in production, ORS, as well as the business and operations team, will monitor the metrics to make sure that the new model achieves the desired results without breaking other metrics. This measurement is essentially a pre-post observational study.
The challenges of applying the 3P framework
In the real-time food delivery environment, we find it extremely hard to apply the 3P modeling approach. Our quickly evolving production system makes it difficult to maintain a self-contained environment for modeling, a necessity for the preparation phase. As a fast-growing business, our engineering team is adding more and more new requirements to the system. Plus, software engineers are constantly looking to optimize the efficiency of code, which may impact how the data is processed and how the assignment decisions are post-processed.
The challenges in prototyping are even larger. The key of the 3P framework requires creating a self-contained environment so that ORS can get accurate feedback from the environment to iterate on the model. However, this is much harder for our real-time logistics problem because real-time dispatch data comes in continuously. We need to make an assignment decision for deliveries within minutes, and Dashers, as independent contractors, may accept or decline delivery assignments.
To cope with this volatile environment, the optimization decision needs to be made continuously over time based on continuously updated information. This creates many challenges in creating the prototyping environment. For example, given that information such as Dashers’ decisions come continuously and assignment decisions are made over time, every assignment decision may have a dramatic impact on future decisions. To make the model prototype possible, an accurate and elaborate simulation system needs to be built, which is as hard as, if not harder, than solving the logistic problem itself.
Finally, it is difficult to measure the production impact of new models through pre-post analysis. Given that the supply, demand, and environmental traffic conditions are highly volatile, the metrics fluctuate a lot day over day. The high volatility makes it difficult to measure the exact production impact through pre-post analysis.
A framework to iterate our real-time assignment algorithm
To address the issues we face in the 3P solution methodology, we developed a framework which incorporates experimentation, enabling us to develop, iterate, and productionize algorithms much faster. In this framework, each ORS gains a deep understanding of the production codebase where the algorithm lives, relentlessly experiments with new ideas on all aspects of the algorithm (including its input, output, and how its decisions are executed), and productionizes their own algorithms. The framework not only increases the scope and impact of an ORS, but also increases the cohesion between the algorithm and the production system it lives in, making it easier to be maintained and iterated.
In this new framework, algorithms develop following three steps: preparation, experiment, and production.
Figure 2: Our new framework for algorithm iteration replaces the prototyping step of the 3P process with an experimentation step. This new step lets us develop and test algorithms in the production environment.
Preparation: The first step is to dive into the codebase where the algorithm lives, and gain insights into how assignment algorithms could be impacted by each line of code. As a fast growing business, our codebase for assignment service evolves quickly to cope with new operational and business requirements. Accordingly, the owner of the assignment algorithm, the ORS in most cases, can not effectively iterate on the algorithm without a thorough understanding of the codebase. Besides, deep knowledge into the codebase will enable ORS to see beyond the model and focus on the bigger picture, including the input preparation, algorithm output post-process, and engineering system design.
Our experience suggests that refining those processes may be more fruitful than narrowly focusing on the algorithm or modeling part. For example, our order-ready time estimator is essential to making good assignment decisions to avoid delivery lateness and excessive Dasher wait times at merchants. Instead of treating the order-ready time as a given fixed input into the algorithm, we relentlessly work with our partners on the Data Science team to refine prediction models for order-ready time so as to improve assignment decisions.
Experiment: With deep understanding of the assignment system, ORS are able to propose improvements that cover a broad range of areas:
Better preparation of the input data for the core algorithm
Refining the MIP model, including the objective function and constraints
Finding new information for more informed decisions
Execution of the algorithm output
Improving engineering design that may hurt solution quality
These ideas can be validated through analysis of our internal historical data or results from a preliminary simulator.
After validating the idea, the ORS need to set up and run an experiment in production. We used the switchback experiment framework which divides every day into disjoint set time windows. At each time window and geographic region (e.g. San Francisco is a region), we randomly select the control algorithm (incumbent algorithm) or the treatment algorithm (our proposed change). Given that our decisions are real time and the lifespan of a delivery is normally within an hour, the window size can be as short as a few hours. Short window size allows us to get our experiment results within a few weeks.
Through numerous trials, we find it most effective to have the ORS implement most of their own experiments in the production system. Software engineers only step in when changes are complex and involve deep engineering knowledge. Our rigorous code review process ensures that changes made by ORS are subject to our engineering practice and do not cause production issues. This approach has the following benefits:
It dramatically reduces the barrier to implement new experiment ideas since it eliminates the communication and coordination overhead between ORS and software engineers.
Most experiments may require not only understanding of the assignment system, but also domain knowledge like optimization or machine learning. Our experience suggests that sometimes a small difference in the implementation can have dramatic consequences on the assignment quality. This process can make sure that the algorithm designer’s intention is fully reflected in the implementation. It also makes the experience analysis process much more efficient since ORS know every detail about their own implementation.
Production: Normally, it takes around two weeks to get enough data for each of our experiments. If the experiment achieves good tradeoff between delivery quality and delivery efficiency, the change will be rolled out in production. Given that the new algorithm is implemented as an experiment, rolling out the change is straightforward and takes little time. This manner of productionization has the following benefits:
Compared to the traditional 3P framework, it dramatically shortens the lead time between when an algorithm is validated and the algorithm is fully rolled out in production.
It almost eliminates the discrepancy between the validated algorithm and productionized algorithm.
In our new framework, any changes in our assignment algorithm are measured rigorously in switchback experiments, and the impact of the change is accurately measured. In the 3P framework, the pre-post observational study has many pitfalls like the unanticipated confounding effect (for more information, refer to chapter 11 of the book, Trustworthy Online Controlled Experiments, by Ron Kohavi, Diane Tang, and Ya Xu).
If the experiment doesn’t work as intended, we normally perform deep dives into the experiment result. We examine how the algorithm change impacts every aspect of our assignment metrics and process and try to find a new iteration that fixes issues in the previous version. Given that ORS implements the experiment, they can connect the implementation to any metric changes in the assignment process, provide better insights into the results, and propose a new iteration.
Conclusion
With the challenges of DoorDash’s on-demand real-time logistics system, ORS find it difficult to apply the 3P framework to develop and iterate models and algorithms. Instead, we work at the intersection of engineering and modeling: we seek to thoroughly understand the production system, iterate the assignment algorithm through switchback experimentation, and productionize our experiments. With the new framework, we improve our assignment algorithm at a much faster pace and accurately gauge the impact of every algorithm change.
Given that ORS have knowledge in both modeling (including ML and optimization) and software engineering, they can serve as adaptors to connect data scientists to the production system. Data scientists normally are not aware of how their models are used in production and may not be aware of scalability and latency issues in their model. ORS with deep knowledge in the production system can help other data scientists shape their modeling ideas so that they fit better into the production system.
Figure 3: Rather than have data scientists hand off models to be implemented into the production system, operations research scientists work within the production system, iterating models on real-time data.
Our new framework is an extension of the DevOps movement. Instead of working in a self-contained prototype environment offline, ORS integrate modeling and algorithm iterations into the day-to-day software engineering process. This integration helps increase efficiency in many aspects: it reduces the communication and coordination overhead to make algorithm changes and it allows the algorithm designer or owner to maintain the algorithm. As a result, the whole process dramatically reduces the time it takes to form an experiment idea, shape it into a testable experiment, and detect and fix any errors in the algorithm design.
What’s next?
Armed with the experiment-based framework, we have been improving our real-time assignment algorithm over time. With diminishing returns on our incremental gains, we are working closely with our Experiment and Data Science teams to increase the experiment power so that we can measure smaller improvements. Given the proven power of our framework, we believe we can apply it to solve many other real-time problems at DoorDash.
After interviewing over a thousand candidates for Data Science roles at DoorDash and only hiring a very small fraction, I have come to realize that any interview process is far from perfect, but there are often strategies to improve one’s chances . Over the course of our interviews, I’ve come across some great candidates who appeared to be brilliant and performed excellently on the technical portion of the interviews, but still did not end up getting the job.
The most common pattern we see in these candidates is that, while exhibiting strong technical knowledge, they lack the soft skills of communication and critical thinking to solve business problems. These soft skills are an essential element when building highly productive teams, especially in more senior roles, and the limited nature of an interview means that a shaky performance is all the information the interviewer has to go on, potentially dooming a candidate’s chances. While different companies vary in their assessment of soft skills during the interview process, at DoorDash, Data Science and Analytics teams spend a significant amount of an interviewee’s time in understanding their approach to solving business problems as we actively look for thought leadership in all our candidates.
While problem solving and soft skills aspects of interviews can be a major hurdle, especially given the limited assessment time in an interview, there are some easy fixes that can help candidates overcome these challenges. First we will discuss some of the challenges put in place by the interview process, then we will review the tactics candidates can use to overcome these issues.
The challenges of interviewing
As much as rejection is a disappointing experience for a highly qualified candidate, it is also disappointing for hiring managers, since it can represent a failure of the recruitment process to identify the best candidates. Every time we reject someone with promising technical skills who did poorly on the communication and problem solving portions we would wonder: Why did the candidate do poorly on the business questions when they clearly were very smart and technically qualified for the role?
There is a short and a long answer to this conundrum.
Short answer: A bad hire is more expensive than rejecting a good candidate. Someone who struggles to structure their thoughts and express themselves might be difficult to work with, even if they have great technical skills and experience.
Long answer: The interview process revolves around the concept of “thin slicing”. At its core, interviewing involves taking a thin slice of a candidate’s experience and combining it with the candidate’s potential to figure out if there’s a fit for a role. Even with a signal from a few hours of time together, it’s nearly impossible to fully appreciate a candidate’s capabilities.
The interview process cannot be so elaborate that it turns off candidates, and cannot be so concise that it does not generate any signals of a candidate’s quality. There needs to be a very fine balance of the interview length for the interviewing process to work, which is hard to define as we try to make the interview process as “real” as possible to the actual job. As such, we are left in the middle of combining intuition with a couple of hours of interview conversations to come up with a final assessment. This is the reality of interviewing, which means the onus is often on the candidate to make use of the limited interview time to demonstrate they can problem solve and articulate their thinking.
Having said that, there are a few things we have seen that successful candidates do to showcase their potential and, through this article, I want to highlight these best practices and how to use social and communication skills to effectively articulate problem solving abilities.
How to improve interviewing with soft skills
Emphasize listening: A lot of candidates put too much emphasis on speaking, trying to fill in every silent moment. Silence is absolutely OK. It helps you mentally acclimatize to the interviewing environment and also helps focus on the question/cues the interviewer may be providing. The more a candidate listens, the easier it will be to understand the question from the interviewer’s point of view. This is generally true for all interviews, but even more critical in analytical interviews where you could be designing an experiment, hypothesizing on a feature, or writing complex queries. One of the great signals we look for is the quality and depth of questions that the candidate might ask us, as that highlights that we have been heard and understood.
Show a structured approach to problem solving: The structure with which a problem is approached is generally more important than the final outcome, especially in analytical case studies. This is because a structured response makes it easier for the interviewer to follow the candidate’s train of thought. Remember, the interviewer is not evaluating a candidate on whether they can solve the problem presented during the interview but on their general problem solving methodology. Let us take an example:
Interviewer: How do we increase our category share in a new market X?
Candidate: We cannot, because our rival, Y, has taken a dominant position already, or we cannot because of the reasons A, B, and C.
The above exchange may be the right answer, but is that why the interviewer asked that question? No, they want to see how the candidate would approach it, which is not really laid out in their answer. The answer should include both sides of the equation as a means of showing the pros and cons.
Think of everything, but highlight important things first: When answering interview questions, focus on a high content-to-word ratio. Thinking aloud is always a double-edged sword in answering an interview question. It can make the conversation interactive, but can also confuse the interviewer. Clearly call out when thinking aloud, and once done, articulate the summary. Continue using the analysis framework when summarizing. Take an example:
Interviewer: Which metrics would you look at for this problem?
Candidate A: I will look at X, Y, Z. I can also look at A, B, C…. and D, E, F.
Candidate B: I believe X is our true north metric. In addition we should also look at supporting metrics Y, Z. We should look at A, B as our check metrics. There are more things we can look at but these are the important metrics we should start with.
Candidate B gave a better answer to this question. They communicated their thoughts and understanding of the metric framework, giving a much clearer, thoughtful answer than Candidate A.
Take cues: Interviewers want suitable candidates to succeed, and they will often provide clues to help steer conversations in the right direction. Pay attention to those, and it will be easier to navigate the interview without getting tripped up or focusing on the wrong things.
Let’s take another example:
I interviewed this candidate for one of the roles in my team. I generally keep the first three to four minutes for mutual introductions and want to give the candidate as much time as possible for the technical part of the interview. As such, I let the candidate know that I am just looking for a 30 thousand foot view on their background.
The candidate I was interviewing wanted to cover his entire background as an intro. This went on for over five minutes and got me worried that we might not get enough time for the technical case. As such, I tried to hint that we could move on. The candidate did not take the hint, and went on for another three to four minutes. By the time we started the case, we were 10 minutes in and, as suspected, we were not able to finish the interview on time. There were two challenges here:
The candidate did not look for or acknowledge my cues.
The candidate spent time talking about experiences which were not relevant for the role of a data scientist. That extra time hurt them towards the end.
Use positive body language: Body language is such a critical part of the overall interview experience. For in-person interviews, demonstrating enthusiasm and positive energy can do wonders. And for some reason, if things feel less than perfect, let the interviewer or coordinator know.
Let’s consider this example:
In one of my interviews (where I was the candidate), I was famished by the time the last interviewer walked in. I immediately told him I needed a couple of minutes to munch on a snack bar. This request was not a big deal, and he was totally fine with it. Asking for a small break didn’t hurt my chances. In fact, if I were the interviewer, I would have appreciated that gesture as It shows me that the candidate is trying to be their best for the interview.
Conclusion
Qualified data science candidates should realize that it’s not enough to be technically brilliant: they need to be able to articulate their thinking and be aware of social cues to ensure better communication, especially in a limited interviewing setting. These tips should be helpful for those highly skilled candidates who still struggle in landing the job, and will be especially useful in business case-heavy interviews like the ones at DoorDash.
As a parting note, remember that the interviewer and the interviewee are in this process together. The evaluation is happening in both directions so it’s important that candidates hone their social skills to recognize when the interviewer is trying to help. After all, while the interviewer is looking for the right candidate for the role, the interviewee should be considering if the role is right for them.
In 2019, DoorDash’s engineering organization initiated a process to completely reengineer the platform on which our delivery logistics business is based. This article represents the first in a series on the DoorDash Engineering Blog recounting how we approached this process and the challenges we faced.
In traditional web application development, engineers write code, compile it, test it, and deploy it as a single unit to produce a functional service. However, this approach becomes more challenging for a site under continuous use by millions of end-users and constant development by hundreds of engineers.
DoorDash’s platform faced a similar reckoning. Originally developed as a monolithic codebase, the company’s business growth in 2019 unveiled the weaknesses of our development model, including issues such as growing developer ramp up time, longer waits for test completion, and overall higher developer frustration as well as increased brittleness of the application. After some debate, the company began planning to transition the monolith to a microservice architecture.
Engineering teams have adopted microservices in many contexts where scaling web services with high traffic is critical for business. Essentially, the functions of the monolithic codebase are broken out into isolated and fault-tolerant services. Engineers end up handling the lifecycle of smaller objects, making changes easier to understand and thus less prone to mistakes. This architecture allows for flexibility on deployment frequency and strategy.
Making this change at DoorDash required an all hands on deck approach, going so far as to halt all new feature development in late 2019 so that the company could focus on building a reliable platform for the future. While the extraction of business logic from the monolith is still ongoing, our microservice architecture is up and running, serving the millions of customers, merchants, and Dashers (our term for delivery drivers) who order, prepare, and deliver on a daily basis through our platform.
Growing the business
DoorDash began its venture into food delivery in 2013. At that time, the mission from an engineering standpoint was to build a fast prototype to gather delivery orders and distribute them to a few businesses through basic communication channels like phone calls and emails. The application would need to accept orders from customers and transmit those orders to restaurants while at the same time engaging Dashers to pick up orders and deliver them to customers.
The original team decided to build the DoorDash web app using Django, which was, and still is, a leading web framework. Django proved to be a good fit for achieving a minimum viable product in a short amount of time with a small group of developers. Django also provided ways to quickly iterate on new features, which was a great asset in the early days of the company since the business logic was constantly evolving. As DoorDash onboarded more engineers, the site increased in complexity and the tech stack began to consolidate around Django. With agility as the number one goal, the DoorDash engineering team kept iterating on this monolithic system while building the foundations of the business and extending the application’s functionality.
In the early years, building the web application with a monolithic architecture presented multiple advantages. The main advantage was that working on a monolith reduced the time-to-market for new features. Django provided the engineering team with a unified framework for the frontend and backend, a single codebase using a common programming language, and a shared set of infrastructure components. In the beginning this approach took the DoorDash web application far because it allowed developers to move quickly to enable new features for customers. Having the entire codebase in a single repository also provided a way to wire new logic to the existing framework and infrastructure by reusing consolidated patterns, thus speeding up our development velocity.
The cost of deploying a single service both in terms of engineering and in terms of operations was contained. We only had to maintain a single test and deployment pipeline, and a limited number of cloud components. For example, one common database powered most of the functionalities of the backend.
Figure 1: In DoorDash’s original architecture, the frontend and backend lived in a single Django application that relied on a single instance of PostgreSQL for data access.
In addition to operational simplicity, another benefit of the monolithic approach was that one component could call into other components without incurring the cost of inter-service network latency. A monolithic deployment removed the need to consider inter-component API backward compatibility, slow network calls, retry patterns, circuit breaking, load shedding strategies, and other common failure isolation practices.
Finally, since all of the data lived in a single database, requests that required information from multiple domains to be aggregated could be efficiently retrieved by querying the data source with a single network request.
Growing pains
Although the monolithic architecture was a valid solution to enable agile development in the early phases, issues started emerging over time. This is a typical scenario in the lifecycle of a monolith that occurs when the application and the team building it cross a certain threshold in the scaling process. DoorDash reached this point in 2017, which was evident by the increasing challenge of building new functionalities and extending the framework.
Eventually, the DoorDash application became somewhat brittle. New code sometimes caused unexpected side effects. Making a seemingly innocuous change could trigger cascading test failures on code paths that were supposed to be unrelated.
Unit tests were also being built with increasing inattention to speed and best practices, making them too slow to run efficiently in the continuous integration pipeline. Running a subset of tests in the suite to validate a specific functionality was challenging to do with high confidence because the code became so intertwined that a change in one module could cause a regression in a seemingly unrelated area of the codebase.
Fixing bugs, updating business logic and developing new features at DoorDash now required a significant amount of knowledge about the codebase, even for relatively easy tasks. New engineers were required to assimilate a massive amount of information about the monolith before being efficient and comfortable with daily activities. Also, the increasing number of changes included in each deployment meant that each time we had to rollback because a new change caused a regression had a larger detrimental effect to the engineering team’s overall velocity. The increased cost of rolling back changes forced the release team to frequently run hotfix deployments for mission critical patches so we could avoid another rollback.
Furthermore, no significant effort was made to prevent different areas of code from living together in the same modules. Not enough safeguards were put in place to prevent one area of the business logic from calling a different area, and the modules were not always clearly partitioned. The vast majority of the issues we experienced while coding and deploying the software were a direct result of lack of isolation between the distinct domains of the codebase.
The tech stack was also starting to struggle as we were seeing increasing traffic to our platform. Stability issues emerged when new hires who were not accustomed to large Python codebases for a live application, began to introduce code. For instance, the dynamic typing nature of the language made it difficult to verify that changes didn’t have unforeseen effects at runtime. While Python did support type hinting at the time, the process of adopting it to the entire codebase would have been complicated because of the dimension of the problem faced.
Another problem we faced was that the monolith was written without any cooperative multitasking techniques. The adoption of these techniques would have been beneficial as it would mitigate the effect of I/O bound tasks on the vertical scalability of the system. It was not an easy task to introduce this pattern in the monolith given the potentially disruptive and difficult to predict impact of the change. Because of that, the number of replicas required to satisfy the growing traffic volumes increased significantly in a short period of time and our Kubernetes cluster reached the limits of its capacity. The elevated number of instances of the monolith would frequently cause our downstream caches and database to reach connection limits, requiring connection poolers such as PgBouncer to be deployed in the middle.
Another problem was related to database load and data migrations. Despite attempts to offload the database by creating separate databases for specific domains, DoorDash still had one single-master instance of PostgreSQL as the source of most of the data. Attempts to scale the instance vertically by adding more capacity and horizontally by adding more read replicas hit some limitations because of the technology used. Tactical mitigations, like reducing queries-per-second, were counterbalanced by the increasing amount of daily orders. As the database model grew, coupling was a major concern and migrations of data to separate domain-specific databases became more difficult.
Over the years, different attempts were made to address these issues, but these were isolated initiatives lacking a clear, company-wide vision in terms of scaling the site and the infrastructure. It was clear that we needed to decrease the coupling among domains and that we needed to build a plan to scale the software and team, but the main question was how to proceed.
The leap to microservices
DoorDash built its first microservice, Deep Red, which hosted functionality for logistics artificial intelligence (AI), out of the monolith in 2014. At that stage, there was no plan to restructure the architecture to be fully service-oriented, and this service was written in Scala mainly because Python was not a good fit for CPU-intensive tasks. Going forward we started building or extracting more services from the monolith. Our goal was to ensure that new services would be more isolated to decrease outages and simpler allowing engineering teams to ramp up development faster. Payment, point-of-sale, and order transmission services, among others, were also products of this initial phase.
However, in 2018 DoorDash began facing major reliability issues, forcing engineers to focus their time on mitigation rather than developing new features. At the end of the year, the company initiated a code freeze that was quickly followed by an engineering-wide initiative to tackle the problem. This operation was aimed at fixing specific reliability issues on different areas of the site, but did not include an analysis of why the architecture was so fragile.
In 2019, Ryan Sokol, the new VP of engineering for DoorDash, started a profound reflection on three areas of our software engineering:
Architecture: monolithic versus microservice-based
Infrastructure: organization of the infrastructure in order to scale the platform and the engineering team
At that time, the architecture used a hybrid approach, with some subsystems being migrated on microservices with no common tech stack and with the monolith still at the center of all the critical flows.
The reasons why DoorDash began evaluating a re-architecture of the software were multifold. First and foremost, we were concerned about the stability of the site. Reliability became the first priority for engineering as we were going through the decision-making process around how to move forward with the re-architecting initiative. On the other hand, we were concerned about the isolation of our different business lines, such as our signature food delivery marketplace and DoorDash Drive, that were already consolidated, but also interested in the possibility of building new business lines in isolation by leveraging the current functionality and platforms. At the same time, the company was already building an in-depth knowledge on how to operationalize mission-critical microservices in multiple domains, including logistics, order transmission, and the core platform.
There were multiple advantages to having a microservice architecture that we were looking to utilize. On one hand, DoorDash strived for a system where functionalities were built, executed, and operationalized in isolation, and where service failures were not necessarily inducing system failures nor causing outages. On the other hand, the company was looking for flexibility and agility in launching new business lines and new features, while being able to rely on the underlying platforms to achieve reliability, scalability, and isolation.
Furthermore, this architecture allowed for different classes of services, including frontend, BFFs (backends for frontend), and backend, to be built with different technologies. Last but not least, the company was looking for an organizational model where scaling the engineering team with respect to the architecture was feasible. In fact, the microservice architecture allowed for a model where smaller teams could focus on specific domains and on the operations of the corresponding sub-systems with a lower cognitive load.
To reiterate, the reasons why we moved to a microservice-based architecture were:
Stabilization of the site
Isolation of the business lines
Agility of development
Scaling the engineering platform and organization
Allowing different tech stacks for different classes of services
Defining these requirements helped us determine a thoughtful and well-planned strategy for a successful transition to a microservice architecture.
Making the transition
Moving out of the monolith was not an easy call for DoorDash. The company decided to start this process during a historical phase where the business was experiencing unprecedented growth in terms of order volume, new customers, and new merchant onboarding, along with the launch of new business lines consolidating on the platform.
We can identify four separate phases of this still-ongoing journey:
Prehistory: before the strategic launch of microservices
Project Reach: addressing critical workflows
Project Metronome: beginning business logic extraction
Project Phoenix: designing and implementing the holistic microservice-based platform
Figure 2: Our timeline for migrating to a microservice architecture necessarily began with a code freeze, suspending development of new features until we built the foundations that would eventually lead to our fully re-architected platform. It is also important to remember that this entire timeline takes place while our pre and post-migration systems were meeting DoorDash’s business needs.
Prehistory
In this phase, from 2014 until 2019, DoorDash built and extracted services out of the monolith without a specific vision or direction to how these services were supposed to interact and what would have been the common underlying infrastructure and tech stack. The services were designed to offload some of the functionality of the monolith to teams that were working on domain-specific business logic. However, these services still depended on the monolith for the execution of some workflows and to access data from the main database. Any failure or degradation of the monolith heavily affected the workflows powered by these “satellite” services. This behavior was caused by the fact that the satellite services were not designed to work in isolation mainly because of the lack of a cohesive strategy on the future of the software architecture.
Project Reach
In 2019 the company started the first organized effort to address the problem of re-architecting the codebase, the infrastructure, and the tech stack. Project Reach’s scope required that we address a set of critical functionalities and to begin the extraction of the corresponding code into new services. The first efforts were focused on the business-critical workflows and on the code extractions that were already in progress from the previous phase. Another achievement of Project Reach was to begin standardizing the tech stack. In this phase, DoorDash adopted Kotlin as the common language for backend services and used gRPC as the default remote procedure call framework for inter-service communication. There were also some efforts to move out of PostgreSQL in favour of Cassandra in order to address some scalability issues. The project was carried out by a small task force of engineers with the help of representatives across different teams. The main goals were to raise the engineering team’s awareness of why a re-architecture was needed and to start a process of systematic code extraction from the monolith.
Project Metronome
Project Reach laid the technical foundation for the new microservice architecture, consolidated new patterns of extraction, and proved that migrating off the monolith was possible and necessary. Project Reach’s impact was so profound that the engineering team was able to get buy-in from upper management to focus the effort on the re-architecture and extraction work for all of the fourth quarter of 2019 . For the whole duration of Project Metronome, a representative from every team was committed to following up closely on the extraction works for that domain. Technical program management was heavily involved in formally tracking the progress against the milestones that were identified at the beginning of the project. During this quarter, the extraction process changed pace and DoorDash was able to make significant progress on the extraction of some of the critical workflows and in some cases to complete the analysis of the remaining functionality to be extracted.
Project Phoenix
Thanks to the momentum generated by Project Metronome on the extraction effort and the in-depth knowledge accumulated over the course of 2019 on the functionality to be extracted from the monolith, we began a rigorous planning phase that served the two-fold purpose of identifying all the workflows still orchestrated by the monolith and determine the final structure of the microservice mesh. This planning phase also aimed to define all the upstream and downstream dependencies for each service and each workflow so that the teams were able to follow up closely with all the stakeholders during the extraction and rollout processes. Data migrations from the main database to the domain-specific databases were also included in the planning as part of the requirements to retire the legacy architecture.
Each effort required to complete the extraction process was formalized into milestones and each milestone was categorized into three tiers in order to prioritize the execution. After this planning phase, a significant portion of the engineering team was dedicated to completing the extraction work, starting with the most critical workflows for the business.
After these phases, a multi-layered microservice architecture emerged:
Figure 3: Our final design for our new microservice architecture consisted of five different layers, ranging from the user experience to the core infrastructure. Each layer provides functionality to the upper layer and leverages the functionality exposed by the lower layer.
Frontend layer: Provides frontend systems (like the DoorDash mobile app, Dasher web app, etc) for the interaction with consumers, merchants, and Dashers that are built on top of different frontend platforms.
BFF layer: The frontend layer is decoupled from the backend layer via BFFs. The BFF layer provides functionality to the frontend by orchestrating the interaction with multiple backend services while hiding the underlying backend architecture.
Backend Layer: Provides the core functionality that powers the business logic (order cart service, feed service, delivery service, etc).
Platform layer: Provides common functionality that is leveraged by other backend services (identity service, communication service, etc).
Infrastructure layer: Provides the infrastructural components that are required to build the site (databases, message brokers, etc) and lays the foundation to abstract the system from the underlying environment (cloud service provider).
The main challenges of re-architecting our platform
DoorDash faced multiple challenges during this re-architecture process. The first challenge was to get the whole engineering team aligned on the strategy of moving to microservices. This alignment was not an easy task, as years of work on the monolith contributed to a lot of inertia in the engineering team with respect to the extraction effort. This cognitive bias, known as the IKEA effect, was part of the reason why DoorDash needed new blood to execute this endeavor. The company proceeded with a disagree and commit approach, where a phase of debates on different topics was followed by a commitment from the engineering team as a whole on the overall strategy that had been decided upon.
Having all hands engaged on the re-architecture effort required the evangelization of new reliability patterns that was unprecedented for the company. A big effort was put in place to promote reliability as the foundational property of the new system that the team was about to build. In addition to focusing on reliability our team also had to emphasize isolation, which had not been a factor when working on the monolith. With respect to this matter, the core issue was to contain the use of anti-patterns while looking for a reasonable compromise between agility of the extraction and technical debt.
The main challenge that the engineering team faced was to define new interaction surfaces among the newly formed services and proceed with extracting the functionality, as opposed to just extracting the code. This task was particularly hard because the team had to do it while moving to a different tech stack and juggling new feature development tasks. In fact, it was not possible to operate in a code-freeze state for the whole duration of the extraction, as new functionalities were still necessary for the business to grow and adapt to the changing needs of customers, merchants, and Dashers.
Also, as code extraction was carried out at different paces across domains, service adoptions were difficult to handle. In fact, the first code extraction efforts didn’t have all the downstream dependencies available to completely migrate to a microservice-based architecture. Therefore, the teams had to put in place temporary solutions, such as resorting to direct database access, while waiting for the APIs to land on the corresponding services. Even if this anti-pattern allowed for progress on the extraction, table migrations became more difficult to achieve as we didn’t have a clear and well-defined access pattern to the data. Temporary APIs were used to mitigate this issue, but that approach was increasing the overall technical debt. Therefore, it was critical to make sure that adoptions were constantly monitored and carried out as new extractions were successfully implemented.
Lastly, one of the most complex efforts that was put in place was the data migration from the main database to the newly formed service-specific databases without disrupting the business. These migrations were as important as they were complex and potentially disruptive, and building the foundation for the first migrations required multiple iterations.
It is worth noting that all these efforts were unfolding while DoorDash was experiencing a significant order volume growth due to the effects of Covid-19 on the food delivery market. While we were performing the code extractions and database migrations we had to make sure that the current architecture was able to handle the increasing load. Juggling all these elements at the same time was not an easy task.
Hitting our goals
In the 16 months since Project Reach’s inception, DoorDash has made huge progress on the path to reaching a full-fledged microservice architecture and of being able to retire the monolith and the infrastructure wired to it.
We are working to move all of our business-critical workflows into microservices and plan to freeze the monolith codebase, with few exceptions for high priority fixes. New product features are currently being developed on the new microservices. The infrastructure team is focused on powering this new architecture and on making it flexible enough to support any new business lines which might launch in the future.
Also, most of the critical tables were successfully extracted from the main database into microservice-specific databases, thus eliminating a major bottleneck from the architecture. The load on the main database has been proportionally decreased with respect to the organic increase of requests due to the business growth.
With the new architecture, DoorDash is powering roughly 50 microservices, among which 20 are on the critical path, meaning their failure may cause an outage. By adopting a common set of infrastructural components, a common tech stack, and by loosely coupling most of the interactions among services, the company achieved a level of reliability and isolation that pushed the uptime indicators to levels that were not achievable with the monolith. The organization is converging to a structure where small teams of domain experts have acquired the knowledge to scale, operate, and extend each component. While these results have been outstanding there are still several challenges ahead. In the upcoming articles in this series we will discuss some of the challenges we faced implementing microservices including having to deal with rigid data contracts, the hurdles of adding and operating new services to the platform and having to deal with failures across service boundaries.
As DoorDash began migrating to a microservice architecture in 2019, we found it critical to extract APIs for DoorDash Drive, our white label logistics platform, from our previous monolithic codebase. Extracting these APIs improves our ability to monitor them and ensure Drive operates reliably.
DoorDash Drive provides last mile, on-demand logistics solutions to business owners, and Drive Portal is the platform where deliveries are requested and tracked. All the APIs used by the Portal were living under a monolith shared among dozens of services. We built this monolithic codebase in our formative years, but as we grew, we decided a microservice architecture would better suit our needs.
We divided the API extraction process into three phases. The most important, separation, required us to understand each API’s business logic and map out its endpoints. During the testing phase we ran various payloads to make sure our freshly extracted APIs worked as expected. And finally, we organized the APIs into batches for the shipping phase and monitored them closely to ensure performance in the production environment.
DoorDash’s move to a microservice architecture had to be accomplished so as not to disrupt services running on our platform, requiring strategic thought all around. Extracting the Portal APIs for DoorDash Drive was one of many efforts taken on by our engineering organization.
Mobilizing for extraction
In April 2020 DoorDash mobilized a large part of our engineering organization to migrate from our monolithic codebase to a microservices architecture. We planned this migration to improve the quality, reliability, and developer velocity on our platform. Amongst the many projects within this migration was an effort to extract APIs powering DoorDash Drive from the monolith and move them over to the new microservice architecture.
For example, one of the Drive APIs gets all the stores accessible by the user. Since the authentication between users and stores is slightly different between DoorDash’s consumer marketplace platform and Drive, it becomes very complicated to modify the existing model to support Drive’s special use cases.
As the APIs are provided to all services, any code change would impact the Drive Portal’s behavior without the engineers necessarily knowing it. Additionally, any outage in the monolith would hugely impact the Drive Service if we are fully dependent on the monolith.
As a first step for the Drive Portal API extraction part of this project, we implemented controllers for each endpoint in our Drive Backend For Frontend (Drive BFF) to accept the same requests and payloads from the frontend, and redirect them to the monolith.
The key challenge of the extraction wasn’t the extraction itself. Instead, it was learning and understanding each API’s business logic, where it was implemented in the monolith, and its specific Drive use case. For example, one API allows Merchant users to search their history of deliveries by date range and keywords, returning delivery details including delivery ID, Dasher name, and the actual delivery time. Upon further investigation of this API we found that 42 endpoints similar to this one were used on the Drive Portal. Although this quantity might seem daunting, the number of APIs wouldn’t be a concern if we knew how to break them down into smaller pieces.
Three steps to ensuring a successful extraction
Although the entire migration involves big changes to DoorDash’s platform, our active users should feel no disruption when using our services during this process. Achieving this goal required a cautious and detail-oriented approach for each and every step in the extraction process. Also, getting parity between these architectures didn’t mean copying and pasting code, but actually improving efficiency at the same time.
To maintain a stable experience for our users during the migration, we came up with three steps to make each part of the extraction small enough so that no details would be missed or overlooked.
Separation: Understanding the API’s business logic and replicating it in the new environment
Testing: Ensuring that each API acts like we expect on our staging server
Shipping: Putting the API into production and monitoring it for anomalies
Using this process makes our extraction efforts manageable and safe, preserving the reliability of our platform.
Separation: Categorization by function
The most important step among all three is separation. This step not only helped us comprehend the scope of the whole project, but also made sure that we did not miss any endpoints when we discussed the details of each service.
We were able to break down all the 42 APIs in the Drive Portal into five Service Groups, including Catering Service, Dasher Service, Delivery Service, Merchant Service, and Notification Service.
Figure 1: Analyzing our existing APIs, we classified them into five groups by functionality, which aligned with their business logic.
Within each group, the APIs achieve similar functionalities. The existing code is located closely together in the monolith, and so can be placed under the same controller after the extraction.
Figure 2: We migrated the APIs according to their service groupings while keeping the other parts functioning under the monolith codebase. The service level API volume dictated the rollout order: Notification Service, Merchant Service, Delivery Service, Dasher Service, and Catering Service.
The Separation stage also helped us clear out the timeline of the entire extraction process. We then prioritized the APIs with fewer dependencies and which were easiest to implement, leaving the rest for later as we got more familiar with the procedure.
Testing: Verifying behavior
There are many details and variations in the API implementation that can be easily missed. For example, user authentication, endpoint parameter validation, and serialization are all essential parts of the extraction. To mitigate all potential errors or mistakes, we created a suite of test cases for every group of endpoints to make sure the behavior was identical to the existing APIs. All the test cases were first written and tested in our staging environment, and then reused in production environments.
Because we are working remotely, we hosted a Testing Party over Zoom where engineers who had worked on Drive Portal tested the functionality of the endpoints they were familiar with. We checked off endpoints with no issues and wrote down action items for endpoints that didn’t behave as expected.
Shipping: Tracking and batching
Even if we fully tested all APIs locally and on a staging server, there might still be some uncaught errors. We were very cautious when rolling out such a big change, so we planned for the worst.
There were two important components of the Shipping step, Tracking and Batching. The former monitored for any issues that developed in production, and the latter let us manage the API deployment to ensure reliability.
Tracking HTTP response
We would never ship a feature without a mechanism to monitor its performance. Not surprisingly, monitoring is another benefit we gained from extracting our APIs. We created an informative dashboard showing all the Portal APIs statuses in detail, including queries per second (QPS), latency, and response status. We added multiple alerts with these metrics so engineers can react quickly if problems arise.
Figure 3: We were able to monitor each endpoint’s API status, using green for 2XXs, yellow for 4XXs, and red for 5XXs. This dashboard gave us the ability to take actions according to impact and investigate with more detailed loggings.
Batching APIs
We batched APIs into separate deployments according to their groups. For each batch, we built a new web release and only exposed it to a certain percentage of our users. We closely monitored all the metrics on the dashboard and gradually rolled it out to 100% of users.
Batching APIs dramatically reduced the risk of each deployment. Though the process took longer, it was much more manageable and actionable if any error occured.
Results
Following this three step extraction process, we caught 100% of errors before rolling out to production, and were able to redirect all requests through the BFF. Any outages experienced on the monolithic codebase we were moving away from caused only limited degradation or no impact on the Drive Portal. The migration hasn’t been fully completed yet, but we are confident that following this process will effectively lead us to completion in the near future.
Migrating from a monolithic codebase to a microservice architecture is not uncommon, especially among startups that find success with increasingly large user bases. As in DoorDash’s case, these migrations often need to occur on production platforms, potentially risking disruption to business services. The example of API extraction described in this article, although only one part of a larger project, indicates how careful planning and a well-documented process can lead to error-free deployments.
Acknowledgement
Special thanks to Alok Rao, William Ma, Dolly Ye, and everyone on DoorDash’s Drive team for learning together with me and their support during this project.
When a company with millions of consumers such as DoorDash builds machine learning (ML) models, the amount of feature data can grow to billions of records with millions actively retrieved during model inference under low latency constraints. These challenges warrant a deeper look into selection and design of a feature store — the system responsible for storing and serving feature data. The decisions made here can prevent overrunning cost budgets, compromising runtime performance during model inference, and curbing model deployment velocity.
Features are the input variables fed to an ML model for inference. A feature store, simply put, is a key-value store that makes this feature data available to models in production. At DoorDash, our existing feature store was built on top of Redis, but had a lot of inefficiencies and came close to running out of capacity. We ran a full-fledged benchmark evaluation on five different key-value stores to compare their cost and performance metrics. Our benchmarking results indicated that Redis was the best option, so we decided to optimize our feature storage mechanism, tripling our cost reduction. Additionally, we also saw a 38% decrease in Redis latencies, helping to improve the runtime performance of serving models.
Below, we will explain the challenges posed in the task of operating a large scale feature store. Then, we will review how we were able to quickly identify Redis as the right key-value store for this task. We will then dive into the optimizations we did on Redis to triple its capacity, while also uplifting read performance by choosing a custom serialization scheme around strings, protocol buffers, and Snappy compression algorithm.
Requirements of a gigascale feature store
The challenges of supporting a feature store that needs a large storage capacity and high read/write throughput are similar to the challenges of supporting any high-volume key-value store. Let’s elaborate upon the requirements before we discuss the challenges faced when meeting these requirements specifically with respect to a feature store.
Persistent scalable storage: support billions of records
The number of records in a feature store depends upon the number of entities involved and the number of ML use cases employed on these entities. At DoorDash, our ML practitioners work with millions of entities such as consumers, merchants, and food items. These entities are associated with features and used in many dozens of ML use cases such as store ranking and cart item recommendations. Even though there is an overlap in features used across these use cases, the total number of feature-value pairs exceeds billions.
Additionally, since feature data is used in model serving, it needs to be backed up to disk to enable recovery in the event of a storage system failure.
High read throughput: serve millions of feature lookups per second
A hit rate of millions of requests per second is a staggering requirement for any data storage system. The request rates on a feature store are directly driven by the number of predictions served by the corresponding system. At DoorDash, one of our high volume use cases, store ranking, makes more than one million predictions per second and uses dozens of features per prediction. Thus, our feature store needs to support tens of millions of reads per second.
Fast batch writes: enable full data refresh in a nightly run
Features need to be periodically refreshed to make use of the latest real world data. These writes can typically be done in batches to exploit batch write optimizations of a key-value store. At DoorDash, almost all of the features get updated every day, while real time features, such as “average delivery time for orders from a store in the past 20 minutes”, get updated uniformly throughout the day.
Stay Informed with Weekly Updates
Subscribe to our Engineering blog to get regular updates on all the coolest projects our team is working on
Please enter a valid email address.
Thank you for Subscribing!
Specific design challenges in building a feature store
When designing a feature store to meet the scale expectations described above, we have to deal with complexities that are specific to a feature store. These complexities involve issues such as supporting batch random reads, storing multiple kinds of data types, and enabling low-latency serving.
Batch random reads per request add to read complexity
Feature stores need to offer batch lookup operations because a single prediction needs multiple features. All key-value stores support unit lookup operations such as Redis’s GET command. However, batch lookups are not a standard especially when keys are in no particular sequence. For example, Apache Cassandra doesn’t support batch random lookups.
Heterogeneous data types require non-standardized optimizations
Features can either be simple data types such as integers, floats, and strings, or compound types such as vector embeddings or lists. We use integers or strings for categorical features such as order protocol, for whether an order was received by merchants via email, text, or iPad. We use lists for features such as a list of cuisines chosen by a customer in the past 4 weeks. Each one of these data types needs to be individually treated for optimizing storage and performance efficiency.
Low read latency but loose expectations on write latency
A feature store needs to guarantee low-latency reads. Latency on feature stores is a part of model serving, and model serving latencies tend to be in the low milliseconds range. Thus, read latency has to be proportionately lower. Also, typically, writes and updates happen in the background and are much less frequent than reads. For DoorDash, when not doing the batch refresh, writes are only 0.1% of reads. Low-latency requirements on reads and loose expectations with writes gives a direction for building towards a read-heavy key-value store but one that is fast enough for large batch writes.
Identifying the right key-value store by benchmarking key performance metrics
The choice for an appropriate storage technology helps greatly in increasing the performance and reducing the costs of a feature store. Using Yahoo’s cloud serving benchmark tool, YCSB, we were able to identify Redis as a key-value store option that best fit our needs.
What we need from a benchmarking platform
Before we lay out our benchmarking setup, it is worthwhile to emphasize key requirements of a benchmarking platform. The four major required capabilities of a benchmarking setup are:
Data generation using preset distributions
Using data generation is a faster and more robust approach to benchmarking than ingesting real data because it accounts for possible values that a system’s random variables can take and doesn’t require moving data around to seed a target database.
Ability to simulate characteristic workloads
The workload on a database can be defined by the rate of requests, nature of operations, and proportions of these operations. As long as we can guarantee the same fixed request rate across tests, we can enable a fair comparison between the different databases.
Fine-grained performance reporting
The suite should be able to capture performance with appropriate statistical measures such as averages, 95th percentile, and 99th percentiles.
Reproduction of results on demand
Without reproducibility, there is no benchmark, it’s merely a random simulated event. For this reason, any benchmark platform needs to be able to provide a consistent environment where the results can be reproduced when running the same test over and over.
Using YCSB to do a rapid comparison of key-value stores
YCSB is one of the best benchmarking tools out there for analysing key-value stores. So much so that it not only meets all of the needs we described above but also provides sample code to benchmark a vast number of key-value stores. This setup ensures we have a flexible playground for rapid comparisons. Below, we describe our approach of using YCSB to validate our selection of Redis as the best choice for a feature store. We will first describe our experiment setup and then report the results with our analysis.
Experiment setup
When setting up the benchmarking experiment, we need to start with the set of key-value stores that we believe can meet the large scale expectations reliably and have a good industry presence. Also, our experiment design is centered around Docker and aims to optimize the speed of iterations when benchmarking by removing infrastructure setup overheads.
Candidate set of key-value stores
The key-value stores that we experimented on in this article are listed in Table 1, below. Cassandra, CockroachDB, and Redis have a presence in the DoorDash infrastructure, while we selected ScyllaDB and YugabyteDB based on market reports and our team’s prior experience with these databases. The intention was to compare Redis as an in-memory store with other disk-based key-value stores for our requirements.
Database name
Version
Cassandra
3.11.4
CockroachDB
20.1.5
Redis
3.2.10
ScyllaDB
4.1.7
YugabyteDB
2.3.1.0-b15
Table 1. We considered five data stores for benchmarking, three that were in current use at DoorDash and two others that showed promise in external market reports.
Data schema
For data storage, we chose following patterns:
SQL/Cassandra
CREATE TABLE table (key varchar primary key, value varchar)
Redis
SET key-value
GET key
Input data distribution
For the key-value stores, we set the size of our keys using an average measure on the data in our production system. The size of values were set using a histogram representing size distribution of actual feature values. This histogram was then fed to YCSB using the fieldlengthhistogram property for workloads
Nature of benchmark operations
The benchmark was primarily targeted at these operations
batch writes
batch reads
update
We used the following implementation strategy for batch reads to allow any scope for database-side optimizations across lookups and to minimize network overheads.
SQL: IN clause
SELECT value FROM table
WHERE key IN (key1, key2 .. keyM)
We used the CQL interface for ScyllaDB and the SQL interface for YugabyteDB.
Benchmarking platform: Docker
We set up our entire benchmark on a 2.4 GHz Intel Core i9 16GB RAM MacOS Catalina 10.15.7 with 8GB RAM and 8 cores available for Docker. The Docker setup for each database had the following:
Docker containers for DB under test
Docker container for YCSB
Docker container for cAdvisor that can track docker cpu/memory
We used Mac as opposed to EC2 instances in AWS to allow rapid preliminary comparisons between the different databases without any infrastructure setup overheads. We used Docker on Mac as it’s easier to get control and visibility on resources in a container-based isolation vs process-based isolation.
As Docker has a measurable effect on performance, we used it with caution and made redundant runs to guarantee the reliability of our results. We validated our Docker setup by comparing improvements reported in local tests with improvements in production using the case of Redis. Check out this study to learn more about the Docker’s impact on benchmarking.
Experiment results
In our experiments, we wrote custom workloads to mix our benchmark operations using two sets of fractions of reads versus writes — one with 100% batch reads and the other with 95% reads. We ran these workloads with 10,000 operations at a time using a batch size of 1,000 lookups per operation. We then measured latency for these operations and resource usage.
Table 2: In our benchmarking, Redis, being an in-memory store, outperformed all candidates for read latency.
Table 2 lists the reported latencies from YCSB in increasing order of read latency. As expected, Redis, being an in-memory database, outperformed all candidates. CockroachDB was the best disk-based key-value store. The tradeoff with in-memory stores is usually weaker persistence and smaller storage capacity per node since it is bottlenecked by memory size. We used AWS ElastiCache for our Redis cluster in production, which provides replication that relieves persistence concerns to a good extent. The smaller storage capacity per node is a cost concern, but to get the full picture around costs we also need to take CPU utilization into account.
Thus, while running the 10,000 operations, we also measured CPU usage with a fixed target throughput of 125 operations per second to ensure fair usage comparison. In Figure 1, below, we compare the most performant in-memory store (Redis) with the highest performing disk-based store (CockroachDB).
Figure 1. Redis uses less than half the CPU capacity than CockroachDB, the next best key-value store.
As we can see, even though CockroachDB would provide a much higher storage capacity per node, we still need greater than twice the number of nodes than Redis to support the required throughput. It turns out that the estimated number of nodes needed to support millions of reads per second is so large (10,000 operations per second) that storage is no longer the limiting factor. And thus, Redis beats CockroachDB in costs as well because it performs better with CPU utilization.
We established that Redis is better than CockroachDB in both performance and costs for our setup. Next, we will see how we can optimize Redis so that we can reduce costs even more.
Optimizing Redis to reduce operation costs
As we learned above, to reduce operation costs, we need to work on two fronts, improving CPU utilization and reducing the memory footprint. We will describe how we tackled each one of these below.
Improving compute efficiency using Redis hashes
In our experiments above, we stored features as a flat list of key-value pairs. Redis provides a hash data type designed to store objects such as user with fields such as name, surname. The main benefit here versus a flat list of key-value pairs is two-fold:
Collocation of an object’s fields in the same Redis node. Continuing on our example of a user object, querying for multiple fields of a user is more efficient when these fields are stored in one node of a Redis cluster as compared to querying when fields are scattered in multiple nodes.
Smaller number of Redis commands per batch lookup. With Redis hashes, we need just one Redis HMGET command per entity as opposed to multiple GET calls if features of the entity were stored as individual key-value pairs. Reducing the number of Redis commands sent not only improves read performance but also improves CPU efficiency of Redis per batch lookup.
To exploit Redis hashes, we changed our storage pattern from a flat list of key-value pairs to a Redis hash per entity. That is,
From:
SET feature_name_for_entity_id feature_value
To:
HSET entity_id feature_name feature_value
And our batch reads per entity now look like:
HMGET entity_id feature_name1 feature_name2 ...
The downside, however, of using Redis hashes is that expiration times (TTLs) can only be set at the top level key, i.e. entity_id, and not on the nested hash fields, i.e. feature_name1, etc. With no TTLs, the nested hash fields won’t be evicted automatically and have to be explicitly removed if required.
We will elaborate in the results section how this redesign dramatically reduces not just compute efficiency but also memory footprint.
Reducing memory footprint using string hashing, binary serialization, and compression
To reduce the memory footprint, we will target the feature_name and feature_value portion of our design and try to minimize the number of bytes needed to store a feature. Reducing bytes per feature is not only important for determining overall storage needs but also to maintain Redis hash efficiency, as they work best when hashmap sizes are small. Here, we will discuss why and how we used xxHash string hashing on feature names and protocol buffers and Snappy compression on feature values to cut the size of feature data in Redis.
Converting feature names to integers using xxHash for efficiency and compactness
For better human readability, we were initially storing feature names using verbose strings such as daf_cs_p6m_consumer2vec_emb. Although the verbose strings work great for communication across teams and facilitating loose coupling across systems referencing these features as a string, it is inefficient for storage. Feature names represented as strings are 27 bytes long whereas a 32 bit integer is, well, 32 bits. Maintaining an enum or keeping a map of feature names to integers is not only extra bookkeeping but also requires all involved systems to be in sync on these mappings.
Using a string hash function guarantees that we will have consistent references of a feature name as integer across all systems. Using a non-cryptographic hash function will ensure we incur minimal computational overheads to compute the hash. Thus, we chose xxHash. We used 32 bit hashing to minimize the probability of hash collisions. This approach can be visualized by changing our HSET command above from:
Binary serialization of compound data types using protobufs
As we discussed before, features such as vector embeddings or integer lists are DoorDash’s compound data types. For the purpose of storage, a vector embedding is a list of float values. To serialize compound data types, we used bytes returned via protocol buffer format. Serializing simple float values to binary did not yield any gains because a significant number of our feature values are zeros. Since we expect a skewed presence of zero values for our float-based features in the future, we chose string as a format of representation because zeros are best represented via strings as a single byte, ‘0’. Putting it all together, serializing compound types with protobufs and floats as strings became our custom serialization approach to maximize storage efficiency.
Compressing integer lists using Snappy
Compressing lists is an additional post-processing step that we apply on top of conversion to the protobufs mentioned above for furthering our size reduction efforts. When choosing a compression algorithm, we needed a high compression ratio and lower deserialization overheads. We chose Snappy for its large compression ratio and low deserialization overheads.
Additionally, we observed that not all compound data types should be compressed. Embeddings have less compressibility due to being inherently high in entropy (noted in the research paper Relationship Between Entropy and Test Data Compression) and do not show any gains with compression. We have summarized the combination of binary serialization and compression approaches in Table 3 to reflect our overall strategy by feature type.
Feature Type
RedisValue
Float
String form(better than binary serialization when floats are mostly zeros)
Embedding
Byte encoding of Embedding protobuf
Int List
Snappy Compressed byte encoding of Int List as a protobuf(compression is effective when values repeat in int list)
Table 3: Float feature types are most compact as strings, and embeddings do not benefit from compression.
Evaluation and results
Below we report results obtained after pursuing the optimizations reported above. We will dissect the recommendations individually to give a sense of how much incremental impact we get from each one of these. We will show that restructuring flat key-value pairs to hashes has the greatest impact on both CPU efficiency and memory footprint. Finally, we will demonstrate how all these optimizations sum up to increase the capacity of our production cluster by nearly three times..
Redis with hashes improves CPU efficiency and read latency
We extended our benchmark report to add Redis redesigned with hashes to study the effect it has on read performance and CPU efficiency. We created a new workload which will still perform 1,000 lookups per operation but will break these lookups into 100 Redis key lookups and 10 Redis hash field lookups per key. Also, for the sake of fair comparison with CockroachDB, we reoriented its schema to make value to be JSONB type and used YCSB’s postgrenosql client to do 100 key lookups and 10 JSONB field lookups per key.
Note: CockroachDB JSONB fields will not be sustainable for production as JSONB fields are recommended to be under 1MB. Redis hashes, on the other hand, can hold four billion key-value pairs.
CockroachDB NoSQL table schema:
CREATE TABLE table (key varchar primary key, value jsonb)
SQL clause for CockroachDB NoSQL variant:
SELECT key, value ->> field1, value ->> field2, …, value ->> field10
FROM table
WHERE key in (key1, key2, .. key100)
As Table 4 shows, read latency for Redis with hashes has a consistent improvement across both read-heavy and read-only workloads.
Table 4: Using Redis hashes on benchmarks results in read latency dropping by more than 40%.Figure 2: Using Redis hashes on benchmarks results in a five times improvement in CPU efficiency.
Redis hashes and compression combine to reduce cluster memory
As we mentioned earlier, Redis hashes not only improve CPU efficiency but also reduce the overall memory footprint. To demonstrate this, we took a sample of one million records from our table with stratified sampling across different types of features. Table 5 shows that Redis hashes amount to much larger gains as compared to gains with compression.
Setup
In-memory allocation for 1M records
Time to upload 1M records
DB latency per 1000 lookups
Deserialization of 1000 lookup values
Flat key-value pairs
700.2MiB
50s
6ms
2ms
Using Redis hashes
422MiB
49s
2.5ms
2ms
LZ4 compressionon list features in Redis hash
397.5MiB
33s
2.1ms
6.5ms
Snappy compression on list features in Redis hash
377MiB
44s
2.5ms
1.9ms
Table 5. When comparing two of the most popular compression algorithms for compression ratio and deserialization time using the benchmark setup we described before, Snappy fared better on both these fronts.
String hashing on Redis key names saves another 15% on cluster memory
With string hashing, we saw Redis in-cluster memory drop to 280MB when applied at the top of LZ4 compression for the same sample of one million records we used above. There was no additional computational overhead observed.
For the sample of one million records, we were able to get down to 280MB from 700MB. When we applied the above optimizations to production Redis clusters, we observed perfectly analogous gains, a two and half times reduction, reflecting the viability of our local tests. However, we did not get completely analogous gains on CPU efficiency because CPU spent on requests in production depends on distribution of the keys queried and not the keys stored. YCSB doesn’t allow setting a custom distribution on keys queried and thus was not part of our benchmark setup.
Overall impact on DoorDash’s production Redis cluster
When implementing all the said optimizations, launching and comparing it with the Redis cluster we had before, we saw memory overall reduce from 298 GB RAM to 112 GB RAM per billion features. Average CPU utilization across all nodes dropped from 208 vCPUs to 72 vCPUs per 10 million reads-per-second, as illustrated in Figure 3, below.
Furthermore, we saw our read latency from Redis improve by 40% for our characteristic model prediction requests, which typically involve about 1,000 feature lookups per request. Overall latency for our feature store interface, including reads from Redis and deserialization, was improved by about 15%, as illustrated in Figure 4, below.
Figure 3. After applying our optimizations to DoorDash’s feature store, we saw CPU utilization reduced by 2.85x and memory usage reduced by about 2.5x.Figure 4: Read latencies from Redis and overall latency of the feature store API dropped by about 40% and 15% respectively after applying our optimizations.
Conclusion
A large scale feature store used under the requirements for high throughput, batch random reads, and the constraints of low latency is best implemented using Redis. We illustrated using benchmarking on a list of candidate key-value stores that Redis is not only highly performant but is also the most cost-efficient solution under these circumstances.
We used DoorDash’s feature data and its characteristics to come up with a curated set of optimizations to further improve upon cost efficiency of its feature store. These optimizations exploited Redis hashes to improve CPU efficiency and memory footprint. We also learned that string hashing can effect sizable reductions on the memory requirements. We showed how compression is an effective approach to make compact representation of complex features. While compression sounds counterintuitive when we talk about speed, in specific cases it helps by reducing the size of the payload.
We believe the techniques mentioned for benchmarking can greatly help teams in any domain understand the performance and limitations of their key-value stores. For teams working with large scale Redis deployments, our optimization techniques can provide analogous returns depending on the nature of data in operation.
Future Work
Continuing upon the performance and efficiency of our feature store, we will investigate exploiting the sparse nature of our feature data to achieve a more compact representation of our feature data.
Acknowledgements
Many thanks to Kornel Csernai and Swaroop Chitlur for their guidance, support, and reviews throughout the course of this work. Thanks to Jimmy Zhou in identifying the need to look into Redis bottlenecks and pushing us in driving this project through. And thanks to the mentorship of Hien Luu and Param Reddy on making this and many other projects for our ML Platform a success. Also, this blog wouldn’t have been possible without the editorial efforts of Ezra Berger and Wayne Cunningham.
Restaurants on busy thoroughfares can use many elements to catch a customer’s eye, but online ordering experiences mostly rely on the menu to generate sales. When dining in it’s not hard to imagine seeing the storefront and patio of a Mediterranean restaurant and being prompted to look at the menu in the window. The wide selection of mezzes, spreads, and breads on the menu serves as an attraction for where to get lunch.
Figure 1: Aba Chicago’s storefront presents an immediate draw for customers with its interior design and patio. The freeform physical menu can also be arranged in a way to best exhibit the selections on offer.Photo Credit: Jeff Marini
In this way, in-person menus are just one part of the visual and experiential elements of the storefront, which helps attract customers. When creating an online experience on DoorDash, the different physical storefront elements, such as the one pictured for Aba Chicago, in Figure 1, are absent. This leaves the online menu as the main way to attract customers.
Since the menu is the main online touchpoint, an unattractive or poorly organized menu can have a huge negative impact on a merchant’s online conversion rate, regardless of the quality of the food. If a merchant does not design its menu correctly, customers won’t be as attracted to their online offerings and will not buy as often. In order to succeed online, merchants need to utilize a set of menu-building best practices to attract new customers.
In order to discover the characteristics that make for successful online menus, we utilized machine learning (ML) to analyze thousands of existing menus on DoorDash’s platform. We were able to translate characteristics of menus into a series of hypotheses for A/B experiments. We saw a hefty improvement in menu performance from experiments involving header photos and more information about the restaurant. We intend to conduct further experiments around adding targeted photos, increasing description coverage of key items, and making changes to item options.
Aligning merchant and customer menu needs
The first step in menu design is figuring out what the merchant needs to show and align it with customers’ expectations.
For merchants, ensuring their menu fairly and accurately represents their business online is usually the highest priority. This can be a challenge for merchants as the in-person and delivery dining experiences vary greatly. Furthermore, designing this online experience requires addressing several questions:
Should merchants have the same on-premise and online menu to present the same experience across all channels, or should there be a different online experience?
Consumers are able to make modifications in restaurants by asking the staff for help. To what extent should modifications be possible on the online menu?
What are the food options a merchant should provide and how complex should they be? Should the menu provide elements such as pictures, detailed item descriptions, and standard substitutions, or will that amount of detail make browsing difficult.
These are all questions that determine an online menu’s complexity and how much a merchant is able to show off their items and recreate what it feels like to dine in.
Figure 2: Muhammara, a classic hot pepper dip in Mediterranean mezze spreads, can be foreign to customers new to Mediterranean food. An image and description would help the decision-making process for customers.Photo Credit: Jeff Marini
Merchants need to make sure their own requirements align with customers, who want online menus to be a delightful experience that helps them make ordering decisions. While staff at restaurants can help sell the menu by crafting a story around a menu item or giving live recommendations and advice, this will not be the case online. For example, customers might not be familiar with muhammaras, shown in Figure 2, and require much more information from the online menu, including photos and descriptions, to make the leap and order it.
Customers will need help when parsing an online menu to make their decision, but assistance will have to be given in new ways that work online. This assistance might take the form of a simplified menu that prevents decision-fatigue by cutting out unpopular items, adding more detailed descriptions and labels to explain the remaining menu items, and clearly categorizing items to make the menu easier to navigate.
Defining the elements of an online menu
Before we jump into how we analyzed menus, let’s first define their key characteristics. Reconciling the key considerations of merchants and customers yields three key elements for online menu design:
Structure
Customizability
Aesthetics
Structure: With structure, a merchant is considering the complexity of their menu. Do they want the menu to be short and simple? Or would they prefer an incredibly long and detailed menu?
Customization: Without staff explaining the menu or guiding decisions, the customizability of individual items and the addition of different options becomes a key consideration.
Aesthetics: Last but not least, what are the different visual elements that can be added to an online menu to make it as attractive as possible and a good brand representation?
With these key elements in mind, we can discover the top individual factors that lead to designing a great online menu.
Using ML to figure out the most influential menu features
It can be difficult to collect data on menus to discover their most influential features. Most menu data is quite unstructured and based on optical character recognition (OCR). While OCR is reliable for structured text within documents, it is a challenge to represent text on a menu. Menus are often not structured linearly and one would have to contextualize different menu categories with item names and descriptions for accurate representation.
Luckily, DoorDash has over a hundred thousand restaurants with menu data formatted in a way that is understandable and analyzable. We are able to include all of these menus and their corresponding conversion rates in a model that predicts the top factors for well-performing menus.
Defining the feature set for each layer of the menu design
We define a successful menu as one with a high conversion rate during a determined period of time. This model design is quite generalizable and reusable, as it’s easy to swap out the target variable with another top line metric to get another angle on menu performance.
In building the set of features for the model, we looked at each layer of a menu, from the high-level menu appearance to detailed modifiers for each item. For each layer, we brainstormed features relating to the key elements mentioned above: structure, customizability, and aesthetics.
At the highest level, we considered the overall menu appearance. How many items and categories does the menu contain? Are the menu items well photographed? How do the different top-level designs of menus, as shown in Figure 3, below, determine customers’ first impressions?
Figure 3: Different merchants structure their menus differently. Duck Duck Goat in Chicago’s West Loop keeps to a minimalistic but comprehensive selection of categories, including many combo options. Evanston’s Napolita Pizzeria has a very long menu following a traditional italian menu structure, complete with popular item photos, header image, and logo. Big Star, in Chicago’s Wicker Park, has a very simple menu showing two main categories for food (classics and tacos) and a consistent photo layout.
We then move down to the category level. What types of categories are there? Are there special categories, such as “Nonna’s specials” if it is an Italian restaurant? Were the categories mostly representative of the menu’s appetizers, mains, sides, or desserts? As shown in Figure 4, below, some merchants use special categories to create meals with existing items while others use these categories to house off-menu or limited-time items.
Figure 4: Duck Duck Goat’s menu displays combo options of their most popular items in a special combo category. Aba’s menu offers a chef’s special category that includes limited-time items.
In the next level down we consider items. What types of items are there? Do they have descriptions that help explain the item? How do price points vary across items? Adding descriptions, as Duck Duck Goat does in Figure 5, below, helps customers understand the ingredients in a dish and set expectations.
Figure 5: The Duck Duck Goat menu includes detailed descriptions of popular items to help consumers make choices among its popular items.
Finally, at the lowest level of detail, we have item options. How customizable are these items and what are the types of options and modifiers available? While some merchants provide a running list of options for each item, such as Pho888’s menu in Figure 6, below, some merchants prefer to keep the option list short to limit the online menu and simplify preparations.
Figure 6: Pho888 includes multiple extra options for each pho item. This is quite common across noodle and pho merchants. Meanwhile, Avec has a $30 option to add lobster to its paella dish. Most extra options cost a few dollars, so Avec’s is an example of a menu with a premium extra option.
Implementing our model
To find out which menu features were the most influential in menu conversion, we use the features mentioned above as inputs to regression models predicting menu conversion. We built our initial regression models with linear regression models and base tree models to achieve a baseline error. While the results were interpretable, the error rate was quite high. Furthermore, many of the features seemed to be correlated, which led to the issue of collinearity.
To further improve the model, we calculated VIF values to prune overly correlated variables. LightGBM and XGBoost proved the most accurate, so we chose them as the final models.
Despite the improved model performance, it was difficult to determine how changes in each feature impacted the target variable directionally. This issue of explainability has always been a pain point for black box models that perform better.
To solve this black box issue of not knowing the impact of each variable, we used Shapley (SHAP) values, a game theoretical approach towards model explainability. SHAP values represent the marginal contribution of each feature to the target variable and are calculated by computing the average marginal contribution to the prediction across all permutations before and after withholding that feature.
The resulting model summary plots are effective in demonstrating relative feature importance and directional impact on the feature variable.
Figure 7: A summary plot from the final XGBoost model shows the SHAP values of each feature ranked by feature importance.
The factors most correlated with a successful menu
Examining the resulting SHAP plots of the final XGBoost model, the top success factor was the number of photos on the menu. This is particularly important for the top items in a menu as photo coverage for such top items determines the overall appearance of the menu.
Other top factors and recommendations for merchants include higher customizability for their items. Customers enjoy some optionality within top items and the ability to customize an item provides a degree of familiarity associated with dining in. It’s easy to imagine a customer being turned off if they cannot ensure their desired dish is mild, medium, or spicy.
Menus with a healthy mix of appetizers and sides also converted better. This provides customers with more choices to complete their meal and can lead to higher cart values for merchants as well.
Specific cuisines have varying ideal menu characteristics
While the top factors that led to successful online menus are not surprising, rerunning the models across different merchant categories led to interesting variance in top menu factors. This variance in the successful menus is a case where “averages lie”, when the average does not represent a normal distribution, and suggests that not all menus should be built the same way to be successful. By better understanding customers’ expectations about certain types of restaurants, merchants are better able to build and customize their menu into a truthful representation of their brand and food that these customers will understand.
The clearest example of customer expectations at work was with Chinese menus. Unlike most other menus, Chinese menus that were long and had many items tended to perform better. When customers dine in at Chinese restaurants, a long and complicated menu (sometimes with regional specialties) indicates authenticity, as the restaurant is capable of making all these different dishes. As an example, see the menu depicted in Figure 8, below. Customer expectations about an authentic Chinese menu leads to these complicated menus having greater conversion rates.
Figure 8: A Place by DAMAO is a good example of a Chinese menu that has many items, detailed categories, and represents multiple authentic dishes. Each dish also has a longer name describing its additional ingredients.
On the opposite end of that spectrum, menus for wings and pizza places tend to be shorter, well photographed, and have a myriad of options for customization. Customers usually visit these merchants with one or two items in mind and are just looking for customizations like extra sauces for wings or additional toppings for pizzas.
These specific recommendations and differences across successful menus are also not limited across cuisines. There are specific nuances as well within a single cuisine. For example, the menu of a Chipotle restaurant would be very different from the menu of a local food truck. While menus of large brands are relatively well known and convert well as customers know what they’re getting, the local spots have to put more effort into pictures and descriptions to help customers take the leap of faith and order from them.
What’s next in menu optimization
Given this prioritized list of features from our ML models, we are continuing to leverage the learnings and translate them into hypotheses around improving menu conversion and sales. Upcoming experimentation includes adding different types of photos across item types and the menu page and presenting items with a richer level of detail in their descriptions.
While it is one thing to let merchants know what factors lead to the highest conversion, we’re also working to make menu updates as intuitive and valuable for merchants on our platform. As such, we are continuing to experiment with new products to help merchants build ideal menus and better delight and intrigue their customers.
On the merchant enablement end, the learnings of which menu factors to prioritize can be collected into a much more detailed style guide for merchants of particular cuisine types. Tools such as the DoorDash Merchant Portal, our one stop shop for merchants to manage their performance on DoorDash, and the accompanying menu editor tool can be improved to make it easier to customize for extra options and give customers more context around the items they are ordering.
On the customer features side of the equation, this could mean new and improved menu designs to help highlight top items and categories, and allow for merchant stories to highlight their value proposition. The improved menu interface can help bridge the gap between the digital storefront and the traditional physical experience.
With these additions to our products and merchant education, we hope that merchants will be better equipped to control how they present their brand and digital storefront to their customers. Doing so will not just help improve their online sales but better reconcile and complement their physical and digital brands.
Acknowledgements
Thank you to Karthik Tangirala, Ariel Posner, Imani Joy, Govind Lingam, Selina Her for talking through product, design, and research insights on menus and Ezra Berger, Jessica Lachs, Alok Gupta, Kevin Teng, Jane Gladshteyn, Megan Han, Mihir Sathe for helping proofread and edit the article!
I’m thrilled to publicly share that DoorDash has established an engineering presence in Seattle! As DoorDash continues to grow its footprint across the US and beyond, it’s time for our Engineering team to expand along with it. I’m excited to welcome the builders and creators of the Northwest to join us on this exciting journey—we’re just getting started and we’d love for you to be a part of our growing team.
As someone who has worked at centralized headquarters and remote engineering offices I know first-hand what it takes to make this model thrive: a growth-oriented team given the autonomy to execute, along with end-to-end ownership of critical business initiatives which remain deeply connected to headquarters. In that vein, Seattle will be home to two very exciting products in the DoorDash ecosystem: DoorDash Drive and DashMart.
DoorDash Drive is our logistics platform for merchants, enabling businesses to leverage our network to expand their footprint and customer reach through their own channels, with deliveries fulfilled by Dashers. It’s our way of opening up DoorDash to merchants who want to enable on-demand delivery with ease, leveraging the power of our platform to handle the last-mile delivery logistics. Drive is a mature but rapidly growing business, with tons of exciting work ahead of it as we expand into a number of new verticals: grocery, retail, alcohol, pizza, and more. Our mission is to transform DoorDash into a platform that can deliver anything to anyone.
DashMart, announced in August, is a new type of convenience store offering both household essentials and local restaurant favorites to our customers’ doorsteps. On DashMart, you’ll find thousands of convenience, grocery, and restaurant items, from ice cream and chips to spice rubs and packaged desserts from the local restaurants you love. DashMart stores are owned, operated, and curated by DoorDash and are currently available in over a dozen cities, with many more coming soon. We’re looking to build a founding team of engineers to help enable the rapid expansion of DashMarts across many of our major US markets, pushing the limits of on-demand convenience in the digital age.
Engineering work in Seattle will mean something a little different during a global pandemic. For the next several months we’ll continue to work virtually while we secure an office to facilitate collaboration when we return to work. Regardless of in-person interaction, we’re building a place to do your best work, with the commitment and support of a leadership team that’s invested in your growth and success. As we assemble a team we’ll prioritize:
Outcomes and Impact: We are a team of builders and our ability to deliver value for our customers is paramount. We’ll focus on the substance of solving challenging problems and will seek to create space for front-line teams to innovate with autonomy and ownership. We take immense pride in the craft of our work and expect you will as well.
Diversity and Inclusion: Our merchants, Dashers, and customers represent the diverse perspectives, backgrounds, and identities that make local communities vibrant places. We are committed to not only reflecting this diversity within the four walls of DoorDash, but also fostering deeper moments of inclusion in our products and within our teams. Integrating D&I values into the ways we hire, promote, and behave is an important commitment to make and we believe an inclusive environment is a competitive advantage—diverse teams drive growth and innovation and push all of us to be better.
Fun: Beyond the psychological safety that comes from fostering inclusion, we believe that everyone should bring their authentic selves to work and enjoy what they do. Too many people get caught in the tension between “living to work” and “working to live.” At DoorDash Seattle, we strive to break this mutual exclusion, creating an environment where you can bring your best self to work every single day.
On a personal note, I’m incredibly excited to have recently joined DoorDash to help it expand into the Seattle area. I’m a builder at heart and have been impressed by the execution prowess and innovation that DoorDash has pioneered in the delivery space. I’m also a huge believer in the value that gig work provides for earners around the globe and see DoorDash as playing an increasingly critical role in protecting and evolving flexible work models that millions have come to depend on; all while creating significant value for businesses and merchants on the platform.
Our team in Seattle is growing quickly, with plans to hire 100 engineers over the next 12 months! Joining us will give you an opportunity to work on game-changing products and become part of the cornerstone of the Seattle engineering culture. If you’re interested in contributing to a high impact team that has the power to transform last-mile logistics, check out our current tech roles open in Seattle!