Skip to content

A topic of great debate among many engineers is whether or not SwiftUI is ready for enterprise. It’s no secret that DoorDash has fully embraced it in our Consumer app, as we recently held a technical meetup to share many of the challenges we’ve overcome. Our biggest challenge, however, has been dedicating enough time to rewrite multiple applications in parallel.

Starting with iOS 13, Apple offered a drastically different UI paradigm in the form of SwiftUI. It was a major departure from UIKit with reactive data pipelines and a declarative syntax. Many enterprise codebases are driven by a one-way data flow (e.g. VIPER, MVVM-C), whereas SwiftUI takes advantage of two-way data flow in the form of bindings and observables.

Our team saw a unique opportunity to build new features with SwiftUI, while isolating them within our existing VIPER architecture. This bottom-up approach would allow for incremental improvements and prove less disruptive to other developers. It also had the added benefit of being completely agnostic to the rest of the codebase; other features would continue to use the established VIPER interface, never requiring knowledge about implementation details of the View layer.

Why adopt SwiftUI with a bottom-up approach?

Adopting SwiftUI with a bottom-up approach is better because it minimizes risk by being less disruptive, while allowing for incremental improvements.

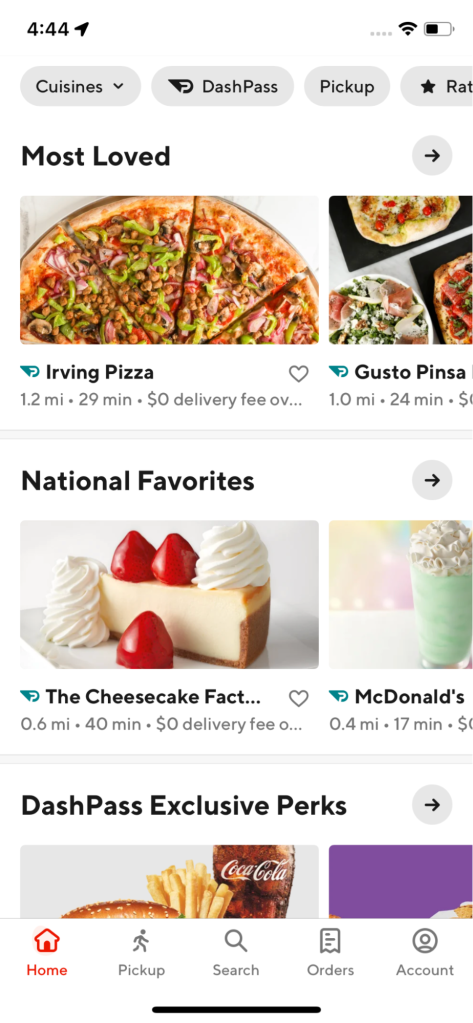
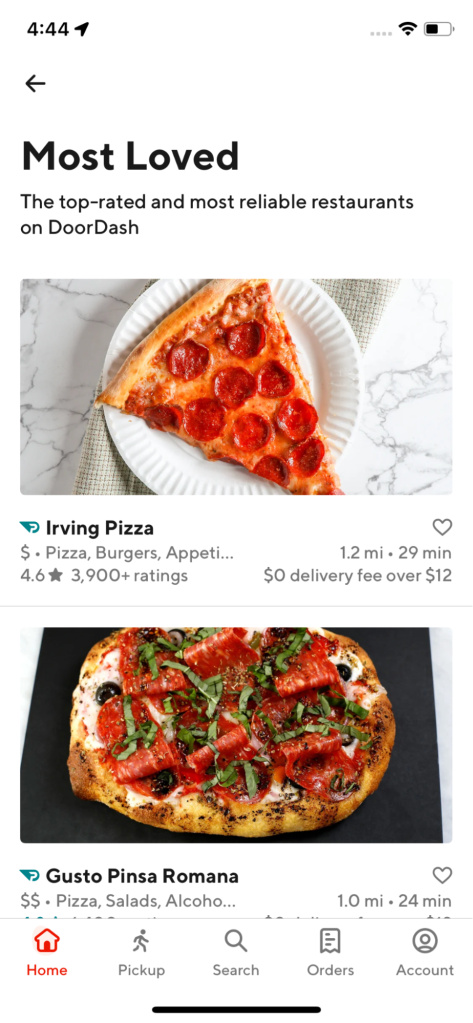
Introducing a new UI paradigm would be a considerable risk for an established application like Dasher, which is used by delivery drivers to accept and carry out food order offers. Forcing other teams to change the way they work would considerably lengthen development times. Therefore, adopting SwiftUI with a top-down approach was out of the question. DoorDash elected to rewrite the Consumer app last year, which we estimated would take thousands of engineering hours to complete. Our bottom-up approach would mitigate the impact to other teams by working within the existing module-level boundaries. Working within these constraints allowed us to use SwiftUI for new modules without requiring changes to the existing code.

Stay Informed with Weekly Updates

Subscribe to our Engineering blog to get regular updates on all the coolest projects our team is working on

Mitigating the challenges of embracing new technologies

Adopting cutting-edge features is not a new problem. There are always new trends and features being introduced, and engineers are always looking to try them out. Companies typically take one of two approaches.

Top-down

A top-down approach involves throwing out, or rewriting the entire application in favor of new code with the latest technology. There are many great reasons to take this route. One of the most significant is that it avoids migrating legacy code. Often this code would have been written by people who have left the company, or may have required special knowledge of how portions of the application worked. Many hundreds of engineering hours worth of effort can often be spent on maintaining legacy code. This effort is no longer required in a rewrite. Starting with a clean slate allows for consistent patterns and references in the codebase, rather than having multiple ways to achieve the same result.

New developers will often look for examples when building new features. If a technology is partially adopted, as it would be in a bottom-up approach, there may be more than one way to achieve the same result, which can lead to uncertainty. There’s also the added benefit of appealing to engineers’ love of the “new and shiny”, which can be great for hiring and morale. It can be off-putting to hear that companies are using older technologies during the interview process.

There are several drawbacks to taking a top-down approach, the biggest one being the large, upfront investment: features that are working today will take time to rebuild using the new approach. Reimplementing legacy features is a difficult task, as often the system has very specific quirks that have been patched in across iterations of the software. Some of these quirks may even be the preferred workflow for users. Rebuilding an entire application will always result in unexpected challenges and results. Large companies like Uber developed their RIBS architecture during a well-documented rewrite. Pinterest explored a completely new architecture by starting from scratch. With so many different risks, it is often difficult to estimate the amount of time a top-down approach will take. A top-down approach increases the risk of instability in an existing project as there are lots of moving parts: everything is being rewritten, engineers may need access to the same segments of code, or the chain of dependencies may be non-trivial.

Bottom-up

A bottom-up approach, sometimes referred to as the Strangler Fig Pattern, named after the Strangler Fig tree, allows new technologies to be adopted at a measured pace, rather than disrupting the entire application. New features can be built by leveraging existing interfaces, or introducing new ones, without impacting upstream or downstream features. Legacy features can be rebuilt using the new technology incrementally, rather than all at once. New code paths can be validated using AB testing before retiring the legacy implementation.

Introducing the new approach at a measured pace allows engineers more time to get comfortable with the new technology, as features can be implemented using the legacy or new approach, until such a time as the new approach is proven.

As with any alternative approach, there are associated costs. The first few features tend to be agnostic to legacy code, but there will be a point where the two approaches will need to exchange information. Depending on the architecture and choices made, bridging or translation code may need to be built. This requires extra time from the engineers who are familiar with both patterns. Building these bridges tends to allow legacy code to linger in the system much longer than a top-down rewrite. The system will develop multiple patterns to solve similar problems, which makes it much more difficult for new engineers to onboard and take “the right approach” when implementing a new feature. In extreme cases, if the new approach isn’t fully adopted, or is even abandoned, the bottom-up approach will have added a significant amount of tech debt, effectively negating the gains supposedly being provided by the new technology.

A quick recap of DoorDash’s use of the VIPER architecture

DoorDash uses the VIPER architecture to great effect, allowing isolation between features as they are developed. The isolation provided an incredible opportunity to build features much faster given the team’s level of experience with SwiftUI. Further details of the VIPER architecture are available in many articles. We recommend the one published by the team from Objc.io: Architecting iOS Apps with VIPER.

DoorDash’s Dasher application is built using a collection of modules. Typically, each Module represents a specific feature, such as receiving an incoming order or reviewing your personal ratings. Modules are self-contained and always utilize a View, Interactor, and Presenter to ensure a one-way flow of information.

Views make requests to Interactors, who in turn retrieve Entities from remote services. Once a request has been completed, the Interactor will then hand the data to the Presenter, which translates the data for the View to display. Routers are used in more complex use cases to manage how and when a new View should be presented.

Anyone familiar with SwiftUI will likely spot an immediate barrier to adoption. SwiftUI prefers bi-directional data flow provided by property wrappers such as @State and @Binding. The team was faced with a choice:

  • Continue implementing the View layer with UIKit, build a reactive architecture inside our application, and move wholesale to SwiftUI and Combine
  • Strike a balance, and develop a solution that could allow individual modules to decide whether or not they were using SwiftUI or UIKit.

How DoorDash integrated SwiftUI into a VIPER-based app with a bottom-up approach

Our team chose to introduce a way to use SwiftUI within the confines of our VIP architecture. This approach would only be applied to the new features we were building as a way to prove SwiftUI could be reliably integrated within the Dasher application alongside our existing UIKit features. Our approach would avoid the significant time investment of rewriting existing features and instead allow the View layer to become an implementation detail that varied between modules.

Our approach to integrate SwiftUI into a VIP architecture required a few additional elements:

  1. State:
    1. A module-level reference type
    2. Serves as a Single Source of Truth for the module data
    3. A receiver for data passed via the Presenter
    4. A container for various combine publishers, which produce down-stream data and state (to be consumed by one or more ViewModel instances)
  2. ViewModel:
    1. A view-level reference type
    2. An Observable that calculates ViewState deltas
  3. ViewState:
    1. A view-level value type
    2. Encapsulates data received via state changes, as driven by the Presenter
Figure 1: Reactive VIP

Figure 1 demonstrates the unidirectional data flow of Reactive VIP. The typical UIViewController subclass is replaced by a UIHostingController. The ViewModel adopts the communication path to the Interactor formerly owned by the View. The hosting controller would be responsible for constructing and displaying the root-level SwiftUI View for the Module. The hosting controller would also own the module-level State, acting as a source of truth for all data in the Module. Construction of the top-level SwiftUI View inside the hosting controller’s init function would allow the root ViewModel to reference the values published from the module’s State object. Data received from the Presenter would be received in the hosting controller, as is typically the case in VIP, but the data would be passed as-is to the appropriate part of the module’s State. ViewModels would then expose a ViewState to their respective SwiftUI views which act as a snapshot in time.

It’s no secret that navigation in SwiftUI is a topic of great debate. Given that we were building features in a contained way with SwiftUI inside VIP, we completely delegate navigation to VIP via Routers. This ensured app navigation was always handled through a consistent interface. 

Getting started with Reactive VIP

Consider a feature where we want to keep track of the number of times a user has tapped a button. To keep track of the tap count, we might need to call the backend to record the count, the backend will then return the updated data and then we should display the latest information to the user.  Let’s break the feature down based on the architecture above.

Traditional VIP elements

Module
  • Navigation and external communication passes through this element
  • Receives and manages app life cycle events (if needed)
  • Constructs the VIP elements, retaining ownership of the View

struct Entity {
    let name: String
    let count: Int
}
 
class Module {
    let view: ViewProtocol
 
    init() {
        let presenter = MyPresenter()
        let interactor = MyInteractor(presenter: presenter)
        self.view = MyHostingController(interactor: interactor)
        presenter.view = view
    }
}
View (Hosting Controller)
  • UIHostingController acts as a bridge between UIKit and SwiftUI
  • UIKit’s life cycle ends here and SwiftUI begins from here
  • The rootView is not recreated every time data changes

protocol ViewProtocol: UIViewController {
    func showUpdatedContent(
        updatedName: String,
        updatedCount: Int
    )
}
 
class MyHostingController: UIHostingController<MyView> {
    private let state = MyState()
 
    private let interactor: Interactor
 
    init(interactor: Interactor) {
        self.interactor = interactor
 
        // In some cases, the hosting controller can create an
        // intermediate type to publish property changes to the
        // ViewModel all at once.
        // e.g.
        //
        // let viewStoreSubject = PassthroughSubject<ViewStore, Never>
        //
        // struct ViewStore {
        //    let updatedName: String
        //     let updatedCount :Int
        // }
        //
        let namePublisher = state.$name.eraseToAnyPublisher()
        let countPublisher = state.$count.eraseToAnyPublisher()
        let myView = MyView(viewModel: .init(
            namePublisher: namePublisher,
            countPublisher: countPublisher,
            interactor: interactor
        ))
        super.init(rootView: myView)
    }
 
    @MainActor required dynamic init?(coder aDecoder: NSCoder) {
        fatalError("init(coder:) has not been implemented")
    }
}
 
extension MyHostingController: ViewProtocol {
    func showUpdatedContent(updatedName: String, updatedCount: Int) {
        DispatchQueue.main.async { [weak self] in
            self?.state.name = updatedName
            self?.state.count = updatedCount
        }
    }
}
Interactor
  • Handles actions received from the View layer
  • Communicates with various services including analytics, logging, or side-effects produced by user actions
  • Dependencies can be injected here to access services provided by other areas of the system

protocol Interactor {
    func didTap()
}
 
class MyInteractor: Interactor {
    private let presenter: Presenter
    private var entity = Entity(
        name: "Mr. SwiftUI",
        count: 0
    )
 
    init(presenter: Presenter) {
        self.presenter = presenter
    }
 
    func didTap() {
        // Sample business logic
        entity = Entity(
            name: entity.name,
            count: entity.count + 1
        )
        DispatchQueue.global().async { [weak presenter, entity] in
            presenter?.update(from: entity)
        }
    }
}
Presenter
  • Abstracts the View layer from the Interactor
  • Transforms data received from services for the View layer 
  • Very lightweight, least amount of responsibilities of all elements

protocol Presenter: AnyObject {
    func update(from entity: Entity)
}
 
class MyPresenter: Presenter {
    weak var view: ViewProtocol?
 
    func update(from entity: Entity) {
        view?.showUpdatedContent(
            updatedName: entity.name,
            updatedCount: entity.count
        )
    }
}

Reactive Components

State
  • Acts as a single source of truth for the module
  • Passes data to SwiftUI via published changes
  • Lives in the same file as the hosting controller as a private element

private class MyState: ObservableObject {
    @Published var name = ""
    @Published var count = 0
}
View (SwiftUI)
  • ViewState establishes a one-to-one relationship between the SwiftUI View and the source of truth
  • This approach ensures that there is a single direction of communication
  • Business logic is migrated out of the View layer, making it much easier to mock and test

struct MyView: View {
    struct ViewState {
        var name: String
        var totalTaps: Int
    }
 
    @ObservedObject var viewModel: MyViewModel
 
    var body: some View {
        VStack {
            Text("Hello \(viewModel.viewState.name)")
            Text("You pressed the button \(viewModel.viewState.totalTaps) time(s)")
            Button {
                viewModel.buttonTapped()
            } label: {
                Text("Tap Me")
            }
        }
    }
}
 
struct MyView_Previews: PreviewProvider {
    static var previews: some View {
        MyView(viewModel: .init(
            namePublisher: Just("Name").eraseToAnyPublisher(),
            countPublisher: Just(0).eraseToAnyPublisher(),
            interactor: MyInteractor(presenter: MyPresenter())
        ))
    }
}

ViewModel

  • The ViewModel acts as a data bridge
  • Accepts data via the State’s published properties
  • Signals user actions to the interactor
  • Abstracts these dependencies makes it easy to unit test ViewModels

class MyViewModel: ObservableObject {
    @Published var viewState = MyView.ViewState(
        name: "",
        totalTaps: 0
    )
    private let interactor: Interactor
    private var namePublisherCancellable: AnyCancellable?
    private var countPublisherCancellable: AnyCancellable?
 
    init(
        namePublisher: AnyPublisher<String, Never>,
        countPublisher: AnyPublisher<Int, Never>,
        interactor: Interactor
    ) {
        self.interactor = interactor
        self.namePublisherCancellable = namePublisher
            .sink { [weak self] newName in
                self?.viewState.name = newName
            }
        self.countPublisherCancellable = countPublisher
            .sink { [weak self] newCount in
                self?.viewState.totalTaps = newCount
            }
    }
 
    func buttonTapped() {
        interactor.didTap()
    }
}

Deliver features faster, with better testability using SwiftUI

Adopting SwiftUI with a bottom-up approach was a huge win for our project in a number of different ways. The team was able to deliver view-based tasks 50% faster than was previously possible, much of this is attributed to reduced iteration time thanks to SwiftUI previews and fewer lines of code needed compared to a UIKit view.

Adding these additional elements to our architecture accounted for a small amount of overhead, but this was balanced by a reduction in the Interactor and Presenter layers. Future iterations on our architecture may include removal of these layers, but our initial goals were to modify the View layer and maintain VIP architecture patterns to ensure compatibility with other UIKit-based modules.

Another big win was increased testability thanks to the 1:1 relationship of ViewModels to Views. ViewModels were simple enough that they could be mocked, which allowed us to implement snapshot testing with a small amount of additional work, which we had time for as a direct result of reduced view implementation times.

This win was significant since SwiftUI adoption has been limited. iOS 13 introduced SwiftUI, but on a limited scale and with a significant amount of issues.  Many engineers are hesitant to adopt SwiftUI as they feel it is not “enterprise ready”. This experience suggests engineers should review the statistics of their install base, as the same devices can run iOS 13, 14, and 15. Take advantage of the improvements later versions of SwiftUI offer and bump the minimum version today–we did!

Our next goal is to broaden the adoption of our solution and to help other engineers bring SwiftUI to their features.

How you can adopt SwiftUI in your enterprise project today

As many engineers know, implementing features with a high degree of velocity is a key factor in today’s product-driven economy. It can be very difficult to sell product stakeholders a plan to rewrite an entire application. The effort involved is always extensive, and it can be difficult to achieve feature parity in a short amount of time, let alone add something new. It can prove to be more difficult if there are constraints around testers, or if the system lacks a comprehensive set of feature-level tests.

Adopting SwiftUI in an enterprise-grade application can also be a tough sell, many architectures are built around UIKit’s procedural model. These factors make it crucially important to identify a small enough slice of your architecture to support SwiftUI. Working within these confines, adopt SwiftUI with a bottom-up approach to mitigate much of the downside of a rewrite and take advantage of the speed and testability offered by SwiftUI in your development cycles. New features can be written alongside existing ones without introducing additional hurdles for others working on your product. Existing features can be left as-is, or a plan can be established to rewrite them at an acceptable pace, but they won’t hinder the system as a whole.

When expanding from made-to-order food delivery to new product verticals like groceries, convenience, and retail, new challenges arise, including how to ensure inventory will be available to fulfill orders. As a business, we always want customers to receive all the items they ordered. For restaurant orders, this is easy to do because merchants offer relatively small menus and it’s uncommon for dishes to become unavailable. However, as DoorDash expands its business into new verticals like grocery stores inventory becomes more of an issue. Grocery merchants have inventories with hundreds of thousands of SKUs requiring Dashers — our name for delivery drivers — to enter stores and shop for the items required to fulfill a delivery. This Dasher shopping experience has two unique challenges:   

(1) the item ordered is not available or not found, and/or

(2) the Dasher can’t find a good substitution for an out-of-stock item on the customer’s behalf 

Here we will dive into the details of how we’re solving the second problem with machine learning by recommending relevant substitutions. 

Why we need a substitution recommendations model

Before we start the development of any machine learning project at DoorDash, we seek to understand — from first principles — how a predictive model might improve the customer experience. Naturally, we want to create a seamless experience for customers that ensures they receive an acceptable substitution if what they originally ordered is out of stock or cannot be found. It’s a win-win outcome when we are able to offer a good substitute; the customer gets something equivalent to what they ordered, which means, for instance, they have all the ingredients they need to cook their recipe. Additionally, DoorDash does not need to refund the cost of the original item and the merchant doesn’t lose out on any sales. 

Legacy chat solution 

Before we rolled out a recommendations product for substitutions, the customer experience was full of friction. When an item was out of stock, Dashers would have to call or text customers while they were in the store to discuss alternative options and agree on a substitute item. While this approach could lead to a good substitution, it was time-consuming and exhausting for both the customer and the Dasher. So, we set out to create a low-friction way to collect a customer’s substitution preferences ahead of time. Dashers then could meet customer needs without any back-and-forth communication. To build this experience effectively, we needed to show customers high-quality substitution recommendations that had been generated programmatically with a machine learning (ML) model. 

The evolution of our recommendations algorithm

Our recommendations model evolved over time alongside our substitution UI menu, as shown in Figure 1. We started with an unsupervised approach, then proceeded to binary classification, and eventually pursued a deep learning recommendation model.

New UI that allows customers to engage with substitution recommendations
Figure 1: New UI that allows customers to engage with substitution recommendations

Phase 1: An unsupervised approach 

When DoorDash first launched these new product verticals, we didn’t have much labeled data indicating what customers believed were good or bad substitutions. To resolve that problem, we started out with an unsupervised approach that leveraged our item metadata. We found a simple yet effective technique for identifying similar items involved using TF-IDF cosine similarity based on an item’s name. Furthermore, our catalog team built out a well-defined taxonomy that let us apply heuristics on top of the text-based similarity score to restrict recommendations to relevant categories. This approach, for example, successfully recommended other Coca-Cola products when customers ordered a 12-pack of Coca-Cola, as shown in Figure 2. 

Figure 2: Example of recommendations using an unsupervised model
Figure 2: Example of recommendations using an unsupervised model 

Phase 2: Binary classification with LightGBM

After we established the initial unsupervised model, the team set out to collect more labeled data. Working closely with the product and engineering teams, we launched a feature that asked consumers to rate suggested substitutions as either “thumbs-up” or “thumbs-down.” This provided the data needed to establish a customer feedback loop, a critical next step in our recommendations journey. After we collected enough data, we moved to a supervised learning approach. This required building a binary classifier to predict the probability that any item in our catalog would be a good substitute for an ordered item. We chose to use LightGBM for this phase because of both its relatively high performance with minimal hyperparameter tuning and its history of success in many machine learning applications at DoorDash. 

Incorporating customer feedback allowed us to identify more relevant substitutions that extended beyond superficially “similar” items. In Figure 3, we expand on our earlier Coca-Cola example. Customers who have ordered a 12-pack of Coca-Cola would rather substitute a 12-pack of Pepsi or Dr. Pepper than a two-liter bottle of Coke. As it turns out, quantity is more important than brand loyalty when customers are ordering in bulk. 

Figure 3: Example of recommendations using a LightGBM model 

Phase 3: Deep learning recommendations model 

The team built product features to show these recommendations to more customers and across more surface areas as the quality of recommendations improved. As a result, we were able to collect an increasing volume of customer feedback. As the data expanded, we explored using a deep learning recommendation model implemented in PyTorch. First introduced by Facebook several years ago, this model combines principles from approaches based on collaborative filtering and predictive analytics. Specifically, categorical features (or in this context, items in our catalog) are processed as embeddings and there is a bottom MLP that encodes our dense feature. Next, feature interactions are computed explicitly and the results are processed to discern a top MLP, which is fed into a Sigmoid function to yield a probability score. 

This approach relies on having high-quality embeddings. Fortunately, we were able to leverage existing work from the DoorDash ML team, which already had been developing semantic item embeddings. These embeddings provide a richer representation of an item beyond the raw text-based TF-IDF vector because the embeddings are trained on the search behaviors of DoorDash users. This approach helped us identify better recommendations for items that are more difficult to substitute, such as items that have less historical customer feedback because of relatively lower purchase volume.  For example, as shown in Figure 4, the LightGBM model recommended canned corn as a substitute for canned green beans. The deep learning model, however, recommended canned green peas, because item embeddings accurately represent that beans are more similar to peas than corn.

Figure 4: Example of recommendations using a deep learning model with semantic item embeddings

Measuring recommendation quality and impact

One of our biggest challenges from the start was measuring the quality of our substitution recommendations and quantifying improvements. While we were using an unsupervised model, we leveraged manual reviews to measure recommendation quality. That involved identifying top-selling items across product categories and curating ideal substitutions for them to create a “golden” dataset. We then compared what percentage of the algorithm’s recommendations were matched by human-curated substitutions. 

Once we moved to a supervised model, we were able to use standard classification accuracy metrics like AUC to compare different model iterations offline. More importantly, we were able to apply an experimentation infrastructure to evaluate our models based on customer experience impact. Specifically, we tracked input metrics such as the customer approval rate (which represented the relevance of our recommendations) and coverage (percent of ordered items with recommendations). Ultimately, our goal was to drive key business output metrics and customer satisfaction, including how frequently we substituted items that weren’t found and how well customers rated those substitutions. As a result of the close collaboration and cross-functional effort across ML, product, and engineering over time, we were able to improve our business metrics by a substantial amount.

Conclusion

Data science teams seeking to build recommendation algorithms often run into the classic cold-start problem. This typically happens when a company is first established or when it expands into new product or service categories. Data scientists need to overcome many challenges to make step-by-step improvements, including building an MVP solution while working with cross-functional teams to collect the data they need. 

In these situations, DoorDash data scientists apply first principles thinking to understand the exact problem that needs to be solved with a ML model. Depending on a problem’s context, classic techniques like collaborative filtering might not be the best approach. Two important takeaways we learned were: (1) don’t underestimate simple solutions and (2) if labeled data is scarce, it can be worthwhile to invest in collecting item metadata.

Next steps include investing in richer item metadata for high-priority categories. For example, produce and meat are more difficult to substitute and customers tend to be more sensitive about these categories. Additionally, we can incorporate new things such as product attributes — for example, “organic” or “kosher” — as well as item image embeddings. We also plan to develop personalized recommendations because we’ve observed that customers have highly individualized substitution preferences. 

Acknowledgments

At DoorDash, early stage machine learning projects such as this often involve extensive cross-functional collaboration. Special thanks to Cam Miller, Kurt Smith, Thibault de Waziers, Emmanuel Chimezie, ThulasiRam Peddineni, Eun Ro, Meaghan Davis, Ben Friedman, and many others who’ve contributed! 

As e-commerce platforms grow, their web applications begin to slow and performance-boosting techniques are required to maintain their speed and functionality.

At DoorDash, we have faced similar problems as our web application has expanded, with users sometimes having to wait up to 10 seconds for the UI to load — potentially longer if the network is bad. We’ve been working to improve the web performance of our product to elevate the user experience. Here we share some of the challenges we’ve encountered and lessons that we have learned along the way. These five key actions can help any large platform enhance its performance metrics: 

  • Manage the JavaScript bundle size
  • Defer rendering of the DOM elements outside the viewport
  • Improve rendering time by reducing API bottleneck
  • Delay loading render-blocking resources
  • Apply the right cache policies

Manage the JavaScript bundle size

The performance of websites with large JavaScript bundles can be impeded because it takes longer for users to download the bundle to their devices and decompress, parse, and execute the bundle. Here are some things to keep in mind as part of managing bundle sizes.

How to detect performance issues related to bundle size

Tools like WebPageTest or Chrome’s Lighthouse dev tool can be used to audit a page and view a performance analysis report that includes identified issues and opportunities to improve them. As shown in Figure 1, opportunities such as “Reduce unused JavaScript,” “Avoid an excessive DOM size,” or “Reduce JavaScript execution time” indicate that the site’s bundle size needs to be reduced.

Figure 1: Lighthouse report to diagnose bundle size issues

How to reduce bundle size

First, analyze what’s in the bundle using tools like webpack-bundle-analyzer to determine which component/module/library contributes the most to the final bundle. Alternatively, use Chrome’s Coverage dev tool, depicted in Figure 2, to identify the “unused” code of a bundle in the current page.

Figure 2: Make use of the “Coverage” tab to discover unused code

Following this analysis many techniques can be applied to reduce the bundle size, including: 

These are well-known techniques that are easy to apply when the codebase is still small. But at DoorDash, the consumer website is already a massive codebase maintained by more than 60 engineers. Changes require coordination between teams and feature owners as well as enough manual/automated testing to ensure they don’t break high-traffic pages. Considering our time/resource restrictions, the techniques mentioned here didn’t suit our purposes, but we found other low-hanging fruit to reduce the bundle size.

Get a significant win by making sure dependencies are tree-shakable

To understand how performance improvements can enhance a DoorDash consumer’s conversion rate — from browsing restaurants on the homepage to checking out shopping carts successfully — we wanted to find any low-hanging fruit that could reduce the bundle size and improve website performance quickly. As seen in Figure 3, we started by analyzing DoorDash’s main bundle. We found a library called libphonenumber-js that is duplicated in many components of our internal design system.

Figure 3: A part of bundle analyzer result for DoorDash consumer website’s main bundle

Finding this library was a particularly useful discovery because most of these components don’t use ‘libphonenumber-js’ much, if at all. Instead, libphonenumber-js is inside every design system component because it’s a dependency of the common utility package (@doordash/utilities) in the design system and @doordash/utilities is a dependency of almost all design system components. Although the dependency chain caused the duplicate library to be introduced to each component, it should be tree-shaken during build time. That’s how we found out libphonenumber didn’t support tree-shaking until version 1.9.4. In the end, the fix was trivial. We only needed to update the version of `libphonenumber-js` used in the design system and bump the version of design system dependency used in the consumer website repository. This action eliminated 300KB from the main bundle after compression. Following release of this change, we observed a directionally positive conversion impact on web traffic of approximately 0.50% — which at our scale, is significant.

Defer rendering of the DOM elements outside the viewport

Using the Lighthouse tool to audit the DoorDash web page’s performance, we discovered — as shown in Figure 4 — that the website renders more than 5,000 elements, affecting the page’s runtime performance.

Figure 4: DOM size of a web page

The page delegates all of the heavy lifting involved in building the UI to the client-side. The more elements the page has, the more tasks the browser must do, such as recomputing the position and styling of nodes. A large DOM tree in combination with complicated style rules can severely slow rendering.

Users want to see the UI appear as fast as possible when they come to the web page. To load quickly, the page must render fewer elements at first; unfortunately, our web page renders all elements at the same time. To reduce the number of elements that render in the first load, we applied lazy loading to elements below the fold. We wanted to ensure that the page would only render necessary components within the viewport while deferring the rest. 

Before applying lazy loading, we had to consider whether or not it might affect our site’s search engine optimization (SEO) rankings. Typically, search engines prefer a site with rich content, but lazy loading defers the loading of content outside of the viewport. If web crawlers visit the website and see less content, our search ranking could suffer. Fortunately, the web page we audited doesn’t need to be crawled and cannot be accessed directly. That means the lazy loading approach did not harm our search ranking, so we were able to apply it to our web page.

To apply lazy loading, we first analyzed the UI to determine those areas that render the most elements in the page. Because the header and category menu are in the viewport when the page first loads and they don’t have many elements, we decided to apply lazy loading only to the curated areas as shown in Figure 5.

Figure 5: Curated sections of DoorDash’s home page

We saw significant reductions in loading speed based on First Input Delay (FID) readings. Here are the results after our 20-day experiment:

  • FID
    • Mobile: 67% improvement (from 145.44ms to 48.46ms)
    • Desktop: 46% improvement (from 11.46ms to 6.21ms)

Stay Informed with Weekly Updates

Subscribe to our Engineering blog to get regular updates on all the coolest projects our team is working on

Improve rendering time by reducing API bottleneck

For certain pages at DoorDash, we control various parts of the UI using configurations returned from APIs. These pages need to wait for an initial response before the rendering can begin. Unfortunately, some of these endpoints communicate internally with many different services to create a response for the client, which means it can take longer time to render.

To investigate, we used the performance feature of Chrome DevTools to research the website’s performance as shown in Figure 6.

Figure 6: Monitoring website health using Performance DevTools

From Figure 6, we noticed that at the initial rendering, there was a four second blank before rendering the contents on the page. Focusing in on the empty renders, we can see that the website makes several API calls. For server configuration-driven UIs, the response time of the configuration is vital for the first paint.

Using Chrome DevTools, we monitored the response time of the main API that returns the UI configuration to verify this. Our results are shown in Figures 7 and 8. 

Figure 7: Response time with good Wi-Fi
Figure 8: Response time with fast 3G

As shown here, the API takes seconds to respond, which defers UI rendering.

Ultimately, we are reminded that we need to measure API response when reviewing performance and some potential areas of improvements for this issue includes:

  • Rendering placeholder skeletons to provide a first meaningful paint
  • Rendering static contents not driven by API responses for pages where performance is more important
  • Making the first configuration request in SSR to provide an accurate first render

Delay loading render-blocking resources

When the user visits the website and before the page is rendered on the screen, it has to wait for synchronously-downloaded resources like CSS stylesheet or JavaScript to load or for the synchronous JavaScript tasks to finish executing. These issues can delay when the user can see the page. By eliminating these render-blocking resources, we may be able to improve the website performance.

Identify render-blocking resources

There are a few ways to identify render-blocking resources:

  1. Use Lighthouse in Chrome DevTools as shown in Figure 9.
Figure 9: Lighthouse report to point out render-blocking resources
  1. Check those resources loaded before the “DOMContentLoaded” event as shown in Figure 10.
Figure 10: Find resources loaded before DOMContentLoaded event

In the “Waterfall” panel of Chrome DevTools’ network tab, the blue line indicates when the “DOMContentLoaded” event was fired. This event will only be fired when the page’s initial HTML is fully parsed and DOM is built; resources loaded before this event — such as CSS and JavaScript — could potentially block the parsing and rendering process. 

Apply async/defer for render-blocking resources

The most common technique to eliminate render-blocking resources is to add the async or defer attribute to the script (for loading JavaScript) and stylesheet (for loading CSS) tags. This tells the browser those resources are not critical so the parser doesn’t have to wait for them to be downloaded before it continues parsing and rendering. This time, we also audited each page of the DoorDash website to make sure the right `async’ or `defer’ attribute is applied to those non-critical resources as shown in Figure 11.

Figure 11: Apply async/defer attribute to non-critical resources

Minimize the negative impact of render-blocking resources

Some CSS and JavaScript might be critical to the current page — which would make them unavoidably render-blocking — but a few techniques can minimize the negative impact.

  • Extract critical CSS and inline it inside the `head’ tag
    Extract only the CSS actually used in the page and put them inside the `head’ tag to load synchronously, then download the rest of the stylesheet asynchronously. With this technique, the browser doesn’t have to make an additional request to get critical CSS for this page, reducing the render-blocking time by parsing only critical CSS. In DoorDash, we use styled-components to build the UI and it injects critical CSS automatically, which means we didn’t have to make any changes.

Prevent long-running scripts from executing
While a script loaded synchronously can be render-blocking, a script with `async’ attributes applied also can be render-blocking when it finishes loading before the parser process completes. In such a case, the script is executed immediately, blocking the parsing and rendering. As a result, it’s important to avoid putting a long-running script in the `head’ tag. Figure 12 shows a few scripts that we audited.

Figure 12: Scripts that potentially could be render-blocking

Long-running scripts we audited this time

  • Optimizely.js: A synchronously loaded third-party script for A/B testing. The official documentation suggests that it should not be loaded as non-blocking to avoid page flickering, so we didn’t make any changes to this script.
  • Analytics.min.js: A wrapper for Segment analytics script, which is loaded asynchronously with the `async’ attribute. We found that we are using Version 1 but Version 2 has already rolled out to improve execution and load time. We opted not to upgrade because we have a company-wide plan to migrate the analytics client to an in-house solution.
  • Polyfill.js: All DoorDash web JavaScript polyfills are put in this file, which is loaded synchronously over a lengthy period of time (around 900ms in a non-throttling environment). But this polyfill is shared by all DoorDash websites, so we concluded that it’s too risky to remove anything before proper communication with the relevant teams. Instead, we took no action and will rely on the long cache expiring time for this file, but in the future, we could use tools such as Polyfill.io to load only polyfills needed by the requesting browser.

Although we didn’t find a quick win for this initiative, we believe there is value in auditing the website, listing all potential opportunities to improve in the future.

Apply the right cache policies

When data is cached, a copy is stored where it can be retrieved faster than going to the original source. However, using cached data can be problematic because it may not have the same updates as the source.

There are a lot of data involved in user interactions, including static assets — HTML, CSS, and JavaScript files to render the website, make it interactive, and provide image content and font files — and dynamic content, including user-input data which can be created, updated, read, and deleted in the system. These data could flow through:

  • User browser (service worker)
  • Application code
  • HTTP protocol
  • CDN
  • Load balancer
  • Backend server
  • Database

Each component that data passes through creates an opportunity to add a cache to retrieve the data faster than going to the source.

How to audit cached configuration

Configuring caches correctly can enhance website performance drastically. It also can be low-hanging fruit simply to add headers or toggle component configurations in the components we mentioned above. Here are a few techniques to audit the cache configuration. 

Check the HTTP cache

To confirm if HTTP caching is working as expected, check the size of each static asset (like JavaScript bundles, images, or fonts) using Chrome DevTools under the “Size” tab as shown in Figure 13.

Figure 13: Check if HTTP caching is configured correctly

If those assets are served from “disk cache” or “memory cache,” there may be no issue; the browser is getting them from the cache rather than fetching them from the CDN or server. To dive into how the cache is configured for each asset, check the response header for the values of Cache-Control, Expires, ETag, or Last-Modified.

Figure 14: Check if cache-related headers are properly configured

Even if there is no proper cache-related header configured, modern browsers are smart enough to use heuristic freshness to decide if a resource should be cached. Nonetheless, we recommend configuring them explicitly instead of relying on heuristic freshness, which is not deterministic and is highly dependent on the implementation of each browser.

Confirm the cache hit ratio in the CDN

The difference between CDN cache and HTTP cache is that CDN cached assets can be shared between all clients,including the browser, while HTTP cache can only be used by the browser of the current user’s device. To audit the configuration of CDN cache, go to the CDN’s dashboard (in DoorDash we use Cloudflare) to check the cache hit ratio and types of files being cached, as shown in Figure 15.

Figure 15: Check the cache hit ratio in CDN

Like the HTTP cache, CDN cache will respect the cache-control header setting, so if there is a static file which isn’t supposed to be modified frequently but has a high cache-miss ratio, start your investigation by checking the cache-control setting.

Confirm application-level cache

Inside the application code itself, you can cache the data in memory (i.e. store it in a variable) to save the cost of unnecessary API requests or duplicate and complex computation. For example, if you’re using Redux to manage the application state, you may use the reselect library to memoize the deduced state and prevent unnecessary re-computation. Follow these steps to audit your application-level cache configuration:

  1. Find the application’s computation-heavy or API request-heavy parts 
  2. Navigate away from those pages, then back again
  3. If the cache is configured for API requests, check the network tab in the dev tool to see if any extra API request is repeated
  4. If the cache is configured for heavy computation, use a console log to see if there is any unnecessary function call

At DoorDash, we use GraphQL and apollo-client, which support caches for queries (i.e. API requests) with multiple cache strategies. During our audit, we skimmed through the cache strategies of a few main queries to see if the applied policy justifies its use and also looked inside the cache to confirm if the expected data is there with the correct cache key.

Because everything worked as expected, we made no changes, but it was a good opportunity for us to audit our existing cache settings.

Conclusion

DoorDash’s web performance investigation generated many ideas and initiatives, most of which turned out to be dead ends. It’s challenging to apply performance techniques to a big codebase and also risky to do it for high-traffic web pages without thorough coordination and communication across teams. Nonetheless, we found a few quick wins to apply and learned useful lessons from the process, among them:

  • Manage Javascript bundle size: Check dependencies for bundle size and use capabilities such as tree-shaking to optimize.
  • Defer rendering of the DOM elements outside the viewport: To reduce execution time, only render necessary components within the viewport and make sure optimization does not worsen SEO. 
  • Improve rendering time by reducing API bottleneck: Measure API response time as well when reviewing web performance because it could be one of the bottlenecks.
  • Delay loading render-blocking resources: To limit render-blocking, load non-critical resources asynchronously and prevent long-running scripts.
  • Apply the right cache policies: Make sure each layer of the cache is configured correctly with proper caching strategy.

We hope our findings provide starting points for engineers to audit web performance and apply techniques outlined here to improve their site’s performance.

Acknowledgements

Special shoutout to Peter Ju for reviewing and helping us publish this article!

As software engineers, we sometimes get too focused on just writing code, and don’t explore the processes that help improve individual and team efficiency. Some process improvements take a long time, but there is a simple change that can make a big difference: Creating pull requests that are easy to review. 

In this article we’ll provide some best practices on how. We’ll first go into detail about how improving PRs can improve a team’s efficiency and outputs and then we’ll take a look at the best practices that have helped DoorDash improve our software development life cycle.  

Why bad PRs slow down the development cycle 

Bad PRs make it harder to collaborate, slowing down the development process. When a PR is hard to review, it gets fewer comments and disagreements, which leads to bugs and degraded code quality. Put together, these problems are ultimately much more costly than getting the code right the first time. Bugs create negative user experiences or slow time to market. Degraded code quality makes the codebase harder to build upon in the long term.

At the extreme, bad PRs can lead to “tick the box” style reviewing in which engineers approve without bothering to read the code. Negligent review defeats the purpose of creating a PR in the first place. Code developed without proper collaboration also inhibits the growth of junior developers, who need thoughtful feedback to learn. Having a robust review culture can help prevent skill stagnation. Here we outline several best practices to ensure that PRs are easy to review and serve their purpose to improve the development process. 

Stay Informed with Weekly Updates

Subscribe to our Engineering blog to get regular updates on all the coolest projects our team is working on

PR basics 

Make it easy for your reviewers by writing code that is:

  1. Easy to understand
  2. Well-structured and consistent with style guidelines
  3. Doing what it’s supposed to 
    1. Verifying correct behavior requires both checking test coverage and making sure that tests are passing for the right reasons

To help teams improve their reviewing culture, here are some guidelines to manage PR creation and feedback. We’ll dive into each of these best practices: .

  1. Write descriptive and consistent names
  2. Create a clear PR title and description 
  3. Keep PRs short (same applies to files and functions)
  4. Manage PR disagreements through direct communication
  5. Avoid rewrites by getting feedback early
  6. Request additional reviewers to create dialogue

Write descriptive and consistent names 

Variable and function naming is one of the biggest challenges in software engineering. 

Poor naming inevitably leads to bugs and increases the time an initial reviewer must devote to understanding the code. If poor naming passes code review, the problems with missed bugs and increased time requirements will multiply for every engineer who interacts with the code down the line. This is why it’s critical to choose good variable names at the start, saving time and preventing long-term headaches. 

We all have a sense of what good names and bad names are. It’s usually just a matter of investing the time to discuss and choose good names from the outset. 

Here are some examples: 

// Bad
val cid;
// Good
val consumerId;

// Bad
val distance;
// Good
val distance_meters;

Pay attention, too, to the larger context of how other things are named. This consideration too often is overlooked. Taken out of this larger context, names can become inconsistent or their meaning can become overloaded.

Here are some examples:

Inconsistent naming

// Bad
Service A {
    val doordash_id;
}
Service B {
    val a_id; // doordash_id from Service A
    val doordash_id; // doordash_id from Service B
}

// Good
Service A {
    val doordash_id;
}
Service B {
    val doordash_id; // doordash_id from Service A
}

Same name, different meaning

// Bad
fun function1() {
    val color_code; // means hex code
}
fun function2() {
    val color_code; // means the code column in the color table
}

// Better
fun function1() {
    val color_hex_code; // means hex code
}
fun function2() {
    val color_code_id; // means the code column in the color table
}

To avoid confusion, a variable’s name should be self-explanatory.

It’s essential to use descriptive and consistent naming for everything to avoid confusing the reviewer. This is one area where perfectionism pays off; even one instance of being lazy or tired can create confusion that leads to a bug or a frustrated reviewer.

Clear naming is crucial for the lifetime of the code. Once the code is merged, the variable/function names likely won’t change for a while. One poor naming choice can easily confuse more than 100 engineers over the course of a couple years, but once code is replicated and accepted, it can be difficult to change any names. 

Create a clear PR title and description

While many people think only about the code when they create a PR, context is essential for understanding and reviewing that PR. 

Reviewers must know what the fundamental problem is before they can understand if it’s been resolved. Don’t force a reviewer to read through 600 lines of code. Instead, provide a descriptive PR title and high-level summary at the top of the PR. 

This is why it’s good practice to create and enforce the use of PR templates, such as: 

  • Problem 
  • Solution 
  • Impact
  • Testing plan

Using a template gives reviewers context so they can give meaningful feedback without having to dig through docs or code. It can also help reviewers catch bugs. For example, if the description says the feature flag is always turned off, they can then look for the feature flag to confirm that.

When just starting out with PR templates, start with a really short template because being concise helps the reviewer, which leads to better results. This Axolo blog post includes a good example of a short template. 

Keep PRs short (same with files and functions) 

There is a vicious cycle that happens with long PRs. Long PRs yield long review times, and longer review times yield longer PRs because engineers try to get more code reviewed per PR, repeating the cycle.

It’s actually better to write short PRs. Although initial reviews may still be slow, review times will pick up speed because shorter PRs are easier to review.

It takes discipline to write short PRs. While you may intend to write a short PR, PRs lengthen after tests are written and edge cases are fixed. Sometimes they get longer, too, when code related to a previous PR is refactored in the current PR.

And even if you’re committed to short PRs, that begs the question: How long is too long? 

Some teams prefer to set numeric guidelines such as under 400 lines or under 10 files. Other teams prefer to break PRs down into logical units like event publisher, controller, or database layer rather than setting numeric guidelines. It’s most important to pick a method and decide how to enforce it; PRs won’t just magically get shorter because the team agrees they need to.

Why are shorter PRs better for development?

  • Shorter PRs lead to fewer bugs and more comments per line. It’s much easier to catch bugs in a shorter PR, while an extremely long PR is more likely to get a rubber-stamp “LGTM” (Looks Good To Me). 
  • Reviews are faster. Engineers can review a short 300-line PR during a gap between meetings. It can be harder to carve out the time needed to review a 600-line PR.

Manage PR disagreements through direct communication 

As a new grad engineer, it’s hard for me to know what to do when two senior engineers disagree about my PR. There also can be a long time between responses in the GitHub comment section. 

Instead of waiting for the back and forth, try initiating direct communication through Zoom or Slack as soon as the conversation starts. Update the GitHub comment afterward to close the loop on what was decided and why.

Why does direct communication help?

  • Feedback will be faster.
  • Verbal communication leads to fewer misunderstandings.
  • 10 minutes of verbal communication is a much more thorough review than a few back and forth GitHub comments.
  • Direct conversation prevents constant context switching between other work and checking the PR comment section.

Avoid rewrites by getting feedback early

As a new grad, I sometimes struggle with when I should ask for help. While some questions are better to answer through research or trial and error, there can be a heavy price to pay for going in the wrong direction for too long. Early feedback tends to be more useful. 

To decide whether it’s time to ask for help, try these steps:

  1. Figure out the urgency — if it’s urgent, ask for feedback right away.
  2. Before searching for a solution, make sure you’re asking the right question.
    1. It can be difficult to find the answer to a very specific question, but much easier to answer a broader version of that question.
    2. For example, a specific question might be: “What’s the plural of PR (pull request)?” But an answer may be more readily available for the general question: “How do plural acronyms work?”    
  3. Search Google, the codebase, internal documentation, and/or Slack
  4. Try rubber duck debugging (https://en.wikipedia.org/wiki/Rubber_duck_debugging)
    1. Although traditional “rubber duck debugging” involves talking out loud to an inanimate object, it can be even more helpful to write the problem down.
    2. Begin by summarizing the problem and what you’ve tried so far, including any potential solutions.
  5. Ask for help
    1. Tell people how long you’ve been stuck, what you’ve tried, and what you’re thinking.
    2. If it’s urgent, explain the urgency. If it’s a one-off request and not a pattern of behavior — and even if you should have asked earlier — people tend to be sympathetic to: “Hey, I’m sorry, I know I should’ve asked earlier, but I could really use your help because <reason>.” .

One way to get early feedback is to create a PR in “draft mode,” which prevents it from being merged. Developers usually don’t request review before their code is working, but creating a draft PR for a code skeleton or even slightly buggy code can help solicit helpful feedback.

Early feedback allows early course correction, which saves time re-writing features and tests if something is wrong. 

Request additional reviewers to create dialogue

Sometimes we want our code merged in quickly, so we seek an approval instead of a proper review and dialogue. However, shallow reviews defeat the purpose of code review.

One step that can help open up a dialogue is to request more reviewers. 

Why does requesting more reviewers help?

  • It adds more perspectives. If only one approval is required, and only one review requested, other teammates will never get a chance to disagree.
  • People are available at different times. Requesting more reviewers increases the likelihood that eyes get on the PR sooner.
  • If there’s a more general coding style/design disagreement in the PR, others have a chance to weigh in or at least become aware of it.
  • Standups are by nature more status updates than working in the weeds. When someone is requested on a PR, they can read exactly what a teammate is working on and can reference that code if they encounter a similar issue.

Conclusion

Writing easy-to-review PRs and maintaining a robust reviewing culture is key to good software engineering. PRs aren’t just for getting code approved; they’re meant to foster feedback and resolve disagreements.

Whether you’re an intern learning how the industry works or a senior engineer trying to set a good example for your team, creating clean PRs and managing feedback well will accelerate your process. Building this habit will pay off in the long run and ensure good practices are being followed even when times are busy. Your future self and future colleagues will thank you.

For complex systems such as the DoorDash assignment system, simulating the impact of algorithmic changes is often faster and less costly than experimenting on features live in production. However, building a simulator capable of capturing a complex system is a challenge in itself. Simulation feasibility should be assessed based on the predictability of the underlying dynamics that are being modeled. Considerations should be made about how simulator usage will be integrated into team development practices and the business impact should be evaluated with simulation as part of the development cycle. The technical design should focus on reusing existing infrastructure and minimizing simulation-specific behaviors in production systems. Finally, smart development and avoiding premature optimization can dramatically improve the ROI and time-to-business value when building a simulation platform.

When embarking on a simulation project, it’s important to keep in mind the following four steps that DoorDash took when we went about building ours. 

1) Assess simulation model feasibility 

Before embarking on a simulation project, it is important to consider whether it’s possible to accurately simulate the dynamics that are critical for the outcomes that need to be measured. Generally, the more deterministic a system is, the easier it will be to simulate. 

Simulation provides particular value where the aggregate behavior may be difficult to predict, but individual components of the system are reliably predictable. Physics is a great example of predictable behavior, where atomic level interactions are well described, but how they will propagate across a larger system is less predictable.

For DoorDash, we have invested heavily in understanding individual Dasher behaviors; Dashers is what we call our delivery drivers. We collect large amounts of data about the factors influencing Dasher acceptance, including historical acceptance behaviors, and route details, allowing us to build fairly accurate predictions about Dasher acceptance. However, translating these behaviors into aggregate market metrics requires understanding the complex interactions within our assignments system.

Highly chaotic or stochastic systems, which have a lot of randomness, such as financial markets or the weather, would be very difficult to simulate, since building predictive models can be very difficult. Evaluating the predictions and behaviors needed to model is an important first step before embarking on any simulation project. 

2) Understand, quantify, and evangelize the benefits of a simulator

Understanding and socializing the goals and benefits of building a simulator, such as minimizing damage to production experiences, accelerating product development, and exploring new product ideas is a critical first step when embarking on a project. 

Generating fewer bad production experiences

The primary benefit of a simulator we identified was to reduce the number of failed experiments, which were costly to run as they reduce the quality and efficiency of our deliveries. This reduction can be translated directly into business value by evaluating how often failed experiments launch, the impact these experiments have on business metrics and how many of these would have been avoided through the use of simulation. As such, the most important goal for this simulation is a sufficient level of accuracy to predict failed experiments. This may mean directional accuracy without high precision is important, or it may require more. Achieving this level of accuracy will likely require an iterative learning process whereby your first simulation is unlikely to work sufficiently well, similar to developing production models. 

Enabling a faster iteration speed

Simulation not only avoids failed experiments; it allows teams to iterate and learn from those failures faster. While harder to quantify, this impact on team velocity should be considered as one of the benefits of simulation. Simulation speed can also enable parameter sweeps to tune business performance across a broad range of potential settings.

Usability of simulation during development (e.g. minimal effort to configure and run a simulation) is an important factor in achieving this improved velocity, and it can be helpful to focus on usability to accelerate iteration speed and to attract early adopters who can help validate the accuracy and provide modeling insights. 

Wall clock time to run a simulation (e.g. the elapsed time from starting a simulation run to results being available) is also an important goal in ensuring that simulators increase velocity. Our simulation wall clock time target is to replicate a one-week experiment overnight (<12 hours). Simulation has the potential to run much faster than production experiments due to a variety of reasons. 

  • Time and space can be parallelized – multiple time periods can run concurrently.
  • Algorithms can run more frequently than they run in production. For example, if a system currently runs once per minute, but only requires 10 seconds to complete, it can be run at six times the speed.
  • Sampling can also accelerate the time it takes to evaluate a simulation while still providing accurate results.

However, there are limits to how much we can take advantage of each of these factors. Parallelization requires provisioning more compute resources and can lead to greater compute costs if utilization is not managed carefully and some systems do not scale out efficiently and / or gracefully.

We also cannot choose arbitrarily short periods to simulate. A set of ten-thousand, one-minute long simulations for a week of delivery assignments would likely not capture the interdependencies of assignments through system state. One example of system state would be the number of available Dashers. If a particular assignment system assigns Dashers earlier, there would be fewer Dashers available later. As such, a minimum duration is required to evaluate how a system will stabilize over longer periods. In production experiments, we handle these through ‘switchback’ experiments that persist a given treatment for a minimum duration (e.g. 1 hour) to see how the system state matures. Similarly, simulations require a minimum duration, which we are currently experimenting with to get the best estimates of experimental results.

Novel product changes

Simulation can also be valuable for changes that are difficult to experiment with. This includes experiments for which there isn’t enough statistical power, or experiments that involve changes to the environment (e.g. having 20% more orders). Generally, these simulations will be more challenging to build as they may be harder to validate, so it’s best to tackle nominal cases first, before simulating novel or unusual ones.

Deeply understanding and evangelizing how simulation will reduce failed experiments, increase development velocity, and enable broader exploration will ensure alignment across the organization and help focus development over the lifespan of the project.

Stay Informed with Weekly Updates

Subscribe to our Engineering blog to get regular updates on all the coolest projects our team is working on

3) Manage complexity through system design

Simulation is inherently complex and can quickly become unmanageable if not handled thoughtfully. Complexity can be managed through leveraging existing infrastructure and data formats and focusing on minimum viable models and use cases.

Leverage existing infrastructure 

Utilizing your existing infrastructure can help make simulation robust to future changes throughout the rest of the system and simplify the process of testing new experiments in simulation. Our simulation works directly with a replica of our production assignments system. New changes to our production code base can be tested by deploying to the simulation cluster *without any code changes*. This feature is beneficial for both end users and for simulation management, as the interaction between simulation and production codebases will mean significant ongoing maintenance. To achieve this separation, we cleaned up our production API down to a single call that encapsulates all state and information necessary to compute assignments.
By abstracting this interface, we are left with a system where we have our core assignments system being served through a single scalable microservice, as seen in Figure 1, with individual batch simulation jobs calling that service (orchestrated by Dagster).

Figure 1 - Simulation Services Architecture: 
Simulations are parallelized by Dagster while communicating 
with a scalable version of the Assignments Service
Figure 1 – Simulation Services Architecture: Simulations are parallelized by Dagster while communicating with a scalable version of the Assignments Service

Snapshot historical calls and responses

Collecting the necessary inputs for a production system during simulation can be challenging as these are often logged across multiple data storage systems / logs. These systems also may not capture slowly changing values that are updated over time. To avoid these issues, we also snapshot the data passed in all historical calls and received in responses. This approach also enables us to easily and cleanly test that our offline simulation system is matching production behaviors; simply pass in a historical call and compare it against the historical response. 

It is important to note that not all relevant experimental effects were contained within our assignments system. We experience feedback loops with supply incentives, eta estimates and other services. These loops are difficult to replicate in simulation, although it is likely a good starting point to assume historical behaviors, as collected in the snapshots.

Compare simulated treatment to simulated control

While comparing a simulation with historical metrics can be valuable for measuring and improving the accuracy of simulation, running two simulations (one for treatment and one for control) can help isolate experimental effects from simulation biases vs. historical data. This reduces the complexity by minimizing the importance of absolute accuracy and instead focusing on the effect of relative changes between treatment and control.

Simulation can be significantly easier to maintain and build by leveraging existing production code and creating and collecting data around clean abstraction interfaces. Simulation accuracy and interpretability can also be improved by always simulating both treatment and control to correct for absolute biases in simulation models.

4) Work smart by measuring progress and avoiding over-engineering 

With a complex and ambitious project, it’s easy to try to tackle too much at once and then get lost along the way. To avoid this, it’s important to set tangible intermediate milestones, work towards a minimum viable product to minimize over-engineering components that have limited impact, and engage your user base early to deliver business value and improve performance around critical use cases. 

Measure progress by validating functionality at each milestone

Many things need to work properly for a simulation to work well. Testing functionality through integration tests that are developed as functionality is built can ensure that the foundation is strong before building more complex components.

For example, in our assignments simulation project:

  • We first confirmed that we were able to replicate production assignments from historical snapshots.
  • Next, we validated our travel time and merchant wait models by confirming that our estimates had sufficient accuracy vs. historical observations.
  • We then performed a small simulation on a single geographic region, validating that our batching rates and acceptance rates were roughly accurate.
  • Finally, we were able to scale up to a sufficiently large sample of regions and start approximating production experiments.

Each of these stages served as excellent quarterly goals that the team could work towards and provide stakeholders quantitative measurements of progress towards building a functional simulator.

Build v0 models and evaluate before iterating

Unlike software APIs, which can have clear contracts on how they should behave, building mathematical models is rarely a binary task. Per statistician George Box, “All models are wrong, some are useful”. The challenge is to create imperfect models that sufficiently capture the desired behaviors for simulation.

However, despite past experience in developing models in this domain, there were still unknowns about what aspects of the model would be critical for simulation. As such, we biased towards simpler simulation models for travel time, wait time, idle Dasher movement and assignment acceptance, and we avoided investing time in tuning / improving these models beyond an initial v0 model until we were motivated by specific observed variances between simulated and historical data.

Figure 2- Functional Diagram of Simulation Loop: Simulator iteratively updates Dasher state and constructs calls to the Assignments Service API

One example of a simpler workable model is our idle Dasher movement model, as seen in Figure 2, which predicts where Dashers will go when they are not assigned tasks. For instance, some Dashers may prefer to stay at home waiting for orders, while others will position themselves closer to specific restaurants to maximize the likelihood they receive offers. The model is a geohash Markovian model, which computes transition probabilities between geohashes, and samples from these distributions during simulation. This model was preferred for simulation as it is very easy to train, custom per geographic region, and robust to a variety of environments.

By delaying investment in these models, we were able to learn / observe some important properties of these models. While production ML models often try to approximate causal effects (e.g. how much more likely is a Dasher to accept an order if it is one minute faster for them), this aspect becomes increasingly important in simulation as it is the primary driver of accurate experimental results. While we have not pursued techniques to improve causal estimation, this will likely become an important consideration as we improve simulation accuracy. We also observed that simulation is fairly insensitive to travel time quality as most of our experiments do not result in different travel times for a specific route. 

Partner with early adopters to prioritize investments with fastest returns

Finally, once a functioning simulator is built, finding early adopters and onboarding them to using simulation is critical to accelerate the simulation validation and model improvement process. We invested early in simplifying the simulation execution process and cleanly documenting how to run a simulation in a user’s guide that focused on steps necessary to run and only the minimal amount of general information about the simulation platform.

Breaking down a large project into smaller manageable chunks, incrementally validating efforts, avoiding unnecessary upfront investment in complex models or edge cases, and collaborating with early adopters can significantly improve velocity and reduce risk for a simulation project.

Case Study: Starting point optimization

DoorDash segments our geographic service area into ‘starting points’. Most deliveries within a starting point are dispatched using Dashers within that starting point. Starting points are important both for improving tractability of the Dasher to Delivery matching algorithm and for optimizing delivery quality and efficiency. However, since partitioning by starting points is built deeply into our production system, experimentation on starting point definitions can be challenging. 

Simulation provides a flexible and efficient way to test new starting point definitions. Given access to all orders and Dashers within a broader geographical area, we are able to re-partition these orders and Dashers per new starting point definitions. By testing a variety of potential configurations, we are able to determine the optimal definition of starting points and improve assignment efficiency and speed.

Go forth and simulate!

Simulation has the potential to turbocharge development by providing a platform for quickly testing and iterating on new ideas. Setting clear and achievable goals collaboratively with partner teams will ensure sufficient support for the project and will leverage the knowledge across the entire organization to shape the project. Simulation complexity can also be managed by utilizing existing production infrastructure, creating clear interfaces, storing production calls and responses, and focusing on experiment effects over absolute accuracy. Working incrementally with checkpoints and minimum viable use cases will help ensure projects stay on track and ensure it’s possible to focus efforts where they will have the most impact. Simulation combines both engineering and modeling challenges that can be larger in scope than the average project in either discipline, but with thoughtful goals and management, success can come from learning and understanding the business quickly and efficiently to unlock business opportunities otherwise impossible to uncover.

Acknowledgements

Simulation is the product of a large team of folks who have supported development both through technical and thought leadership. Thank you to Ben Fleischhacker, Sameer Saptarshi,Ryan Leung, Kaike Zhang,  Jianzhe Luo, Paul Brinich, Colin Schoppert, Paul Stepler-Camp, Cyrus Safaie and many others who have contributed!

Despite their widespread adoption, Kubernetes probes are rarely fully understood, which can cause unintentional outages if internal understanding of their functionality is insufficient. Even though deep technical understanding is often limited, there is broad familiarity across the industry with readiness, liveness, and startup probes for containers. Most of the industry is using these widely across their organizations.

The Kubernetes community did a particularly good job in marketing these probes; they exist in almost every open-source application running on K8S and any templates or samples found on the wild internet. As a result, these probes have been viewed as “health checks” and have been widely adopted without the majority of users having a good understanding of what they are actually doing under the hood.

DoorDash is no exception; with a robust adoption of K8S in the last one and a half years, we’ve incorporated these “health checks” into almost every single application of ours, without giving much thought to whether we needed those particular probes, and what the “health check” endpoint used in the application does under the hood. After a particularly bad outage on Black Friday, we learned that health checks could cause serious problems if not implemented correctly, which is why we decided to share our knowledge with the community in this post. First, we will talk about the outage in question and how things went wrong, and then we will share the actionable steps we took to prevent this kind of problem in the future. 

Our health checks outage on Black Friday

Because the DoorDash team lacked a deep technical understanding of the health checks we were running, we experienced an informative incident on Black Friday, a typically busy holiday for DoorDash. 

Closer to the end of the day, our engineers received various alerts that our Tier 0 service was experiencing issues. Specifically we saw: 

  • CPU utilization spiking
  • Increased response Latencies
  • SLOs were burning 
  • Reports were coming in from other services with failing dependencies

Our incident management tooling allowed us to quickly assemble the incident response team with relevant counterparts and start diagnosing triggers to mitigate the impact.

We were able to assemble an approximate diagnosis and the timelapse:

  • Large amounts of Pods were failing the readiness probes and were removed from the Kubernetes Service
  • The remaining Pods were quickly overwhelmed by being forced to handle a majority of the requests, skyrocketing CPU

To mitigate the initial impact, we disabled the readiness health checks on the Pods and service functionality was restored.

Understanding what failed

After the service was back to serving traffic normally, we had the opportunity to look into what exactly happened and what action items needed to be completed to avoid the problem in the future. Typically when dealing with an outage of this nature, it’s important to look at metrics, traces, and logs. In this section, we will outline our examination of each of these.

Looking at metrics to narrow down the search

Generally, the first place we look during an outage is our metrics. Metrics tend to provide the data on what is failing and in what amount, e.g.: a particular endpoint is returning 503 error codes and is doing so 90% of the time. For this particular outage, our metrics indicated only an overall increase in latency on all endpoints and the failing of a Kubernetes readiness check, which didn’t narrow it down to a particular failure. Given that the metrics were not providing much insight, the next step was to take a look at traces.

Using traces to track down individual application requests

After narrowing down the failure to a particular endpoint or determining that the metrics were not helpful, the next step is looking at the traces. Traces provide in-depth information on what functions were executed during a single request. In comparison, checking logs is often more difficult because they can be poorly formatted, and it can be very challenging to find issues without knowing exactly what to look for. 

To analyze our Black Friday incident further, we looked at our tracing data. What we found was that health check endpoints were excluded from the reporting tracing data. This meant that the tracing data was not going to help us find what caused the health check to fail and we would need to check the logs as the next logical step.

How we used logs to find what happened

Since we were not able to find the cause of the health check failures with metrics or tracing data, we needed to turn our attention to logs. From looking at the traces, we know that health check endpoints were also ignored from Application Logs, making them less useful in this case. However, we also had logs from our eBPF agent, a piece of software that runs adjacent to all our services and collects data on all TCP, UDP, and DNS requests performed by the service.

From these, we found a latency increase towards one of our Redis servers and a drop in request volume towards it when we disabled readiness checks. What was important, however, was that the latency increase on the given Redis server was on a legacy path to be removed and should not have impacted our application. Nevertheless, it turns out the health check endpoint/path used in our readiness check was a default health check provided by the Spring Boot Framework. The provided default health check endpoint performed various different configurable smaller health checks, enabled by default, one of them being Redis.

Testing our outage theory

After determining the hypothesized origin of the failure, the theory must be confirmed and then verified upon implementation of the solution. To test our theory, we used Chaos Engineering, which allows injection of failure into various aspects of a system in order to proactively find failures that can negatively impact the system. For this case, we have used Litmus Chaos, an open-source Chaos Engineering platform that enables the injection of various failures through targeted experiments. We configured an experiment called Pod Network Latency, which added a one-second latency to all calls to the Redis server, previously identified as a source of health check failures. One second was chosen because our readiness check timeout was also set to the same value. With the experiment enabled, we saw readiness checks starting to fail in a similar manner as during the outage.

Documenting action items

Once all the sources of failure have been found and confirmed, it’s important to create tickets and document all action Items to avoid similar problems in the future. In our case, we first worked on configuring the health endpoint provided by Spring Boot so that it only performed checks on relevant dependencies. Then we documented the findings and proactively reached out to every team/service using Spring Boot to help mitigate similar issues. Additionally, we have also started an initiative to document behaviors of various Kubernetes health checks and share this knowledge across the organization.

Common health check pitfalls

Based on our findings during this incident and further learnings, we wanted to share what we think are common pitfalls with Kubernetes health checks and actions we recommend to avoid them.

  • Lack of understanding of what different Kubernetes probes do
  • Use of 3rd party provided health check endpoints with no knowledge into what actions they perform
  • Disabled observability around aspects of health checks, including logs, traces, and metrics.

Lessons learned about Kubernetes probes

Throughout this project, our team identified gaps in our knowledge and procedures, and we determined measures to ensure our health checks are more effective and efficient. Here are our recommended steps to avoid similar issues:

1.       Understand the different applications of the various Kubernetes probes. Ensure the entire department is aware of these use cases.

2.       Verify the applications and options regarding any third-party health check endpoints. Consider disabling certain features on third-party tools.

3.       Treat health check endpoints as Tier 0 by instrumenting them with various observability methods and ensuring they are not ignored by the observability tooling. If health checks are providing too much data, consider sampling them or reducing the volume of data they share.

4.       Having a health-checks depend on a backend dependency can be problematic, as an outage within your dependency can cause you to have an outage as Kubernetes restarts your containers.

At DoorDash, real time events are an important data source to gain insight into our business but building a system capable of handling billions of real time events is challenging. Events are generated from our services and user devices and need to be processed and transported to different destinations to help us make data-driven decisions on the platform. To name a few use cases:

  • Almost all events need to be transported to our OLAP data warehouse for business analysis. For example, the Dasher assignment team (Dasher is our name for delivery drivers) relies on assignment data in the data warehouse to detect any bugs in their assignment algorithm.
  • Some events will be further processed by downstream systems. For example, delivery events are processed by our ML platform to generate real time features like recent average wait times for restaurants. 
  • Some mobile events will be integrated with our time series metric backend for monitoring and alerting so that teams can quickly identify issues in the latest mobile application releases. For example, any checkout page load errors from our DoorDash consumer application need to be sent to Chronosphere for monitoring.

How our legacy system worked 

Historically, DoorDash has had a few data pipelines that get data from our legacy monolithic web application and ingest the data into Snowflake, our main data warehouse. Each pipeline is built differently, can only process one kind of event, and involves multiple hops before the data finally gets into the data warehouse. An example is shown as Figure 1:

Legacy data pipeline at DoorDash
Figure 1: Legacy data pipeline at DoorDash

There are several problems with this approach:

  • It is cost inefficient to build multiple pipelines that are trying to achieve similar purposes.
  • Mixing different kinds of data transport and going through multiple messaging/queueing systems without carefully designed observability around it leads to difficulties in operations. 

These resulted in high data latency, significant cost, and operational overhead. 

Stay Informed with Weekly Updates

Subscribe to our Engineering blog to get regular updates on all the coolest projects our team is working on

Introducing Iguazu our event processing system 

Two years ago, we started the journey of creating a real time event processing system named Iguazu to replace the legacy data pipelines and address the following event processing needs we anticipated as the data volume grows with the business:

  • Heterogeneous data sources and destinations: Data ingest from a variety of data sources including the legacy monolithic web application, microservices and mobile/web devices, and delivery to different destinations including third-party data services. Reliable and low latency data ingest into the data warehouse is a high priority.
  • Easily accessible: A platform that makes it easy for different teams and services to tap into the streams of the data and build their own data processing logic.
  • End-to-end schema enforcement and schema evolution: Schema only improves data quality, but also facilitates easy integration with data warehouses and SQL processing.
  • Scalable, fault-tolerant, and easy to operate for a small team: We want to build a system that can easily scale to the business need with minimal operational overhead.

To meet those objectives, we decided to shift the strategy from heavily relying on AWS and third-party data services to leveraging open source frameworks that can be customized and better integrated with DoorDash’s infrastructure. Stream processing platforms like Apache Kafka and Apache Flink have matured in the past few years and become easy to adopt. These are excellent building blocks we can leverage to build something ourselves.

In the past two years, we built the real time events processing system and scaled it to process hundreds of billions of events per day with a 99.99% delivery rate. The overall architecture of the system is depicted in Figure 2 below. In the following sections, we are going to discuss in detail the design of the system and how we solved some major technical challenges:

  • Simplifying event publishing with unified API and event format to avoid bottlenecks in adoptions
  • Providing multiple abstractions for consuming the events for different kinds of data consumers
  • Automating the onboarding process using Github automations and workflows in an Infrastructure As Code environment
 the overall system architecture of Iguazu DoorDash's event processing platform
Figure 2:  Shows the overall system architecture of Iguazu 

Simplify and optimize event producing

The first step to building a processing system was choosing the best technology and approach to processing the events. We choose Apache Kafka as our pub/sub system for streaming data because Kafka has proved to be an excellent solution to unify heterogeneous data sources while providing high throughput and high performance.

Leveraging and enhancing Kafka Rest Proxy

We want every DoorDash service to be able to easily produce events to Kafka. An obvious choice is to create a Kafka client and integrate it with all services. However, this approach has a few disadvantages:

  • It will be a burden for every service to configure Kafka connections, which is likely to have issues for teams that are not familiar with Kafka and slow down the adoption
  • It will be difficult to have uniform and optimized Kafka producer configuration across different services
  • A direct connection to Kafka is infeasible for mobile and web applications

Therefore, we decided to leverage Confluent’s open source Kafka Rest Proxy for event producing. The proxy provides us a central place where we can enhance and optimize event producing functionalities without having to coordinate with client applications. It provides abstractions over Kafka with HTTP interface, eliminating the need to configure Kafka connections and making event publishing much easier. The record batching, which is critical to reduce broker’s CPU utilization, is also significantly improved due to the capability of batching across different client instances and applications.

The Kafka rest proxy provides all the basic features we need out of the box, including:

  • Supporting different kinds of payload formats, including JSON and binaries
  • Supporting batch, which is crucial to reduce processing overhead for both client applications and Kafka brokers
  • Integration with Confluent’s schema registry makes it possible to validate and convert the JSON payload with schema

On top of that, we customized the rest proxy to our needs and added the following features:

  • The capability to produce multiple Kafka clusters. The ability to produce multiple clusters is critical to us as our events quickly expanded to multiple Kafka clusters and the event-to-cluster mapping is an important abstraction we have in our system.
  • Asynchronous Kafka producing requests. Having asynchronous production  eliminates the need to first get brokers’ acknowledgment before responding to the client’s requests. Instead, the response is sent back immediately after the payload is validated and added to the Kafka producer’s buffer. This feature greatly reduces the response time, and improves the batching and system’s overall availability. While this option may lead to minor data losses when Kafka is unavailable, the risk is offset by proxy side producer retries and close monitoring of acknowledgments received from brokers.
  • Pre-fetching Kafka topic metadata and producing test Kafka records as part of the Kubernetes pod readiness probe. This enhancement will ensure that the proxy pod will warm up all the caches and Kafka connections to avoid cold start problems.
  • Supporting Kafka header as part of the proxy produce request payload. Our event payload format relies on the event envelope which is part of the Kafka header in the produce record. We will cover more on our event payload format and serialization in later sections.

Optimizing producer configuration

While Kafka’s default configurations work well for systems requiring high consistency, it is not most efficient for non-transactional event publishing and processing where throughput and availability are important. Therefore, we fine-tuned our Kafka topic and proxy producer’s configurations to achieve high efficiency and throughput:

  • We use a replication factor of two with one minimal in-sync replica. Compared to the typical configuration of three replicas, this saves the disk space and reduces the broker’s CPU utilization on replication, while still providing adequate data redundancy. 
  • The producer is configured to receive acknowledgment from the broker as soon as the leader of the partition, not the followers, has persisted the data. This configuration reduces the response time of the produce request.
  • We leverage Kafka’s sticky partitioner by setting a reasonable linger time between 50ms to 100ms, which significantly improves batching and reduces broker’s CPU utilization.

Altogether, this tuning has reduced the Kafka broker CPU utilization by 30 to 40%.

Running Rest Proxy in Kubernetes

The Kafka rest proxy turns out to be easy to build and deploy in our own Kubernetes infrastructure. It is built and deployed as an internal service and leverages all the CI/CD processes offered by DoorDash’s infrastructure. Kubernetes horizontal pod autoscaling is enabled on the service based on CPU utilization. This significantly reduces our operational overhead and saves cost.

Figure 3: Shows Kubernetes horizontal pod autoscaling taking effect for Kafka Rest Proxy

Now that we described simplified and efficient event producing, let’s focus on what we have done to facilitate event consuming in the next section.

Event processing with different abstractions 

As mentioned in the beginning, one important objective for Iguazu is to create a platform for easy data processing. Flink’s layered API architecture fits perfectly with this objective. Data Stream API and Flink SQL are the two main abstractions we support. 

We chose Apache Flink also because of its low latency processing, native support of processing based on event time, fault tolerance, and out-of-the-box integration with a wide range of sources and sinks, including Kafka, Reddis (through a third-party OSS), ElasticSearch, and S3.

Deployment with Helm in Kubernetes

Our platform provides a base Flink docker image with all the necessary configurations that are well integrated with the rest of DoorDash Kubernetes infrastructure. Flink’s high availability setup and Flink metrics are available out of the box. For better failure isolation and the ability to scale independently, each Flink job is deployed in standalone mode, as a separate Kubernetes service. 

When developing the Flink application using data stream APIs, engineers will start by cloning a Flink application template and then add their own code. The application and Flink job’s configuration – like parallelism and task manager count – will be defined in a terraform template. In the build process, a docker image will be created with the combined application jar file and our internal Flink base docker image. The deployment process will take both the terraform template and the application docker image and deploy the application in a standalone Flink job cluster in our K8s cluster from a generated Helm Chart. The process is illustrated in the following diagram:

The Flink application build and deployment process using terraform and Helm
Figure 4: The Flink application build and deployment process using terraform and Helm

Providing SQL Abstraction

While Flink’s data stream API is not difficult to understand for backend engineers, it still presents a major hurdle to data analysts and other casual data users. For those users, we provide a platform to create Flink applications declaratively using SQL without having to worry about infrastructure-level details. The details of the work are available in this blog.

When developing a SQL based application, all the necessary processing logic and wiring are captured in a YAML file which is simple enough for everyone to read or author. The YAML file captures a lot of high-level abstractions, for example, connecting to Kafka source and output to different sinks. Here is an example of such YAML file:

sources:
  - name: canary_store_order_count
    type: REALTIME
    compute_spec:
      type: RIVIERA
      riviera_spec:
        kafka_sources:
          - cluster: default
            topic: store_timeline_events
            proto_class: "com.doordash.timeline_events.StoreTimelineEvent"

        sql: >-
          SELECT
            store_id as st,
            SUM(CAST(has_store_order_confirmed_data AS INT)) as
                saf_st_p20mi_order_count_sum_canary
          FROM store_timeline_events
          GROUP BY HOP(_time, INTERVAL '20' SECONDS, 
                       INTERVAL '20' MINUTES), 
                   store_id
        resource_config:
          number_task_manager: 2
          memory: "1Gi"
          cpu: "2400m"

features:
  - name: canary_store_order_count
    source: canary_store_order_count
    materialize_spec:
      sink:
        - prod_canary_features
      feature_ttl: 1200
    metadata_spec:
      description: Store Order Sum over 20 minute

To create the Flink job, the user only needs to create a PR with the YAML file. Upon the merge of the PR, a CD pipeline will be kicked off and compile the YAML file into a Flink application and deploy it. 

In the above two sections, we covered events producing and consuming in Iguazu. However, without a unified event format, it’s still difficult for producers and consumers to understand each other. In the next section, we will discuss the event format which serves as a protocol between producers and consumers.

Event format, serialization, and schema validation

From the very beginning, we defined a unified format for events produced and processed in Iguazu. The unified event format greatly reduced the barrier in consuming events and reduced the frictions between event producers and consumers.

All events have a standard envelope and payload. The envelope contains context of the event (creation time and source, for example), metadata (including encoding method) and references to schema. The payload contains the actual content of the event. The envelope also includes non-schematized event properties as a JSON blob. This JSON section in the envelope helps to make parts of the event schema flexible where the changes do not involve a formal schema evolution process. 

Event payload produced from internal microservices will be schema validated and encoded. Invalid payloads will be dropped directly at the producer side. For events produced from mobile/web devices, they are in raw JSON format and we use a separate stream processing application to do schema validation and transformation to the schematized format for downstream processes to consume. 

We created serialization/deserialization libraries for both event producers and consumers to interact with this standard event format. In Kafka, the event envelope is stored as a Kafka record header and the payload is stored as the record value. For event consumers, our library will decode the Kafka header and value and recreate the event for the consumer to process.

the deserialization from Kafka record to Event and how the concept of Event is represented in storage (Kafka) vs. application runtime
Figure 5: Shows deserialization from Kafka record to Event and how the concept of Event is represented in storage (Kafka) vs. application runtime

Almost all of our microservices are based on GRPC and Protobuf. All events are defined by Protobuf in a centrally shared Protobuf Git repository. At the API level, our definition of an Event is a wrapper around a Protobuf message to make it easy for our microservices to use. However, for most of the final destinations of the event, the Avro format is still better supported than Protobuf. For those use cases, our serialization library takes the responsibility of seamlessly converting the Protobuf message to Avro format, thanks to Avro’s protobuf library, and converting back to the Protobuf message when needed. 

We heavily leveraged Confluent’s schema registry for generic data processing. All events are registered with the schema registry. With the recent Protobuf schema support introduced in the Confluent schema registry, we achieved the ability of generic data processing with both Protobuf and Avro schema. 

One challenge we faced in the beginning is how we can enforce and automate the schema registration. We do not want to register the schema at the runtime when the events are produced because:

  1.  It would dramatically increase the schema update requests at a certain time, causing scalability issues for the schema registry. 
  2. Any incompatible schema change would cause schema update failures and runtime errors from the client application.

Instead, it would be ideal to register and update the schema at build time to reduce the update API call volume and have a chance to catch incompatible schema changes early in the cycle. 

The solution we created is to integrate the schema registry update as part of the CI/CD process for our centralized Protobuf Git repository. When a Protobuf definition is updated in the pull request, the CI process will validate the change with the schema registry. If it is an incompatible change, the CI process would fail. After the CI passes and the pull request is merged, the CD process will actually register/update the schema with the schema registry. The CI/CD automation not only eliminates the overhead of manual schema registration, but also guarantees: 

  • Detection of incompatible schema changes at build time, and 
  • The consistency between released Protobuf class binaries and the schemas in the schema registry. 

In the above sections, we discussed event producing, consuming, and their binding through the unified event format in Iguazu. In the next section, we will describe Iguazu’s integration with its most important data destination – the data warehouse – in a low latency and fault-tolerant fashion.

Data Warehouse Integration

As mentioned at the beginning of the article, data warehouse integration is one of the key goals of Iguazu. Snowflake is still our main data warehouse solution. We expect events to be delivered to Snowflake with strong consistency and low latency.

The data warehouse integration is implemented as a two-step process. 

In the first stage, data is consumed by a Flink application from Kafka and uploaded to S3 in the Parquet file format. This step helps to decouple the ingest process from Snowflake itself so any Snowflake related failures will not impact the stream processing and the data can be backfilled from S3, given Kafka’s limited retention. In addition, having the Parquet files on S3 enables data lake solutions, which we explored later with our in-house Trino installation.

The implementation of uploading data to S3 is done through Flink’s StreamingFileSink. When completing an upload for a Parquet file as part of Flink’s checkpoint, StreamingFileSink guarantees strong consistency and exactly-once delivery. StreamingFileSink also allows customized bucketing on S3, which we leveraged to partition the data at the S3 directory level. This optimization greatly reduced the data loading time for downstream batch processors. 

At the second stage, data is copied from S3 to Snowflake via Snowpipe. Triggered by SQS messages, Snowpipe enables loading data from S3 files as soon as they’re available. Snowpipe also allows simple data transformation during the copying process. Given its declarative nature, it is a great alternative compared to doing that in stream processing. 

One important note is that each event has its own stream processing application for S3 upload and its own Snowpipe. As a result, we can scale pipelines for each event individually and isolate failures.

So far we covered how data flows from end to end from clients to the data warehouse. In the next section, we will discuss the operational aspect of Iguazu and see how we are making it self-serve to reduce the operational burdens.

Working towards a self-serve platform

As mentioned above, to achieve failure isolation, each event in Iguazu has its own pipeline from Flink job to Snowpipe. However, this requires more infrastructure setup and makes the operation a challenge.

At the beginning, onboarding a new event into Iguazu is a support-heavy task. DoorDash heavily relies on the Infrastructure-As-Code principle and most of the resource creation, from Kafka topic to service configurations, involves pull requests to different terraform repositories. This makes automation and creating a high level abstraction a challenging task. See the diagram below for the steps involved in onboarding a new event.

 Automations in place that orchestrate complicated steps to create a pipeline from services to Snowflake
Figure 6: Automations in place that orchestrate complicated steps to create a pipeline from services to Snowflake

To solve this issue, we worked with our infrastructure team to set up the right pull-approval process and automate the pull requests using Git automation. Essentially a Github App is created where we can programmatically create and merge pull requests from one of our services which acts as a controller. We also leveraged the Cadence workflow engine and implemented the process as a reliable workflow. This whole automation reduced the event onboarding time from days to minutes.

To make it one step closer to being self-servable, we created UIs using the Retool framework for users to explore schema and onboard an event from there. Users can search for a schema using regex, pick the right schema for the event, start the workflow to create necessary resources and services, and have the opportunity to customize the Snowflake table and Snowpipe. 

Our ultimate goal of Iguazu is to make it a self-serve platform, where users can onboard an event by themselves with the right abstraction and minimal support or human intervention.

Shows the schema exploration UI where the users can drill down to subjects and versions.
Figure 7: Shows the schema exploration UI where the users can drill down to subjects and versions.

Shows UI to view/customize the Snowflake table schema and Snowpipe
Figure 8: Shows UI to view/customize the Snowflake table schema and Snowpipe

Learnings and Future Work

We found it important to create the event processing system with a platform mindset. Ad-hoc solutions where different technologies are piled on each other is not only inefficient but also difficult to scale and operate.  

Picking the right framework and creating the right building blocks is crucial to ensure success. Apache Kafka, Apache Flink, Confluent Rest Proxy and Schema registry proves to be both scalable and reliable. Researching and leveraging the sweet spots of those frameworks dramatically reduced the time needed to develop and operate this large scale event processing system. 

To make the system user friendly and easy to adopt requires the right abstractions. From the declarative SQL approach, seamless serialization of events, to the high level user onboarding UI, we strive to make it an easy process so that our users can focus on their own business logic, not our implementation details.

There is still a lot we want to achieve with Iguazu. We have already started a journey of building a Customer Data Platform on top of Iguazu where we can easily transform and analyze user data in a self-serve manner. Sessionization is an important use case we want to address. In order to be able to sessionize a huge amount of data, we started to enhance our support of Flink stateful processing by leveraging Kubernetes StatefulSet, persisted volumes and exploring new ways of deployment using Spinnaker. Better integration with data lake is another direction we are heading into. Together with SQL abstraction and the right table format, direct data lake access from stream processing applications enables backfill and replay using the same application and provides another alternative to Lambda architecture

Stay tuned and join us on this adventure.

Acknowledgements

Applauses to team members who directly contributed to Iguazu over the past two years: Ahmed Abdul-Hamid, Chen Yang, Eleanore Jin, Ijesh Giri, Kunal Shah, Min Tu, Mohan Pandiyan, Nikhil Patil, Parul Bharadwaj, Satya Boora, Varun Narayanan Chakravarthy.

Thanks also go to team members who closely collaborated with us: Adam Rogal, Akshat Nair, Attila Haluska, Carlos Herrera, Dima Goliy, Gergely Nemeth, Hien Luu, James Bell, Jason Lai, Karthik Katooru, Kenny Kaye, Matan Amir, Nick Fahrenkrog, Roger Zeng, Sudhir Tonse, Wuang Qin.

In the process of migrating from a python monolith to a service-oriented architecture using gRPC microservices in Kotlin, DoorDash Engineering had the opportunity to better define patterns for how we implement gRPC endpoints.

In a previous blog post, we discussed functional programming patterns in Kotlin and how they helped our team write cleaner and more effective code. In this post, we will expand on those ideas to show how we write gRPC endpoints using the functional-core, imperative-shell pattern. Combined with Kotlin’s structured concurrency features, we can avoid many of the common difficulties of I/O handling, allowing us to focus on business logic.

In particular, our approach allows us to implement APIs which call many external services in parallel without creating an unmaintainable mess of callbacks or futures. By using the functional-core, imperative-shell pattern, we can write most of our gRPC endpoints in pure functional programming style by separating business logic from network I/O.

To illustrate these patterns, we’ll walk through the code for a gRPC endpoint that calls three services using the functional-core, imperative-shell pattern. Then we’ll build on that example to show how to use structured concurrency to make requests in parallel and lazy-load data.

For the sake of simplicity, this blog post only covers read-only APIs, but you can extend these patterns for write APIs as well.

Summary

In this blog post we will:

  • Introduce the functional-core, imperative-shell pattern
  • Use that pattern to write a gRPC endpoint that calls three downstream services
  • Use structured concurrency to make service calls in parallel and lazy-load data

Introducing the functional-core, imperative-shell pattern

One of the key ideas of functional programming is to use pure functions. A function is pure if, given the same input, it always returns the same output and has no side effects. Network requests aren’t pure functions because the result depends on something other than the input – for example, there might be a different result based on network errors. Additionally, network requests can cause side effects such as writing to a database.

We want to write code in a functional programming style because it makes it easier to avoid bugs, but our gRPC service needs to make many network requests, and those aren’t pure functions. How do we use functional programming while still doing network I/O?

Our solution is to use the functional-core, imperative-shell pattern. The basic idea of the pattern is to put all of our I/O in one place (the imperative shell), cleanly separating it from the rest of our program (the functional core). The shell fetches data and returns a DataModel that holds the result of each network request. Then we can write our business logic as a pure function that takes the DataModel as input and returns the response. The benefit of this pattern is that by separating the I/O, our business logic can be implemented using functional programming.

There are a number of excellent blog posts and videos around the web which explain the pattern in more detail. In this blog post, I’ll demonstrate how we use the pattern in practice and how we leverage Kotlin’s structured concurrency features to make our implementation easier.

Stay Informed with Weekly Updates

Subscribe to our Engineering blog to get regular updates on all the coolest projects our team is working on

The difference between business logic and I/O

One of the key advantages of this pattern is that it keeps business logic separate from I/O logic.

Business logic includes:

  • Deciding which pieces of data are needed
  • Transforming the data into a response
  • Returning different responses depending on what networking errors happened
  • If this is a write-API, deciding what data to write

Network I/O logic includes:

  • Making RPC calls to fetch data
  • Building an object to describe what happened as a result of the network request (either the response or error)
  • Configuring retries and timeouts
  • Logic to make multiple RPC requests in parallel

By isolating the two we can write business logic in a functional programming style while still robustly handling network errors.

Anatomy of a gRPC method

Next, let’s walk through the code for an example gRPC method. At a high-level, our gRPC method fetches the data model and then transforms it into a response. Conceptually, we think of it as a composition of two functions:

getResponse( getDataModel( request ) ) -> response

In the context of the functional-core, imperative-shell pattern, getDataModel is the imperative shell which performs I/O, and getResponse is the functional core which looks at the results of that I/O and returns the response. Next, let’s look at a practical example of how to implement each of these methods.

Code example: fetching data for a delivery

As a concrete example, let’s write a gRPC method that fetches some information about a delivery. This method takes a delivery ID and returns the name of the customer and Dasher, our name for a delivery driver. It will make three service calls:

  • getDelivery – looks up a delivery by delivery ID, returns the dasher ID and customer ID
  • getCustomer – looks up a customer by customer ID
  • getDasher – looks up a dasher by dasher ID

Defining the API contract using Protobuf

Given the above requirements, we can write a protobuf specifying the request and response format:

service ExampleService {
  rpc GetDeliverySummary(GetDeliverySummaryRequest) returns (GetDeliverySummaryResponse);
}

message GetDeliverySummaryRequest {
  google.protobuf.StringValue delivery_uuid = 1;
}

message GetDeliverySummaryResponse {
  google.protobuf.StringValue delivery_uuid = 1;
  google.protobuf.StringValue customer_name = 2;
  google.protobuf.StringValue dasher_name = 3;
}

Defining a code skeleton

To implement our API, we define four methods and a data model class.

public suspend fun getDeliverySummary(request: GetDeliverySummaryRequest): GetDeliverySummaryResponse {
    try {
        validateRequest(request)
        val dataModel = getDataModel(request)

        return getResponse(dataModel)
    } catch (e: Throwable) {
        throw getErrorStatus(e).asException()
    }
}

The data model describes what happened during IO – it holds the response or error for each RPC call. Our business logic takes those responses or errors and decides what to do with them. We encapsulate all I/O in the getDataModel function – the rest are pure functions that handle the business logic.

Next, let’s take a look at the empty signatures of each method so that we can get a better idea of how everything fits together before we implement each method. We need to define four methods plus one model class:

1. Validate the request

/** Validate a request, for example checking that all required fields are present
 *  and in the expected format.
 *  
 *  Throws an InvalidRequestException if the request is invalid.
 */
fun validateRequest(request: GetDeliverySummaryRequest) {

}

2. Get the data model

/** Fetches the data needed for this RPC method. All I/O happens in this method. */
suspend fun getDataModel(request: GetDeliverySummaryRequest): DataModel {

}

3. Convert the data model to a response

/** Converts the DataModel into the grpc response.
 *
 * Throws an exception if the DataModel is missing required data. */
fun getResponse(dataModel: DataModel): GetDeliverySummaryResponse {

}

4. Handle errors

/** Converts an exception into the appropriate gRPC response status. */
fun getErrorStatus(e: Throwable): Status {

}

5. Define the DataModel class

/** Holds the responses (or errors) from any network requests that this RPC method makes. */
data class DataModel()

Initial implementation of our API

Next, we’ll go over the initial implementation of each method.

For the sake of simplicity, we don’t use Kotlin’s structured concurrency features in this initial example. Later we will expand the example to show how to use structured concurrency to make all our downstream RPC requests in parallel.

The DataModel class

The data model describes what happened during I/O. Specifically, it holds the response or error for each network request.

This allows us to separate the description of how to fetch data from the business logic of how to handle errors. For example, we may want to return an error response if some required data fails to load, but fall back on some default value if optional data fails to load.

We use Kotlin’s Result<T> class to hold the response or error.

/** Holds the response (or error) from any network requests that this RPC method makes. */
data class DataModel(
    val delivery: Result<DeliveryResponse>,
    val customer: Result<CustomerResponse>,
    val dasher: Result<DasherResponse>
)

Validating the request

The code for request validation ensures that the request contains a valid delivery uuid.

/** Throws an InvalidRequestException if the request is invalid. */
fun validateRequest(request: GetDeliverySummaryRequest) {
    if (!request.hasDeliveryUuid() || request.deliveryUuid.value.isEmpty()) {
        throw InvalidRequestException("delivery_uuid is required")
    }
}

Getting the data model

Now for our I/O code. We get the delivery, using the customerId and dasherId from the response to get the customer and Dasher. Even if our service calls result in errors, getDataModel won’t throw an exception because we’re using the Result.runCatching and Result.mapCatching functions to catch any exceptions and wrap them in a Response object.

The getDataModel function is in charge of making service calls but not filtering or transforming those responses – that counts as business logic and we want to keep business logic out of getDataModel. So even though we only need the name field from the Dasher, the data model holds the entire Dasher RPC response.

/** Fetches the data needed for this RPC method. All I/O happens in this method. */
suspend fun getDataModel(request: GetDeliverySummaryRequest): DataModel {
    val delivery = Result.runCatching {
        DeliveryService.getDelivery(request.deliveryUuid.value)
    }

    val customer = delivery.mapCatching {
        if (!it.hasCustomerId()) {
            throw IllegalStateException("Delivery does not have a customer id")
        }

        CustomerService.getCustomer(it.customerId.value)
    }

    val dasher = delivery.mapCatching {
        if (!it.hasDasherId()) {
            throw IllegalStateException("Delivery does not have a dasher id")
        }

        DasherService.getDasher(it.dasherId.value)
    }

    return DataModel(
        delivery = delivery,
        customer = customer,
        dasher = dasher
    )
}

Converting the data model to a response

Now that we’ve handled I/O, the business logic for transforming the data model into a response is straightforward. Since all of the data is required, we’re using Result.getOrThrow to throw an exception for failed RPC requests.


/** Converts the DataModel into the grpc response.
 *
 * Throws an exception if the DataModel is missing required data. */
fun getResponse(dataModel: DataModel): GetDeliverySummaryResponse {
    val response = GetDeliverySummaryResponse.newBuilder()

    response.deliveryUuid = dataModel.delivery.getOrThrow().deliveryUuid
    response.customerName = dataModel.customer.getOrThrow().name
    response.dasherName = dataModel.dasher.getOrThrow().name

    return response.build()
}

One might ask why we need a separate Result<> object for each DataModel field. If we’re just throwing an exception every time there’s an error result, why not have a single Result<DataModel> object instead of multiple Result<> fields?

For this simple example, separate Result<> fields aren’t necessary since each RPC response is required. But what happens if the product requirements change and we want to fail gracefully by making the dasherName field optional? With a single Result<DataModel>, we’d have to refactor the DataModel, getDataModel and getResponse methods.

But with separate Result<> fields for each RPC call, we only need to change one line:

fun getResponse(dataModel: DataModel): GetDeliverySummaryResponse {
    val response = GetDeliverySummaryResponse.newBuilder()

    response.deliveryUuid = dataModel.delivery.getOrThrow().deliveryUuid
    response.customerName = dataModel.customer.getOrThrow().name
    response.dasherName = dataModel.dasher.getOrNull()?.map { it.name }

    return response.build()
}

The key here is that deciding how to handle different errors is business logic. By keeping that business logic in the getResponse method, we can implement new product requirements with minimal code changes.

Mapping exceptions to the appropriate gRPC response

Our RPC method can throw exceptions in two places – validateRequest and getResponse. The getErrorStatus method returns the appropriate gRPC response code depending on the exception.

Note that in order for this to work well, we need to be sure to define custom exception classes for each of our RPC calls.

/** Converts an exception into the appropriate gRPC response status. */
fun getErrorStatus(e: Throwable): Status {
    return when(e) {
        is DeliveryNotFoundException -> {
            Status.NOT_FOUND.withDescription("Delivery not found").withCause(e)
        }
        is CustomerNotFoundException -> {
            Status.NOT_FOUND.withDescription("Customer not found").withCause(e)
        }
        is DasherNotFoundException -> {
            Status.NOT_FOUND.withDescription("Dasher not found").withCause(e)
        }
        is GetDeliveryException -> {
            Status.INTERNAL.withDescription("Error getting delivery").withCause(e)
        }
        is GetCustomerException -> {
            Status.INTERNAL.withDescription("Error getting customer").withCause(e)
        }
        is GetDasherException -> {
            Status.INTERNAL.withDescription("Error getting dasher").withCause(e)
        }
        is InvalidRequestException -> {
            Status.INVALID_ARGUMENT.withDescription(e.message).withCause(e)
        }
        else -> {
            Status.INTERNAL
                .withDescription("Error: ${e.message}")
                .withCause(e)
        }
    }
}

Using structured concurrency to improve our gRPC method

Now, let’s walk through how we can improve our initial example using structured concurrency. One of Kotlin’s key features is support for coroutines, which are similar to lightweight threads. Structured concurrency is a technique of arranging coroutines using a parent/child relationship. This gives us the benefit of asynchronous I/O without the readability problems of futures and callbacks.

To showcase when to use structured concurrency, let’s extend the initial example with some additional requirements:

  1. Fetch data in parallel to reduce latency
  2. Don’t fetch the Dasher for pickup orders

Requirement 1: Fetching data in parallel

Fetching data in parallel decreases latency but it complicates the code, especially for RPCs that call many services. For example, you might need the result of one service call to make another service call, but those calls depend on other calls as well. How can we control which RPC calls to make in parallel without our code becoming a mess?

Structured concurrency makes this easy. We use supervisorScope, async() and await() to make requests in parallel using coroutines. We don’t need to worry about what order to make requests in – just chain together coroutines and Kotlin will make requests in parallel when possible.

In this blog post, we want to focus on practical examples of how we use structured concurrency as opposed to a general introduction to the concept. If you’re not familiar with coroutines, supervisorScope, async() or await(), there are some great guides that cover the topic. For the sake of brevity, I’ll defer to those guides to introduce these topics.
First, we make a slight tweak to the DataModel so that each field is a Deferred<Result<T>> instead of just Result<T>.

/** Holds the response (or error) from any network requests that this RPC method makes. */
data class DataModel(
    val delivery: Deferred<Result<DeliveryResponse>>,
    val customer: Deferred<Result<CustomerResponse>>,
    val dasher: Deferred<Result<DasherResponse>>
)

Now we can modify getDataModel to chain together coroutines:

/** Fetches the data needed for this RPC method. All I/O happens in this method. */
suspend fun getDataModel(request: GetDeliverySummaryRequest): DataModel {
    return supervisorScope {
        val delivery = async {
            Result.runCatching {
                DeliveryService.getDelivery(request.deliveryUuid.value)
            }
        }

        val customer = async {
            delivery.awaitResult().mapCatching {
                if (!it.hasCustomerId()) {
                    throw IllegalStateException("Delivery does not have a customer id")
                }

                CustomerService.getCustomer(it.customerId.value)
            }
        }

        val dasher = async {
            delivery.awaitResult().mapCatching {
                if (!it.hasDasherId()) {
                    throw IllegalStateException("Delivery does not have a dasher id")
                }

                DasherService.getDasher(it.dasherId.value)
            }
        }

        DataModel(
            delivery = delivery,
            customer = customer,
            dasher = dasher
        )
    }
}

/**
 * Convenience function to await a Deferred<Result>.
 * If the call to await() throws an error, it wraps the error as a failed Result.
 */
suspend fun <T> Deferred<Result<T>>.awaitResult(): Result<T> {
    return try {
        this.await()
    } catch (e: Throwable) {
        Result.failure(e)
    }
}

Requirement 2: Don’t fetch the Dasher for pickup orders

Where should we add the logic to not fetch the Dasher for pickup orders? It’s tempting to put it in the getDataModel function, but that’s not quite right. The decision of whether or not to use data from the Dasher is business logic. How can we keep this business logic out of the getDataModel function?

The answer is to use lazy evaluation, only making network calls at the point where we try to read the result from the DataModel. Instead of starting our coroutines immediately, we mark them as lazy. That way Kotlin won’t execute the coroutines until you call .await() on the Deferred. If we move the calls to .await() to the getResponse function, then we won’t make any network calls unless our business logic uses the data.

One caveat is that coroutineScope won’t exit until all coroutines have been completed, but with lazy loading some coroutines might never be started so our app will hang indefinitely. The solution is to cancel any unused coroutines after calling getResponse.

Here’s the code:

public suspend fun getDeliverySummary(request: GetDeliverySummaryRequest): GetDeliverySummaryResponse {
    try {
        validateRequest(request)

        return supervisorScope {
            try {
                // All network calls happen here
                val dataModel = getDataModel(request)

                // All business logic and transformation of data happens here
                getResponse(dataModel)
            } finally {
                // If any of the lazy coroutines are not started or completed, cancel them
                // Without this, the supervisorScope will never exit if one of the coroutines was never started.
                this.coroutineContext.cancelChildren()
            }
        }
    } catch (e: Throwable) {
        throw getErrorStatus(e).asException()
    }
}

/** Fetches the data needed for this RPC method. All I/O happens in this method. */
suspend fun getDataModel(request: GetDeliverySummaryRequest, coroutineScope: CoroutineScope): DataModel {
    return coroutineScope.run {
        val delivery = async(start = CoroutineStart.LAZY) {
            Result.runCatching {
                DeliveryService.getDelivery(request.deliveryUuid.value)
            }
        }

        val customer = async(start = CoroutineStart.LAZY) {
            delivery.awaitResult().mapCatching {
                if (!it.hasCustomerId()) {
                    throw IllegalStateException("Delivery does not have a customer id")
                }

                CustomerService.getCustomer(it.customerId.value)
            }
        }

        val dasher = async(start = CoroutineStart.LAZY) {
            delivery.awaitResult().mapCatching {
                if (!it.hasDasherId()) {
                    throw IllegalStateException("Delivery does not have a dasher id")
                }

                DasherService.getDasher(it.dasherId.value)
            }
        }

        DataModel(
            delivery = delivery,
            customer = customer,
            dasher = dasher
        )
    }
}

/** Converts the DataModel into the grpc response.
 *
 * Throws an exception if the DataModel is missing required data. */
suspend fun getResponse(dataModel: DataModel): GetDeliverySummaryResponse {
    val response = GetDeliverySummaryResponse.newBuilder()

    // Calculate each response field as a separate coroutine.
    // Since we're using lazy evaluation in the DataModel, data isn't fetched until we call awaitResult() here.
    // Calculating each response field as a separate coroutine ensures that we fetch data with maximum concurrency.
    // If we were to await() each Deferred serially, the requests would be triggered serially instead of in parallel.
    coroutineScope {
        launch {
            response.deliveryUuid = dataModel.delivery.awaitResult().getOrThrow().deliveryUuid
        }

        launch {
            if (!dataModel.deliveryResponse.awaitResult().getOrThrow().isPickupOrder()) {
                response.dasherName = dataModel.dasher.awaitResult().getOrThrow().name
            }
        }

        launch {
            response.customerName = dataModel.customer.awaitResult().getOrThrow().name
        }
    }

    return response.build()
}

Conclusion

By separating business logic from I/O, it’s easy to quickly understand what an RPC method is doing. The DataModel will tell us what services our RPC method calls. The assessors of each data model property show us how the data is used.

We’re also able to perform I/O efficiently, parallelizing requests while taking advantage of lazy loading to avoid unnecessary network calls. By adopting the functional-core, imperative-shell pattern and using Kotlin’s structured concurrency features, you can write gRPC methods that are efficient, error-free, and easy to modify in response to changing product requirements.

SwiftUI is Apple’s new UI building framework released in 2019 as part of the iOS13 update. Compared to the old UIKit, SwiftUI is a declarative, functional framework, allowing developers to build user interfaces much faster, while offering a very useful toolkit to debug and test the result through interactive previews and built-in support from Xcode.

DoorDash’s journey with SwiftUI required figuring out how to programmatically scroll ScrollViews starting with iOS13 to pave the way for more complicated functionalities down the road, including such things as adding snapping-to-content behavior.

ScrollViews are common in any modern UI. They are part of many different use cases and user interfaces, allowing users to experience much more content than would normally fit on a mobile device’s screen or in the given viewport of a web browser.

ScrollViews, as shown in Figure 1, are tightly integrated into our designs to allow us to focus the users’ attention on a particular item. We can use them to highlight position or progress, align content with the viewport, and enforce snapping behavior among myriad other benefits.

Figure 1: The ScrollView is the area below the fixed height view on a mobile app and can, via scrolling,  provide access to more content than would otherwise fit on the page. 

With our new SwiftUI app, we sought to add many of these features to our app experience. Unfortunately, the first release of SwiftUI in 2019, bundled with iOS13, lacked any means to programmatically move ScrollViews, which could only be accomplished following the next release for iOS14 a year later.

Building programmatic scrolling

We first will explore the scrollview implementation options before diving into how to implement the programmatic scrolling behavior.

Programmatic scrolling and its benefits

Programmatic scrolling refers to the possibility of instructing the ScrollView to move to a particular position (referred to as content offset) or to a target view.

Programmatic scrolling was introduced in the first version of iOS (iPhoneOS 2.0) within UIKit. There are publicly available APIs to accomplish it: all UIScrollViews and their subclasses come with the methods setContentOffset(:animated:) and scrollRectToVisible(:animated:).

Because of this UIKit legacy, there are countless user experiences already in production offering programmatic scrolling; it has been a core feature for many user flows. As a result, it was only natural to require any new UI framework to enable the same UX.

To review a few examples, our UX design specifies scenarios where a ScrollView is positioned around some of its subviews, such as scrolling to incomplete sections on a form before the user can submit it:

Figure 2. This form scrolls to the first incomplete section 
before letting the user save their options

Similarly, when two elements’ scroll positions are linked and scroll together, such as a main list and a horizontal carousel:

Stay Informed with Weekly Updates

Subscribe to our Engineering blog to get regular updates on all the coolest projects our team is working on

Figure 3. The horizontal carousel on the top and the main scroll offset of the menu 
are linked: scrolling the main menu updates the carousel and tapping
 any of the labels on the carousel scrolls the main menu.

SwiftUI 1.0 ScrollViews lacked any kind of support for accomplishing programmatic scrolling in general: there weren’t any APIs that would allow someone to instruct the ScrollView to move itself to a particular position. 

Without out-of-the-box-support, it seemed most expedient to keep the implementation based on UIKit and not take on the extra challenge of using SwiftUI. However, DoorDash’s philosophy has been to investigate new possibilities to move toward our end goal and try to bridge any gaps we encounter along the way. This project was no exception.

Before we show the detailed steps of our investigation, we would like to note that SwiftUI 2.0 shipped with added programmatic support for iOS14, including Apple’s introduction of a ScrollViewReader and a ScrollViewProxy

The ScrollView reader is a transparent container that exposes a proxy argument to its content. The content’s code blocks can use this proxy to send messages to the ScrollView to move its offset to a particular position.

However, ScrollViewReader and its proxy are not backward-compatible with iOS13/SwiftUI 1.0.

This improvement nonetheless gave us inspiration for our own API design, including how the end result should look and which syntax feels most natural when building our user interface with SwiftUI.

Building programmatic ScrollViews with SwiftUI

To build something like this on our own required the following steps:

  1. Exposing a reference to the underlying UIKit UIScrollView. This reference enables us to use the UIKit APIs to programmatically scroll the content.
  2. Building SwiftUI-based components that make use of the above reference so that  developers can use these to instruct the ScrollView to scroll.
  3. Wrapping the solution in a convenient and easy-to-understand API to hide its complexity.

For reference, here is a quick code example using Apple’s solution. This is an example of a simple view declaration demonstrating the use of a ScrollViewReader. The reader’s content itself is given a parameter of the type ScrollViewProxy, which exposes the API to scroll the ScrollView to any designated child view using its assigned identifier:

import SwiftUI

struct ContentView: View {
    enum ScrollPosition: Hashable {
        case image(index: Int)
    }
    
    var body: some View {
        ScrollView {
            ScrollViewReader { proxy in
                VStack {
                    ForEach(0..<10, content: logoImage)
                    
                    Button {
                        withAnimation {
                            proxy.scrollTo(
                                ScrollPosition.image(index: 0),
                                anchor: .top
                            )
                        }
                    } label: {
                        Text("Scroll to top!")
                    }
                    .buttonStyle(.redButton)
                }
            }
        }
    }
    
    func logoImage(at index: Int) -> some View {
        Image("brand-logo")
            .resizable()
            .aspectRatio(contentMode: .fit)
            .padding()
            .border(Color.red.opacity(0.5))
            .padding()
            .id(ScrollPosition.image(index: index))
    }
}

We wanted to ensure developers could use a familiar syntax, thus it became our goal to mimic this construction.

Building the components for programmatic scrolling

To implement any kind of custom programmatic API, we had to instruct the UI framework to do what we wanted it to do.

Behind the scenes, SwiftUI components use the old UIKit views as building blocks; in particular ScrollViews are using an underlying UIScrollView. If we could safely walk through the UIKit view hierarchy that SwiftUI automatically generated for us to find this component, we could use the old UIKit methods to perform the programmatic scrolling and accomplish our original goal. Assuming we can accomplish this, this should be our path forward.

Sidenote: There are third-party libraries that claim to hook into UIScrollView, but in our experience they do not work reliably across different versions of SwiftUI. That’s why we implemented our own means to locate this reference.

To find a particular superview — in our case the containing ScrollView — in the UIKit view tree, we need to insert a transparent view which does not actually display anything to the user, but rather is used to investigate the view hierarchy. To this end, we need a UIViewRepresentable and a UIView instance as its view type.

A short note for the sake of bikeshedding about type names in this example: We call the replacement for Apple’s ScrollViewReaderScrollReader’ and for ScrollViewProxy we use a protocol called ScrollProxyProtocol and the type of the object we use to implement it as __ScrollProxy.

struct ScrollViewBackgroundReader: UIViewRepresentable {

    let setProxy: (ScrollProxyProtocol) -> ()
    
    func makeCoordinator() -> Coordinator {
        let coordinator = Coordinator()
        setProxy(coordinator)
        return coordinator
    }

    func makeUIView(context: Context) -> UIView {
        UIView()
    }
    
    func updateUIView(_ uiView: UIView, context: Context) { }
}

Going forward, the Coordinator we added as part of this UIViewRepresentable will be doing the heavy lifting for us, including implementing the necessary steps to programmatically scroll the UIScrollView. We pass a closure from the ScrollReader to the background view, so the __ScrollProxy implementation can delegate requests to the Coordinator. You can see its implementation below.

We can add this reader view as a background to the content of our own ScrollReader:

struct ScrollReader<ScrollViewContent: View>: View {
    private let content: (ScrollProxyProtocol) -> Content
    private let proxy = __ScrollProxy()

    init(@ViewBuilder content: @escaping (ScrollProxyProtocol) -> ScrollViewContent) {
        self.content = content
    }
    
    var body: some View {
        content(proxy)
            .background(
                ScrollViewBackgroundReader(setProxy: { proxy.other = $0 })
            )
    }
}

Throughout this example, we use the .background() modifier to add our reader views. This allows us to add them as part of the view hierarchy. Furthermore, .background() components share the geometry (position and size) of the receiver, which makes it useful to find the coordinates of various views later on when we need to translate the content’s position to CGPoint coordinates.

Next, we define our ScrollProxyProtocol:

protocol ScrollProxyProtocol {
    /// Scrolls to a child view with the specified identifier.
    ///
    /// - Parameter identifier: The unique scroll identifier of the child view.
    /// - Parameter anchor: The unit point anchor to describe which edge of the child view
    /// should be snap to.
    func scroll(to identifier: AnyHashable, anchor: UnitPoint)
    /// Scrolls to a child view with the specified identifier and adjusted by the offset position.
    ///
    /// - Parameter identifier: The unique scroll identifier of the child view.
    /// - Parameter anchor: The unit point anchor to describe which edge of the child view
    /// should be snap to.
    /// - Parameter offset: Extra offset on top of the identified view's position.
    func scroll(to identifier: AnyHashable, anchor: UnitPoint, offset: CGPoint)
}

We shall implement this protocol above with the proxy object (i.e. the __ScrollProxy private type) and separately with the Coordinator of the reader. In this design, the proxy object will delegate the scroll requests to the Coordinator behind the scenes. The Coordinator’s reference is passed to the proxy object using the setProxy(_:) closure used above.

struct ScrollReader: View {
    ...
    private final class __ScrollProxy: ScrollProxyProtocol {
        var other: ScrollProxyProtocol? // This is set to the Coordinator's instance
                
        func scroll(to identifier: AnyHashable, anchor: UnitPoint) {
            other?.scroll(to: identifier, anchor: anchor)
        }
        
        func scroll(to identifier: AnyHashable, anchor: UnitPoint, offset: CGPoint) {
            other?.scroll(to: identifier, anchor: anchor, offset: offset)
        }
    }
}

Our Coordinator’s implementation of the proxy protocol will look like this code sample below — with TODO placeholders for now:

final class Coordinator: MyScrollViewProxy {
    ...
                
    private func locateTargetOffset(with identifier: AnyHashable, anchor: UnitPoint) -> (view: UIView, offset: CGPoint)? { 
        // TODO: locate target views with the given identifier
    }
        
    // MARK: ScrollProxyProtocol implementation
        
    func scroll(to identifier: AnyHashable, anchor: UnitPoint) {
        // TODO: locate the view with the identifier, scroll its parent scrollview to the view’s position
    }
                
    func scroll(to identifier: AnyHashable, anchor: UnitPoint, offset: CGPoint) {
        // TODO: locate the view with the identifier, scroll its parent scrollview to the view’s position
    }
...

As a next step, we need to locate the target content offset based on the view identifier and the UnitPoint anchor before locating the correct UIScrollView instance.

These two tasks are related; once we have found the correct destination view, we can find the first of its parents, which is also a UIScrollView. To simplify this step, we have added a computed property on UIView:

extension UIView {
    var enclosingScrollView: UIScrollView? {
         sequence(first: self, next: { $0.superview })
            .first(where: { $0 is UIScrollView }) as? UIScrollView
    }
}

But we still need to identify and locate the target view. In their own solution, Apple is using the SwiftUI .id() API to uniquely identify views. This mechanism is used in their programmatic scrolling solution as well.

We cannot use the results of this API because it is private and hidden from us. What we can do is implement something similar.

Annotating target views

Here we use the .background() modifier again to annotate potential scroll-to targets with a unique identifier while using the background reader view above to locate views with these unique identifiers. To do so, we need to complete the following tasks:

  • Add a SwiftUI API to annotate views
  • Add a lookup mechanism to find these views later when we need to scroll programmatically
  • Convert the placements of these views to CGPoint content offset coordinates

For the first step, we need to place one more UIViewRepresentable in the view hierarchy using the .background() modifier:

struct ScrollAnchorView: UIViewRepresentable {
    let id: AnyHashable
    
    func makeUIView(context: Context) -> ScrollAnchorBackgroundView {
        let view = ScrollAnchorBackgroundView()
        view.id = id
        return view
    }
    
    func updateUIView(_ uiView: ScrollAnchorBackgroundView, context: Context) { }
    
    final class ScrollAnchorBackgroundView: UIView {
        var id: AnyHashable!
    }
}

We then add a convenience method to use the above:

extension View {
    /// Marks the given view as a potential scroll-to target for programmatic scrolling.
    ///
    /// - Parameter id: An arbitrary unique identifier. Use this id in the scrollview reader's proxy
    /// methods to scroll to this view.
    func scrollAnchor(_ id: AnyHashable) -> some View {
        background(ScrollAnchorView(id: id))
    }
}

We made sure the UIViewRepresentable view and its UIView share the same unique ID because the ID’s value is specified in the SwiftUI domain. We will, however, need to locate the UIView with the same ID in the UIKit hierarchy.

We can use the following methods to locate the unique UIView in the view hierarchy with the given identifier using a recursive lookup:

extension UIView {   
    func scrollAnchorView(with id: AnyHashable) -> UIView? {
        for subview in subviews {
            if let anchor = subview.asAnchor(with: id) ?? subview.scrollAnchorView(with: id) {
                return anchor
            }
        }
        return nil
    }

    private func asAnchor(with identifier: AnyHashable) -> UIView? {
        guard let anchor = self as? ScrollAnchorView.ScrollAnchorBackgroundView, anchor.id == identifier else {
            return nil
        }
        return anchor
    }
}

We can use these methods in our Coordinator’s locateTargetOffset function. Immediately afterward, we can locate the parent UIScrollView instance as well:

func locateTargetOffset(with identifier: AnyHashable, anchor: UnitPoint) -> (view: UIView, offset: CGPoint)? {
    guard let targetView = backgroundReaderView.window?.scrollAnchorView(with: identifier) else { return nil }
    guard let scrollView = targetView.enclosingScrollView else { return nil }
    self.scrollView = scrollView
    return (targetView, scrollView.convert(targetView.frame, from: targetView.superview).point(at: anchor, within: scrollView.bounds))
}

This method is called from the ScrollProxyProtocol implementation within our Coordinator:

func scroll(to identifier: AnyHashable, anchor: UnitPoint) {
    guard let target = locateTargetOffset(with: identifier, anchor: anchor) else { return 
    scrollView?.setContentOffset(target.offset, animated: true)
}
                
func scroll(to identifier: AnyHashable, anchor: UnitPoint, offset: CGPoint) {
    guard let target = locateTargetOffset(with: identifier, anchor: anchor) else { return }
    scrollView?.setContentOffset(target.offset + offset, animated: true)
}

We have overloaded the + operator to add two CGPoints to simplify the syntax in the last step.
The following code snippet is used to convert the UIViews’ bounds and the UnitPoint anchors into content offset coordinates:

extension CGRect {
    func point(at anchor: UnitPoint, within container: CGRect) -> CGPoint {
        CGPoint(
            x: minX + anchor.x * (width - container.width),
            y: minY + anchor.y * (height - container.height)
        )
    }
}

At this point, we have completed everything for the first iteration of a programmatically scrollable solution:

  • Added a SwiftUI API for our ScrollReader, which in turn is used to publish the proxy object to allow programmatic scrolling
  • Located the target view and its parent ScrollView and converted the positioning of the view to the input parameters that the UIScrollView APIs expect
  • Connected the proxy object with the Coordinator’s concrete implementation

You can find the solution as a Swift project here.

Wrapping up programmatic scrolling

The construction outlined above lets us replicate the behavior of the SwiftUI ScrollViewReader without iOS or SwiftUI version restrictions. Because we have full access to the underlying UIScrollView, we can use this solution to add extra bits of functionality beyond this initial result, something we will explore in subsequent posts.

But even this initial result has an extra bit of functionality: It allows scrolling to a view at an anchor with a local offset applied for more fine-grained control to position our ScrollView.

Now we can replicate the very first example with our own solution:

struct MyContentView: View {
    enum ScrollPosition: Hashable {
        case image(index: Int)
    }
    
    var body: some View {
        ScrollView {
            ScrollReader { proxy in
                VStack {
                    ForEach(0..<10, content: logoImage)
                    
                    // as before - scrolling to an image
                    Button {
                        withAnimation {
                            proxy.scroll(to: ScrollPosition.image(index: 0), anchor: .top)
                        }
                    } label: {
                        Text("Scroll to the first image!") 
                    }
                    
                }
                .buttonStyle(.redButton)
            }
        }
    }
    
    func logoImage(at index: Int) -> some View {
        Image("brand-logo")
            .resizable()
            .aspectRatio(contentMode: .fit)
            .padding()
            .border(Color.red.opacity(0.5))
            .padding()
            .scrollAnchor(ScrollPosition.image(index: index))
    }
}

Note that we have replaced the .id() in the logoImage function with our own .scrollAnchor() modifier.

And it works as expected:

Figure 4. Scrolling programmatically using our own solution. The first button tap scrolls to the origin coordinate of the first logo image, the second tap scrolls the content 50 points above the top position of the content.

The shortcoming of this iteration is the lack of support for SwiftUI animations. There is no easy way to translate SwiftUI Animation specifications using the UIKit scroll APIs. We will explore a solution to this problem in a later post.

Conclusion

Building programmatic scrolling in SwiftUI required several iterations to achieve success as we moved through our SwiftUI learning curve. In this current form, however, it is now relatively easy to implement and can be used for simple use cases across the board and even for production features.

But this version is still not the final result. We have managed to take our solution further, adding support for SwiftUI animations, scroll snapping behavior for pagination, and other fine-grained content snapping behavior, and support for adjusting the deceleration rate.

Overall, these steps improved the SwiftUI ScrollView to allow us to use it for production features while paving the way for our migration to rewrite our consumer app using the SwiftUI framework without compromises.

In even more complex use cases, we have implemented a collaboration between our modal bottom sheet component and a ScrollView as its content, translating ScrollView drag gestures into gestures that instead move the sheet itself when appropriate.

One more obvious choice of improvement is fine-turning animation support in this solution. In SwiftUI animations can be specified in a very intuitive and straightforward way, and are more powerful than the choices offered in UIKit: the latter is especially true in the case of UIScrollView APIs where we can only pick if we want animation or not at all.

In subsequent posts, we will explain adding support for snapping behavior and deceleration rate, as well as how to change this iteration to enable SwiftUI animations. We’ll revisit this problem in a later post.

As our business has been growing rapidly over the years, showcasing relevant content in the form of banners and carousels on high-traffic surfaces like the home page has become harder to support reliably. There has been an exponential increase in load on multiple systems such as application pods, databases, and caches, which is expensive to support and maintain. Before diving deeper into the details, let’s define some of the content such as banners and carousels.

Banners – These are discovery units represented by a creative with some content that could appear on any page within the app. Examples of banners in the app are shown in Figure 1 and Figure 2. They are usually used to merchandise stores/businesses/deals or to inform consumers about an event. We typically show multiple of them as a horizontally scrollable unit. Each of them could be clickable and lead to a carousel, specific store, webpage, etc.

Figure 1: Banner showcasing an M&M deal
Figure 2: Informational banner on store page indicating this store is a top-rated store

Carousels – These are discovery units that could appear on any page within the app. They are usually used to group stores into a common theme/category so that consumers are able to discover content in a more organized way. The stores inside these units are horizontally scrollable. On clicking the gray arrow, a broader selection of the stores belonging to this theme is shown. Examples of carousels in the app are shown in Figure 3 and Figure 4.

Figure 3: Multiple carousels shown on the home page. Some of them are manually  curated or rule-based or are auto-generated based on machine learning algorithms  
Figure 3: Multiple carousels shown on the home page. Some of them are manually curated or rule-based or are auto-generated based on machine learning algorithms  
Figure 4: Viewing more options for a carousel

The challenge of fetching relevant content at scale

The challenge we faced was that too many discovery units had to be fetched in real-time which could be relevant for a consumer address’ deliverable radius. This scaling challenge was causing a huge toll on the availability and reliability of carousels. 

Figure 5: Illustrates a high-level fan-out issue. Since campaigns are created and stored at a per-store level, to ensure high recall, we fetch campaigns for all stores which results in a fan-out from Campaign Service to Cassandra

When using DoorDash the user experience starts the second you open the consumer app. On our backend systems, a lot starts happening immediately. One of the first things that happens is the set of stores (includes restaurants, grocery stores, pet stores, and so on) that are in the consumer address’ deliverable radius are fetched from search service which has business logic to determine what stores are relevant for customers given the logistical and geographical constraints. The number of stores available in a dense location like LA or NYC could easily reach thousands compared to hundreds in suburban areas.

Once relevant context like store data, consumer data, geographical information (like lat/long, city, district), etc. is calculated, a call is made from the Discovery system to the Campaign system to get a list of carousels and banners eligible, available, and relevant for the context that was passed along.

The Discovery system is responsible for content gathering, grouping and ranking of different entities for a given surface such as the home page.

The Campaign system internally tries to fetch campaigns for each store in the context to maximize recall.

How our Campaign system works

Our banner and carousel system relies on campaign objects, which are containers that hold configuration rules such as: 

  • what to show
  • who to show to
  • when to show 
  • how to show

These objects are configured at the store/business or a higher-order geographical level such as city, district, country, etc. Here, an example of a store could be the Safeway at 303 2nd St in San Francisco. A business is a bigger entity than a store that could have a list of stores belonging to it; for example, McDonalds could have 10,000+ stores.

The campaign system gives DoorDash strategy operators a very powerful way to be able to control the discovery surface content. Today we have banners and carousels that are manually curated, machine learning curated, and rule-based curated. All of them can be highly targeted to a set of users, shown during certain times of the day, have discounts associated with them, capped on how often they could show during a given time period, displayed at different start and end dates, and so on.

A single campaign could be targeting thousands of stores and each store in turn could have its own specific targeting, for example, a consumer needs to be new to the store to be eligible for the campaign.

Below is a demonstration of a simple campaign configuration that targets a store with store id = 999 to show a banner on the store page, and has specific start dates and end dates that it should show, and is only visible on the DoorDash app.

{
  "campaign": {
    "limitations": [
      {
        "type": "LIMITATION_TYPE_IS_ACTIVE",
        "is_active": {
          "value": true
        },
        "value": "is_active"
      },
      {
        "type": "LIMITATION_TYPE_EXPERIENCE",
        "experiences": {
          "experience": [
            "DOORDASH"
          ]
        },
        "value": "experiences"
      },
      {
        "type": "LIMITATION_TYPE_ACTIVE_DATES",
        "active_dates": {
          "start_time": {
            "seconds": "1613635200",
            "nanos": 0
          },
          "end_time": {
            "seconds": "1672559940",
            "nanos": 0
          }
        },
        "value": "active_dates"
      }
    ],
    "placements": [
      {
        "limitations": [
          {
            "type": "LIMITATION_TYPE_IS_ACTIVE",
            "is_active": {
              "value": true
            },
            "value": "is_active"
          }
        ],
        "type": "PLACEMENT_TYPE_STORE_PAGE_BANNER",
        "content_id": {
          "value": "most-loved-2022-store"
        },
        "sort_order": {
          "value": 5
        },
        "experiment_name": {
          "value": "testMostLoved2022"
        }
      }
    ],
    "memberships": [
      {
        "ids": [
          "9999999"
        ],
        "limitations": [],
        "user_criteria": [],
        "type": "MEMBERSHIP_ENTITY_TYPE_STORE"
      }
    ],
    "user_criteria": [],
    "id": {
      "value": "35145320-69bc-45cd-bb89-fc721b94a21d"
    },
    "name": {
      "value": "Campaign - BNY - Most Loved (Feb 2021)"
    },
    "description": {
      "value": "Most Loved tile - February refresh"
    },
    "created_by": "[email protected]",
    "created_at": {
      "seconds": "1613690199",
      "nanos": 0
    }
  }
}

Explaining the fan-out problem

For dense locations like Los Angeles, a single request would fan out to thousands of calls to our internal systems. During peak traffic, we would easily reach millions of queries per second to our database systems. This volume is particularly bad because it puts a lot of load on all our microservice systems involved such as BFFs, service apps, and database systems. We had to massively horizontally scale all of our systems to meet this demand. As the number of stores and campaigns are increasing at a rapid pace to highlight content, it becomes harder to support everything at such a scale.

Our approach to tame the Fan out problem

So to summarize, there was a massive fan-out problem that kept growing and we were not sure how to proceed with it. We came up with a few solutions that we attempted to try to tame this problem.

Batching

The most obvious attempt to reduce the load on the application server sides was to batch the calls. We started experimenting with batching the calls to send X stores simultaneously, instead of all at once

After doing some performance testing, we empirically derived the optimal 

batch size that worked for us. However, we soon started seeing that even this approach was ultimately not able to support our ever-growing expansion, selection, and discovery content. We could theoretically horizontally scale all our systems to support this, however that had its own challenges and we felt that was not the best use of our resources, nor was it sustainable in the longer term.

The four factors that did not allow us to support this in the long run can be summarized by this fan-out formula: 

T * V * S * C (Traffic * Verticals * Stores * Campaigns)

  • Traffic – Expansion into more geographical areas: this means more incoming traffic to our systems
  • Verticals – Expansion into new verticals apart from restaurants, such as grocery, convenience, pet supply, etc
  • Stores – Onboarding of more stores into the DoorDash system
  • Campaigns – Explosion in the number of campaigns to merchandise stores

Researching geographical based grouping

Going back to the original problem, we were able to alleviate the load on application pods, but still had a load on our database systems. We had to research how to alleviate the load on our database systems.

As we began thinking more about this problem, one thing became clear to us: we need to reduce the cardinality of this fan-out. We needed a way to not request so many stores at a time but also not reduce the selection of stores; a way to group these stores which reduced this fan-out while fetching. Grouping stores by their geographical location made the most sense specifically in dense areas where you have lots of stores packed in a small area and then choose the best campaigns in those areas.

We looked into multiple existing solutions that would help us achieve this in a consistent, reliant, and scalable way. We looked at systems such as S2, Geohash, and H3 

We did some testing, and based on empirical evidence, we chose H3 over other libraries. Here we outline some of the reasons that we thought H3 was a better fit.

H3 is Open source

H3 is an open-source project and is maintained by an active community with a wide list of high traffic production use cases. It is used by other technology companies, libraries like geojson2H3, and applications like kepler.gl.

High Availability and reliability

The API is simple, fast, and available in the languages DoorDash uses most frequently.

Relevance to DoorDash use case

H3 uses a hexagonal system which makes it easier to roughly approximate it to a circle which is closer to what DoorDash uses for calculating delivery radii. We compared the APIs and tested circle filling between S2 and H3 in our use cases. We found that H3 fits our use cases better and both S2 and H3 performed similarly in computational complexities. We would need to make geometric approximation work on top of geohash while H3 and S2 are both mature out of the box full solutions with good performance.

How we used H3 for our fan out solution

We could use the H3 library to visualize the world into different hexagons. There are different resolutions 1-15 that allow us to geographically condense stores into a large entity.

This solution allowed us to organize geo’s by hex’s instead of stores or what we were using before. We could now call hexes instead of individual stores and fetch the best campaigns for each hex thereby reducing cardinality. 

Then the question arose: what size hexagon should we use? We wanted to run some benchmark tests to see what the best fit was for our situation. We did real-time analysis for proof of concept and were able to reduce the fan-out by a factor of 500x for non-dense areas and roughly 200x for dense areas. 

We found that we reached the empirical optimal balance between computational complexity and approximation effectiveness at H3 resolution level of 9.

Once we finalized on using geo-hashes as our geographical filter for campaigns, we started looking at other ways of optimizing our fetching. Formerly we were fetching all campaigns and doing in-memory eligibility/filtering. This meant that the amount of data we fetched online was large. 

We saw room for optimization if we could reduce the amount of data fetched by filtering closer to the storage layer. Essentially we wanted to move from “fetch all and filter in-memory” to “fetch filtered data”. This optimization was challenging to do with our existing non-relational database Cassandra which is great for fast lookups but not filtering on multiple keys. 

Using Elasticsearch to filter data retrieval 

Based on existing technologies at DoorDash, to optimize for filtering at data retrieval layer, we chose to go with Elasticsearch as this seemed a good fit for filtering at a data retrieval layer at high scale. This index contained campaign data which was denormalized in a way for efficient filtering and retrieval based on request context such as the geohash, start/end date, time of day and so on. 

Why Elasticsearch

Elasticsearch is a search engine based on the Lucene library. It provides a distributed, multitenant-capable efficient data retrieval system. We selected it for the following reasons: 

Needle in a haystack

Elasticsearch was great for needle-in-a-haystack queries where we would want to filter out and retrieve a smaller amount of campaigns compared to the total data-set. We calculated that we could reduce fetching for ~50% of campaigns if we could filter them at the data-retrieval layer.

Boosting/Ranking

Elasticsearch has in-built support for boosting search results in case we want to prefer some campaigns over others while fetching. There could be cases where we manually would want to fetch certain campaigns over others due to any business logic reasons, elasticsearch provided an easy way to achieve this

Scalability

We knew with our growth, we would need a system that could easily scale by simply adding more servers. Elasticsearch is highly horizontally scalable

Multi-tenancy

We wanted to ensure we can use a system that can be extended for other use cases if needed. Elasticsearch can support our needs by allowing multiple indexes to be created, each having its own configurations

Support

It was widely being used already at DoorDash. This meant we would have expert support in case we ran into issues

Results

We were able to massively reduce our operational costs while still maintaining high reliability and quality. In particular we were able to reduce ~50% costs for our Cassandra and Redis clusters and around 75% costs on our Kubernetes application hosting costs.

Things to explore

DoorDash is constantly evolving and expanding every single day. We believe this system has helped us serve our needs at this rapid growth pace, however we believe this is not the final solution. With DoorDash going into more countries internationally, expanding into other verticals, acquiring more consumers, and adding more stores to its platform, we will continue investing and iteratively improving our platform. Some ideas we are considering include, but are not limited to:

  • Hierarchical H3 geo-hashes.
  • Using dynamic Hexagon resolution levels instead of a static one based on market density. Benefits might include a more optimized way of fetching depending on density. Egg.: a dense location like NYC could use fewer hexes to represent it as it is super dense compared to a not dense location like Alaska.
  • Using a tiered storage system for data retrieval – offline for long term data and online for real time data.
  • Based on the above formula of the fan-out: T * V * S * C (Traffic * Verticals * Stores * Campaigns), optimizing the fetching of relevant but smaller sets of stores and campaigns. Using a first-pass ranker to reduce the candidates of stores and/or campaigns to evaluate could help alleviate issues. E.g.: For a dense location like SF, instead of fetching thousands of campaigns online, we could use a smaller but more relevant subset using relevancy scores between users and campaigns.

Acknowledgements

Thank you to Grace Chin, Chao Li, Fahd Ahmed, Jacob Greenleaf,  Jennifer Be, Yichen Qiu, Shaohua Zhou, Shahrooz Ansari and Sonic Wang for their involvement and contribution to this project