DoorDash is rapidly growing a logistics platform that enables millions of orders a day globally, and none of it would be possible without our world-class engineering team. Our customer-focused engineering culture drives our tenacious growth, with a team that is passionate about rolling up its sleeves and building products that will directly impact people in local communities.
As part of a hyper-growth tech company, we’re always looking for talented engineers who can attack new challenges with speed, create new solutions, and own large, complex problems. We are currently building out our remote and in-office teams in Seattle, San Francisco and New York City to create new, impactful products.
Join us at our upcoming event on October 26, where five engineering leaders from across our organization will share their varied experiences around joining the company as a new grad, insights on how to balance parenthood as an engineer, how mobility opportunities have helped our people grow their careers at DoorDash, and advice on those looking to start or grow their careers in engineering.
Attendees at the technical meetup event will hear from:
Osaide Ogbeifun, Principal Engineer
Osaide joined DoorDash in 2017 and is a Principal Software Engineer. Currently, he leads the technical vision and roadmap for OpEx organization, which covers fraud, identity, delivery experience, and money teams. He also manages cross-functional engineering initiatives. Osaide has a Bachelors of Engineering from Metropolia University (Formerly EVTEK) in Finland and a MS Information systems from DePaul University.
Janet Sun, Software Engineer
Janet Sun joined DoorDash in 2018 and is a Senior Staff Software Engineer. Currently, Janet is a tech lead for the Consumer Experience in the New Verticals team, expanding the consumer experience to convenience, grocery and more. Prior, Janet managed the Dasher Platform Team in the logistics organization. Janet holds a bachelors from Cal Tech as well as a masters degree and a doctorate from Stanford University.
Varsha Dudani, Director of Engineering
Varsha joined DoorDash in 2017 and is a Director of Engineering, leading the Dasher organization with Dasher experience, retention, rewards, satisfaction, and Dasher platforms. Before joining the Dasher team, Varsha worked in the Merchant organization, building and leading multiple teams. Varsha holds a masters degree and bachelors degree from the University of Mumbai with over 20 years of experience in Software Engineering at start-ups and mid-sized companies.
Erin Collins, Software Engineer
Erin Collins joined DoorDash in April 2020 as a Software Engineer on the Core Infrastructure CI/CD team. She contributes to all things related to automating, debugging, and streamlining our build and release software tooling, most recently leading up the effort to migrate our service deployments to Spinnaker. A Kentucky native, Erin earned a bachelor’s degree in Engineering Physics from Murray State University. After 10 years developing missile simulation software, she realized her passion for improving software and its processes and went back to earn a Master’s degree in Software Engineering Development Management from Carnegie Mellon. Coming to DoorDash has been an exciting opportunity to combine her passion and expertise into a rewarding career.
Drew Gomez, Software Engineer
Andrew Gomez (Drew) is a new grad engineer who interned at DoorDash in the summer of 2020. During his internship experience, he enjoyed the people and working environment and decided to join DoorDash full-time in December of 2021. Since then he’s been working on the Dasher Growth team, enhancing the Dasher onboarding process. Drew has a Bachelors of Science from California State University, Long Beach.
Liangxiao Zhu, VP of Engineering – Moderator
Liangxiao is a VP of Engineering at DoorDash, where she is leading the New Vertical organization that is expanding DoorDash’s local commerce platform into grocery, convenience, retail, and more. Prior to DoorDash, Liangxiao spent around 10 years at Meta where she was a Senior Engineering Director leading Payment efforts across Facebook, Instagram, WhatsApp and Oculus, enabling Ads Billing, Commerce, Creator Monetization, Digital Commerce, Donation, etc. She also launched Facebook Pay to empower everyone around the world to participate in the digital economy. Before Payments, she spent 7+ years building the Ads Product Platform, Business Graph and Management and led Developer Platform through Cambridge Analytica. She was one of the site leaders for Meta Seattle/Bellevue offices, and is passionate about building an office DEI culture. Outside of work, she spends a lot of time with her sons, who are 13 and 7 years old. She also enjoys cooking and gardening.
Topics of the event
The event will go over a number of topics related to our panelist and what they have accomplished. Specifically the panel will discuss:
How the engineering environment and culture has shaped their experience working at DoorDash
Their career path and career mobility at DoorDash
Their accomplishments at DoorDash and how their work directly impacts local economies
How they have been able to build their career while also balancing family responsibilities
Join us on Wednesday, October 26 at 12 p.m. PT to hear from these panelists and learn how you can spice up your career at DoorDash. Register here today!
At DoorDash, we take intentional efforts to recruit, empower, and retain team members from underrepresented communities, ensuring their perspectives are valued and they can thrive. As a company, we’ve also taken intentional steps in all aspects of our hiring, pay equity, and promotion efforts to empower equal outcomes.
While we have dedicated programs to support women and non-binary employees internally, we’re also partnering with great organizations like AnitaB and its Grace Hopper Celebration (GHC) as we strive toward a more equitable world.
“When talking about DoorDash, I always lead with how great the company culture is, how inclusive DoorDash is and the impact someone’s work can have on the company. As a Latina woman who happens to also be a veteran it can be hard at times to find a seat at the table where you also have a voice. DoorDash has given that to me.” – Dani Miranda-Erskine, Technical University Recruiter
Since its founding, GHC has become the world’s largest gathering for women and non-binary individuals in technical roles, bringing together professionals from all levels of experience to network, professionally develop, and find their place in tech. As a sponsor at the event this year, DoorDash had a heavy presence, offering opportunities to engage with our leaders at a conference booth, through dedicated workshop conversations, and at a happy hour event that included a fireside chat with our VP of Engineering, Ryan Sokol.
In addition to learning what life at DoorDash is like for dozens of team members across our engineering organization, attendees heard from Divyashree Joshi, Merisa Lee, Hien Luu, and Hima Bindu Maguluri, where they shared industry guidance and insights, ranging from simulating cybersecurity incident responses to how we apply machine learning to a look at the technology behind autonomously driving robots.
“DoorDash allows you to take on as much ownership as you want, so the professional growth opportunities are definitely there. There are opportunities to lead projects, to discover new ideas and have them be heard and potentially implemented, and there are opportunities to create a space for yourself that will help you grow in your own unique way.” – Ayanna Kosoko, Design Technologist, iOS
At our happy hour event, the DoorDash team shared our vision for representation and our progress toward 2025 commitments, with more than a third of our U.S. team coming from underrepresented people of color, 40 percent of our global leadership identifying as women or non-binary people, and how we’ve increased the number of hires from underrepresented backgrounds by 12 percent. Ryan also spoke to the importance of events like GHC, why support for women in tech is necessary for creating equal outcomes, and shared insights from his personal experiences early in his career that shaped the leader he is today.
“Professional development opportunities were critical in leading me to where I am today. It was important that a company invest in early talent and thankfully, I was given a chance early on, and I’ve parlayed that experience to grow my career to where I am today.
“And that’s why DoorDash is at GHC — to demonstrate our commitment to investing in women and underrepresented talent by connecting with those who are early in their careers and giving them the opportunity to parlay this experience to grow beyond what they thought was possible.” – Ryan Sokol, VP of Engineering
While GHC 2022 is wrapped up, our work doesn’t stop here. We’re hiring innovators to help us build the next great product at DoorDash. If you’re excited about the opportunities to work on impactful projects, own your career growth, and to be part of the future of DoorDash, check out open positions today.
Even state-of-the-art classifiers cannot achieve 100% precision. So, when we encountered a business problem on DoorDash’s ad platform that required an error rate of effectively zero, we turned to hybrid solutions that combine a classification model with human review. Here we explain the underlying entity linkage problem and show how to tune a fuzzy matching algorithm to reach extremely high precision without compromising recall.
Background: The types of ads a platform can run
There are many types of digital ads, even within a single company’s offerings. One simple example is DoorDash’s Sponsored Listings. A restaurant can promote its search result — and, optionally, a special offer — when a consumer searches for a relevant keyword in the DoorDash app. This is “simple” because an ad involves only three parties: DoorDash, the restaurant, and the consumer who will view the ad.
A more complicated example is DoorDash’s Sponsored Products, which introduces a fourth party: a consumer-goods brand whose items are sold through grocery or convenience stores on DoorDash. For example, suppose a consumer is browsing a grocery store’s DoorDash page, searching for “soda can” or clicking through categories. A brand owner — say “Fizzy Cola, Inc.” — can promote their offerings ahead of competing options, increasing awareness and sales. This is more complicated than the previous example because the advertiser, Fizzy, is a separate entity from the grocery store.
The challenge when the advertiser and store are different
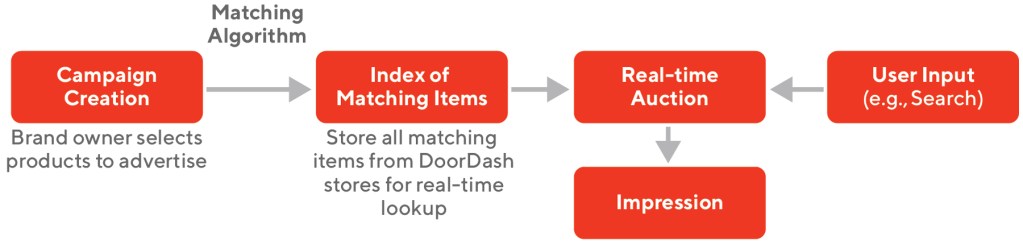
When the advertiser and the store hosting the ad are different, it’s harder to set up a new ad campaign because there are more possible placements. For Sponsored Listings, it’s relatively easy — if a fast-food chain wants to advertise free fries with any purchase, they tell our operations team which item on the menu should be free. But for Sponsored Products, if Fizzy wants to promote “Diet Fizz 12 oz. can (6-pack),” it would require manually sifting through all catalogs from thousands of stores where the item is available on DoorDash to select matching items to promote. We set out to automate that matching process to simplify campaign creation enough that brand owners could do it themselves, as shown in Figure 1. Without such automation, it wouldn’t be feasible to scale our exchange beyond a few dozen advertisers.
Figure 1: How matching fits into campaign creation and the broader flow of serving digital ads. We seek to enable the first two boxes on the left so DoorDash can advertise a relevant item in response to a user input (such as the search query “soda”). The challenge lies between these steps: we need an algorithm to link advertiser products to items on DoorDash.
Existing solutions are inadequate. Exact item name matches are rare because of variations in minor details like word order or how size is represented. A more reliable identifier — but still not reliable enough — would be the ubiquitous barcodes on most packaged goods that represent universal product codes, or UPCs. Advertisers know the UPCs for their own products, but stores on DoorDash don’t always offer reliable UPC records to match against. Codes can be missing or incorrect, or sometimes the same product can be described by multiple UPCs, making it easy to miss matches. We found that UPC-based approaches yielded only about half of the matches we sought.
Stay Informed with Weekly Updates
Subscribe to our Engineering blog to get regular updates on all the coolest projects our team is working on
Please enter a valid email address.
Thank you for Subscribing!
Business requirements
Beyond UPC matching, we investigated custom solutions. Figure 2 illustrates the problem, which we framed loosely as classification: Given an item provided by an advertiser, find as many matches as possible (high recall) in DoorDash’s store catalogs while also generating few bad matches (high precision).
Figure 2: The matching problem. A fictional product provided by an advertiser (left) might be matched to both appropriate and inappropriate items from DoorDash’s catalogs (right).
To use a software analogy, the advertiser’s product is like a class and DoorDash’s store catalogs contain millions of instances with mutations in attributes such as item name. Or from philosophy, the product is like an ideal platonic form. Our goal is to trace each imperfect catalog item back to the class (or form) from which it originated.
False negatives and false positives carry different business costs:
A false negative means missing a match. The advertiser won’t get to advertise their item at that store and DoorDash loses ad revenue. On a healthy ad exchange, revenue loss is not quite linearly proportional to false negatives, because ad auctions tend to have multiple participants. We set a soft target of identifying 80% of all true matches.
A false positive — generating a bad match — can be much costlier. It depends on the type of mistake. For example, if we mistook a 12-pack of Diet Fizz for a 6-pack of Diet Fizz, then at worst the advertiser would be annoyed. We set a soft target to mess up minor attributes like quantity, size, and flavor in fewer than 5% of matches. But if we mistook a competitor’s soft drink for Fizzy Cola it would be a nightmare — Fizzy asked us to promote their product, but we instead promoted a competitor’s. To add insult to injury, we would automatically bill Fizzy for the mistake. The rate of such an error must be zero.
Modeling approach
It would be unrealistic to expect even a powerful model to meet such strict requirements as 80% recall and especially 95 to 100% precision. Human assistance is essential to perform at that level, but a purely manual approach is infeasible at scale. Our prospective advertisers offer hundreds of thousands of unique products, and DoorDash’s convenience and grocery catalog contains millions of both redundant and unique items.
We settled on a hybrid approach:
First, a fuzzy matching algorithm compares advertiser product names against DoorDash store items to generate match candidates. In short, the algorithm considers each word separately and generates a total score based on how many words match or nearly match, differing by only a character or two.
Each candidate is then reviewed by at least one human. In this case, we contracted an external vendor.
With proper tuning, the algorithm ensures high recall (few false negatives) and human review ensures high precision (few false positives).
Tricks to tune the algorithm
The following techniques helped us maximize performance of the overall hybrid approach.
Optimize the fuzzy threshold. By default, our matching algorithm returned the best advertiser product match for each store item, along with a confidence score from 0 to 100. Discarding matches that score below a threshold favorably trades recall for precision as shown in Figure 3. We typically chose a low threshold between 80 and 90 to keep recall high.
Figure 3: Impact of fuzzy threshold on classifier performance. Metrics shown are for the base algorithm only, before human review and without additional improvements discussed below.
Evaluate top k candidates. Sometimes the algorithm’s favorite candidate is a bad match and one of the runner-ups is correct. Exposing more than one candidate for human evaluation — typically three to ten — greatly increased the hybrid approach’s precision and especially recall. The cost is more time spent evaluating, but that’s lower than it seems because auditors find it efficient to review similar candidates in quick succession; and after finding a match, they can skip any remaining candidates in that batch.
Limit the search space. False positives occur only when the pool of possible matches is large. For our application, to find a match for an item somewhere in DoorDash’s catalog, the search pool consists of hundreds of thousands of advertiser products. We simplified the problem for the beta launch of the Sponsored Products ad exchange by allowing only a handful of advertisers to participate. This shrank the search space by more than a factor of 10, improving the precision of our beta algorithm without losing recall as well as buying time to continue developing it.
Apply metadata constraints. Similarly, metadata — features beyond item name — can restrict the match search. The most useful dimension we found was item quantity. For example, if a brand owner labels their product “qty 6” while a store labels a possible match candidate “qty 12,” then the two items almost certainly are different and there’s no need to compare names. However, edge cases matter: “qty 1” and “qty 12” might be a match if the intention behind the former was “one case of 12.” We also considered aisle metadata, but it was too inconsistent; for example, frozen taquitos might sometimes be categorized as “snacks” and sometimes “frozen”. Finally, we looked at size metadata, but the edge cases included challenging issues such as unit conversion and decimal precision.
To accommodate deadlines and limited contractor resources, we also tuned our approach according to the business impact we expected. For example, we lowered the fuzzy threshold and increased k when checking items carried by DoorDash’s most popular stores, concentrating our review there to maximize the number of matches found.
Without directly changing the base fuzzy matching algorithm, the last three improvements above enhanced its performance from 27% precision and 54% recall to 38% precision and 73% recall. After adding human review as a second step and further tuning for business impact, the hybrid approach met our aggressive requirements.
Other applications of product matching at DoorDash
In addition to the ad exchange, these product matching techniques also contribute to streamlining our universal retail catalog. Matching items from individual store catalogs to a single universal catalog helps to improve the consumer experience by filling in missing metadata, such as photos. We currently use both UPC matching and fuzzy matching for this process, but we are investigating other types of item identifiers like price lookup codes to improve support for weighted items.
Conclusion
To create a catalog data infrastructure for a scalable ad exchange, we combined fuzzy matching with manual review, ultimately achieving high recall and very high precision when mapping advertiser items to those offered through DoorDash. Without changing the base algorithm, we demonstrated a few techniques to improve performance that should generalize well to other record linkage problems.
Acknowledgments
The authors thank Kyle Tarantino and Sam Eade for designing the manual review process and Hai Yu for proposing item quantity and size constraints.
DoorDash offers an immersive internship experience where all our interns fully integrate with Engineering teams in order to get real industry experience that is not taught in the classroom. This is the first in a series of survey posts that will showcase some of our summer of 2022 intern’s projects. You can read about each project below.
DoorEye – Monitor ML Model Insights and Production Variance at Scale
By Wenfei Tang
We are building DoorEye to help our users from the Data Science and Machine Learning Team (DSML Team) monitor ML models in production and enhance ML model observability at DoorDash.
Why monitor models?
Model monitoring is crucial in the lifecycle of an ML project because after a model is deployed to production we want to make sure it’s performing as expected. ML models may suffer from model drifting or production variance after being put into production. Model monitoring, the process of supervising the quality of these ML models, can help us detect these problems and provide model evaluation in the long term. We can also plan model retraining accordingly based on the feedback from monitoring.
Problems with the legacy monitoring approach
Previously, our users from the Data Science and Machine Learning Team (DSML Team) monitored their model’s performance using an unscalable and manual approach. This approach was challenging for a few reasons:
It was inefficient and did not scale well enough to meet our needs. Our users regularly need to manually run monitoring scripts to observe the performance of their models in production and have to set up a separate script for every model.
Traceability was a challenge. We could not connect the created model metrics back to the metric source.
Performance history was not provided. The model metrics and the labeled datasets are not stored. This prevents our users from analyzing historical model performance data. It is also difficult to run these scripts on a regular cadence and are only fit to run one off performance evaluation.
Our solution – model monitoring framework with declarative interfaces
We would like to support our users from the DSML Team by building DoorEye, a model monitoring framework which allows our users to monitor model insights and production variance at scale. DoorEye supports auto-triggered offline model evaluation, visualization of computed model statistics using our common metrics UI, automated labeled datasets and performance metrics storage in the Data Lake, historical data retrieval from the Data Lake, and threshold-based alerting for model drift detection. We are building DoorEye so that it can become a one-stop shop for product model insights for our users.
Key results and impact of DoorEye
After building and launching DoorEye, we were able to improve the quality and productivity of the model monitoring process for our internal users.
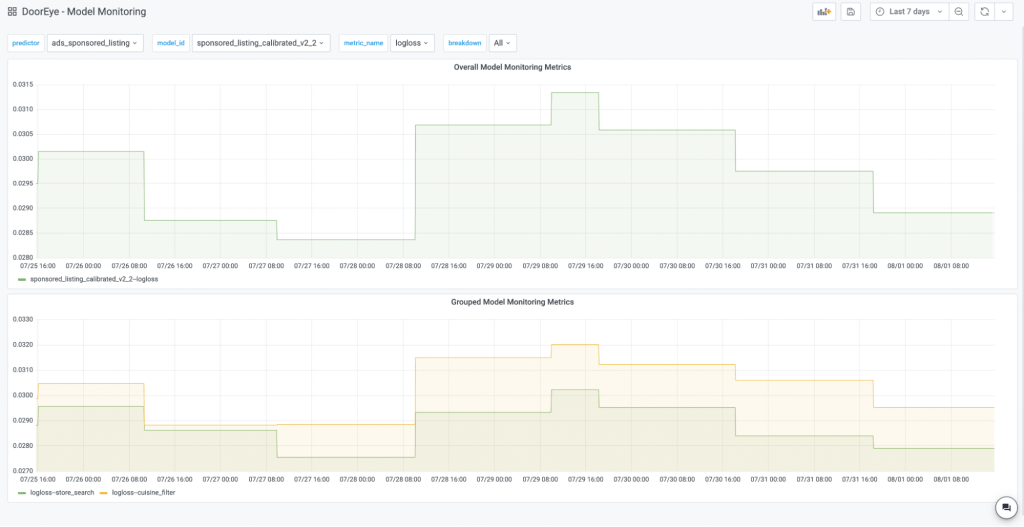
Our users now only need to submit a single configuration file to a centralized repository instead of creating a separate monitoring script for every model. DoorEye automatically triggers the job based on the schedule that users provide (see Figure 1) and completes the rest of the workflow for model monitoring. Users will then have direct access to dashboards with customized model statistics and data slicing (see Figure 2), and can retrieve data from Data Lake (AWS S3). DoorEye also makes model monitoring more cost-efficient because we can quickly detect failed jobs for our users with a centralized repository and avoid wasting computational resources. So far, the feedback from the team has been positive and appreciative of how much easier it is to monitor models in production.
Figure 1: Auto-triggered model monitoring jobs from DoorEye. Figure 2: dashboarding for model metrics with customized data slicing
Overall, DoorEye completes the step of deployment and monitoring in the lifecycle of an ML project. It addresses the velocity of creating new metrics for models by automating and standardizing the offline model evaluation process, and allows our customers to monitor model insights and production variance at scale.
Building a Promo Code DevOps Tool for a Better Understanding of Campaigns
By Jayeon Koo
With initiatives like Summer of DashPass growing larger each year, the Promotion engineering team regularly has to step in when promotion codes aren’t working. While promotion code errors seem simple, often the only feedback is that there is an error when consumers try to use a code at checkout. Therefore, we needed to build a deployment automation tool that would help debug broken promotion codes by collecting promotion validation events and allowing engineers to query that data with flexible queries. In this blurb, we will discuss the technical challenge in more detail and explain how we build the tool to address it.
Reasons that promotion codes may not work for an order
There are a lot of different conditions that we need to check before allowing a customer to use a promotion code; if a promotion code is authenticated haphazardly, this can easily lead to an influx of fraudulent orders. When we try to debug issues related to promotion codes, engineers and consumers alike will receive only an error message without more specification of what led to the error message. The error message would be something like “Something went wrong with the promotion, please try again later”. The same error message can have a number of different causes. So although promotion codes may fail for different reasons, they will often show the same generic message to the clients, and even to developers. Understanding the issue involves a long process of identifying the campaign in our database, gathering information about the experience from the customer or engineer that first spotted the bug, attempting to reproduce the error from an employee account, and checking logs in the terabytes of logs we collect everyday. This is a long debugging process that we would like to automate if possible so that creating and maintaining promotions is easier.
Building the DevOps tool to debug promotion code issues
To remove the painful debugging process involved in fixing a broken promotion code, the Promotion engineering team decided to create an internal tool to act as a one-stop solution to gather all relevant information about a promotion validation event automatically. Instead of manually reproducing the error to see where it could have possibly gone wrong, this tool will have enough information to directly give insight about what happened with the order. Figure 1 outlines the high-level overview of this project’s structure as two subsystems of write path and read path, or collecting data and analyzing the data. This classification helps to break down the project in the order of implementation and the sequence of information paths. Below we will explain the process of building this tool using this classification.
Figure 1: Promo Code DevOps tool structure consists of a write path (information from promotion service written into the database) and a read path (reading the said database).
Write path: gathering the right information
The first step of this tool is to make sure that the information in question is logged accurately and thoroughly in the database. To debug a failing promotion code, useful information includes the promotion code, the consumer’s unique ID, items inside the cart at the point of promotion usage, timestamp, and the error messages for each attempt. All the data logged from promotion codes were saved into a separate database table for faster data querying. This information can be then analyzed and queried via the read path implementation of this DevOps tool.
Read path: querying the desired information
Now that we have collected the data in a separate table, we need a tool to query that information for easier access and better user experience. Using BloomRPC, which is a graphical UI for gRPC, we set up an endpoint to query the newly created database. The query object includes several fields such as the promotion code, store ID, and start/end time to allow flexible querying practices, as shown in Figure 2. Of course the database remains available for the developers to use the information to the fullest extent.
Figure 2: UI Mockup of the DevOps tool – developers can extract information from the target order by adding filters on fields such as Store ID and Consumer ID
How the DevOps tool has sped up debugging
As soon as the table and endpoint were ready, the Promotion engineers started using them during their oncall rotations. One particularly useful scenario was when a promotion was designed with a specific item, such as get X off when purchasing Y item. An operator helped to set up the promotion for a merchant who wanted to sell more canned drinks from their store, but the promotion code was not working as expected. The root cause was that the item inventory list in DoorDash is not consistent. For example, the same exact soda at a grocery store and a convenience store may have different item ids. In this case, the promotion specifically called for a soda with item ID A, when the merchant had a soda with item ID B listed on their store. This discrepancy in the item ID was quickly identified when a developer placed an order using the promotion code in question with the can of soda in the cart.
This has been a powerful development for the team’s workflow, and has potential for great impact beyond the end of the internship.
Extending Kubernetes Horizontal Pod Autoscaler
By Jianna Liu
DoorDash uses Kubernetes to run microservice workloads. Most microservices in our system run on Kubernetes and are managed by Deployments and Argo Rollouts. Microservices are either given a set number of pods throughout their lifetime or have a dynamic number dependent on CPU utilization when Horizontal Pod Autoscaling (HPA) is enabled. What does that mean exactly and what is the problem we are trying to solve?
Currently, to allocate a dynamic number of pods, microservices utilize HPA to determine how many pods they are given. HPA will determine this number of pods by measuring the CPU and/or memory utilization of this microservice. There are use cases that are not supported by autoscaling using CPU. For example, many workloads utilize load shedding. Load shedding means these workloads will reject excess traffic once a workload comes close to becoming overloaded. Thus, these load shedding workloads will not see too many CPU spikes, meaning that for them CPU will not be an accurate metric to autoscale by.
By not scaling accurately, we waste resources and have more operations burdens. In June 2022, a lot of DoorDash’s cloud infrastructure costs originated from Kubernetes EC2 nodes. By introducing autoscaling of external metrics, we estimate we can prevent resource waste for each microservice.
We integrated KEDA , an open source framework, into our system to help us autoscale on a variety of events through user-defined events. The impact we seek to have is reduced costs for the company due to less wasted resources and less manual intervention from developers.
Deploy a ScaledObject
Let’s start by running a quick experiment. Before we start, please make sure there is one Kubernetes cluster available and KEDA is installed in the cluster.
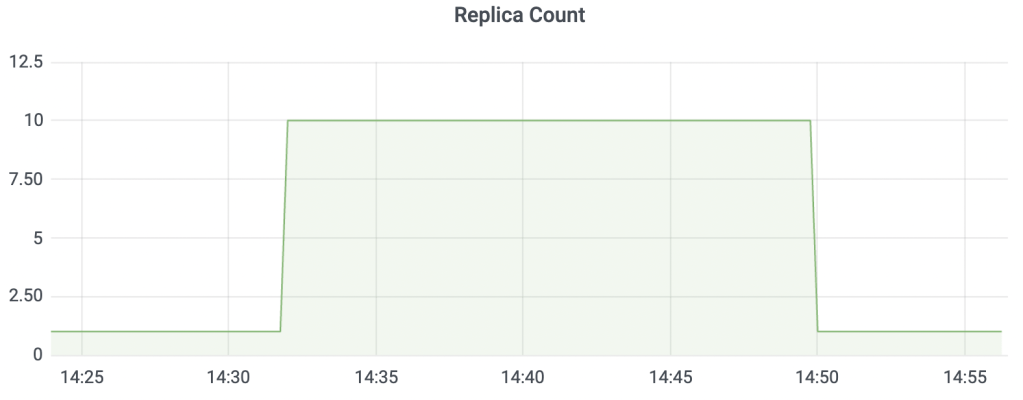
This yaml file will create a ScaledObject that auto scales the php-apache deployment (specified under .metadata.labels.deploymentName). We are using a Cron scaler.
Figure 1: Replica Count over time.
At around the 30th mark, the deployment count should increase to 10 and at around the 45th mark, the deployment count should decrease to one as shown in Figure 1.
How does KEDA work?
Its architecture is shown below. Let’s dive a little deeper.
Figure 2: Diagram showing KEDA in action.
First, a user will create a ScaledObject, as shown in Figure 2. The KEDA controller will watch for any new ScaledObjects.
If the use case is to scale the pod from 0 to 1 or from 1 to 0, the KEDA controller will manage the deployment replicas directly. If the use case is to scale the pod from 1 to n or from n to 1, the KEDA controller will internally create a Kubernetes HPA to manage the deployment.
HPA will read metrics from the Kubernetes API server which then forwards the request to the KEDA metric server.
The KEDA metric server contains the values of all of the event metrics, subject to which scaler we use. In the above diagram, the metric server is using a prometheus scaler.
We will support the CPU scaler, the Cron scaler, and the Prometheus scaler for the first iteration. The CPU scaler will allow KEDA to have feature parity with current HPA autoscaling. The Cron scaler autoscales to a predefined number of replicas in a predefined time period. This process provides proactive autoscaling, allowing microservices to anticipate heavy load and define allocation of pods for predicted periods of peak traffic. The Prometheus scaler autoscales based on external metrics from Chronosphere. This provides reactive autoscaling. We expect that proactive autoscaling using the Cron scaler can cover most use cases. However, when proactive autoscaling does not anticipate traffic correctly, reactive autoscaling will be able to help.
So how can developers use KEDA?
Internally, we use helm charts to deploy services. We will introduce a new field autoscaling in the helm chart, where there are both predefined sub parameters and flexibility for users to define their own parameters.
One issue we foresee is that people could input the wrong query on accident, and this will result in inaccurate autoscaling. Thus, we want to offer the ability to have pre-defined metrics such as qps, as well as give users the flexibility to define. We are not sure what exact pre-defined queries we want to offer just yet, but after talking to developers, we hope to find a pattern in a common query. We anticipate common queries to be QPS and queue size for Kafka workers.
What are some important metrics?
Important metrics we want to keep track of to guardrail our migration include the following:
keda_metrics_adapter_scaler_error_totals – The total number of errors encountered for all scalers
keda_metrics_adapter_scaled_object_errors – The number of errors that have occurred for each scaled object
keda_metrics_adapter_scaler_errors – The number of errors that have occurred for each scaler
keda_metrics_adapter_scaler_metrics_value – The current value for each scaler’s metric that would be used by the HPA in computing the target average.
go_threads – created by KEDA controller, number of threads created
go_gc_duration_seconds – created by KEDA controller, pause duration of garbage collection cycles
go_goroutines – created by KEDA controller, number of goroutines that currently exist
controller_runtime_reconcile_errors_total – created by KEDA controller, total number of reconciliations per controller
workqueue_adds_total{name=”horizontalpodautoscaler”} – created by kubernetes controller manager, total number of adds handled by workqueue:
workqueue_duration_seconds_bucket{name=”horizontalpodautoscaler”} – created by kubernetes controller manager, how long processing an item from workqueue
workqueue_depth – created by kubernetes controller manager, current depth of workqueue
apiserver_request_terminations_total – created by kubernetes apiserver, number of requests which apiserver terminated in self-defense
What does success look like?
Success looks like the complete migration of microservices currently using the old interface to the new interface and onboard most services to autoscaling.
We hope that our impact involves reducing costs for the company due to less wasted resources and less manual intervention from developers.
Building New Internal Tooling Infrastructure to Improve the DoorDash Customer Support Experience
By Michael Yu
Like many companies, DoorDash uses a variety of methods to authenticate an account. To improve the customer experience we want to make this process as painless as possible. Common authentication methods include two-factor authentication, push notifications, and SMS messages.
Emails are commonly used for multi-factor authentication as well, but sometimes users are unable to receive authentication emails. Not getting emails prevents users from performing important actions such as logging in, password resets, or creating a new account. In this blurb, we will discuss the impact this has on the user experience and how we built internal tooling to resolve the issue.
Pain points with customer support
A user that is unable to receive two factor authentication emails will naturally reach out to DoorDash’s support team. However, the support team doesn’t have the ability to change email subscription preferences. Tickets that cannot be handled by support get forwarded on to on-call engineers, which can take some time to resolve and take up valuable engineering time. To reduce the daily workload for the Core Platform on-call team, we created new tooling to help resolve this common issue.
Creation of new internal tooling
As a solution to this email verification problem, we have built a new internal tool to extend permissions to the support team to view and update email subscriptions without the assistance of the engineering team. This tool will alleviate the problems above as it will increase support team coverage of these types of tickets, reduce response time, and reduce the on-call workload of the Core Platform team. Such a tool, which is depicted in Figure 1, should allow the user to get email subscription preferences, modify those subscription preferences, check permissions of the user, and be easy to navigate and utilize.
Figure 1: Main page view of email subscription tool displaying my DoorDash account’s subscription statuses
Architectural deep dive
To build this email permissions tooling, we had to build a new full stack application.
On the server side, we created a new gRPC microservice to hold the logic of email preference management and user authorization. This new service will serve as the home of all future notification preference management, providing the initial infrastructure to facilitate development of additional preference management tools for other notification types beyond emails, which is anticipated.
On the client side, we chose the service to be located with other internal tools on Admin Gateway, an Apollo GraphQL based backend for frontend (BFF) middle layer. DoorDash uses this layer to isolate backend development from the front-end, as well as aggregate, process, and forward requests from the client to internal services. Here on Admin Gateway, we added a new responsive tooling page using React that integrates with the BFF middle layer to communicate with the server-side microservice.
These design details can be seen in Figure 2 below.
Figure 2: Flow diagram of the new tool, describing the path of data from the origin of the client’s request to the email providers’ response
Impact of our solution
In total, the email subscription support tickets account for ~60% of all tickets received in July 2022, making up a majority of tickets for the Core Platform team. The creation of this tool will significantly reduce the number of tickets that constantly clutter up the Core Platform channel, increasing on-call productivity by eliminating these numerous daily interrupts.
Additionally, these tickets are not only a nuisance for the engineering team, but for the support team and the customer as well. For the customer’s experience, the issue may take a few days to resolve, depending on when the engineering on-call can pick up the ticket. For the operator’s experience, the support team often has to reach out to multiple different teams before they find a solution to those tickets. By eliminating the engineering team from the process, we can increase the customer turnaround time from a few days to the instant that the customer reaches out to the support team, improving both the customer experience and the operator experience.
Building Extensible Notification Banners Across Pages
By Xiaochuan Xu
The notification feature is one of the most important features on the DoorDash app. It not only helps users track their latest order status, but it also notifies consumers about the best deals in their area. However, millions of users haven’t subscribed to marketing push notifications, which gives them less opportunity to enjoy the benefits that DoorDash offers.
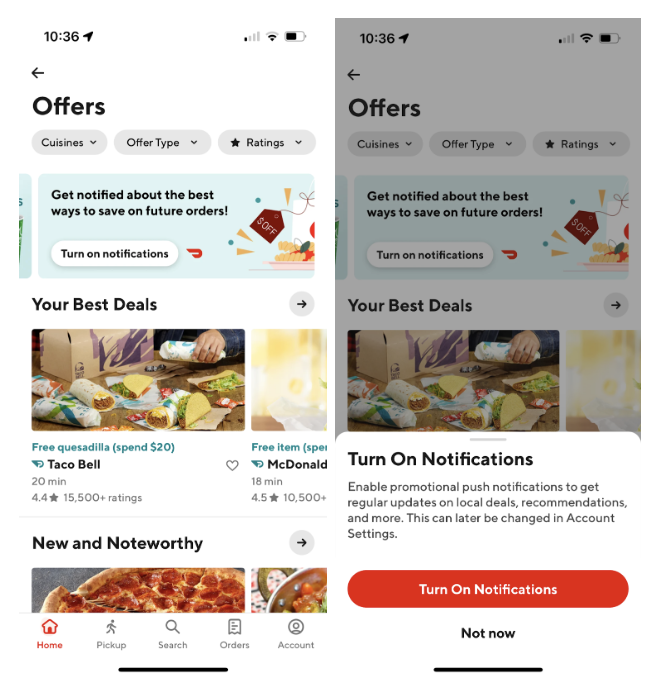
In order to build a notification banner, as shown in Figure 1, we needed a way to add it extensively so that it could easily be added to every page in a short time frame. While building banners is relatively easy, making them extensible is challenging because on one hand, these banners are similar since all of them share the same users’ notification preferences, and on the other hand, each of them needs to have a standalone experiment and a feature flag, so that the analytics can monitor the effectiveness of each banner. Given these challenges we built a backend tool that would allow us to build extensible banners more easily. Using this new solution, we can easily ramp up the notification banners on other pages, bringing more marketing push subscribers more quickly in the future.
Figure 1 – Notification banners on Offer Hub page
Technical challenges in adding a new notification banner
Adding a new notification banner in a particular page may not be a hard job, but creating an extensible way to add a new banner on different pages is difficult. For one thing, we would like to avoid repeated calls to obtain the users’ notification preferences, and reuse the information for all banners. This can greatly reduce the burden of downstream service that provides users’ preferences. Additionally, we would like to exert fine-grained control on each banner for experiment settings and feature flags. The seemingly conflicting condition adds additional difficulty in implementation. If we forcefully put all these requirements together, the resulting codes will become less maintainable, less readable, and more lengthy. Unfortunately, the previous implementation took the most obvious way, combining these requirements coupled together. What’s worse, the situation will deteriorate with more notification banners being added on different pages.
Building an extensible notification banner solution
To build an extensible notification banner solution, we had to pursue the following steps:
Review the legacy solution, specifically we needed to figure out the existing endpoint, which will filter and return necessary banners to a consumer
Ensure that users’ preference information is reused across different banners
Design our own solution that would fit into the architecture of the existing endpoint since it can provide us with a fine-grained control on individual banners
Reviewing the legacy solution
To build an extensible notification banner, the first course of action was to take one step back and revisit how the endpoint (getBannersV2) of returning those banners works, as depicted in Figure 2. There exists a filtering pipeline in getBannersV2 that will firstly fetch all relevant campaigns (note we will use “banners” and “campaigns” interchangeably for simplicity) for a consumer. Then the EligibilityMetaData will be generated, which is the metadata that stores all the information necessary to filter out invalid campaigns later on. Next, the filter will check a campaign based on a series of criteria, comparing each of them with the EligibilityMetaData, so ineligible campaigns will be filtered out and only valid banners will be returned to the client side for a particular request.
The original filtering pipeline is elegant and efficient since it decouples the process of fetching users’ information (EligibilityMetadata) with the step of actually checking the information. However, the previous implementation of the notification banners doesn’t honor this pipeline. Instead, it added an ad-hoc logic to fetch users’ notification preferences, and then check against it to filter the banners related to notification (Figure 2). This solution is not able to solve the technical challenges mentioned above, and becomes worse every time a new banner is added.
Figure 2 – The flow of filtering inside getBannersV2; step in red shows the additional check of previous implementation, which should have been incorporated into the third step
Ensuring user notification preference data is reusable across banners
After reviewing the architecture of getBannersV2(), we realized that the essence of the solution is to reuse the original filtering pipeline, which means we should add our own logic in the right place within the pipeline.
For users’ notification preference data, we can fetch once and reuse it multiple times for different banners. Therefore, during the generation stage of EligibilityMetadata, we should make an external gRPC call to another service at DoorDash, to fetch users’ notification preference data and store it into EligibilityMetadata for later usage.
To actually use EligibilityMetadata, we should ensure this campaign (banner) has a new corresponding user criterion regarding users’ notification preferences, as shown in Figure 3 . To achieve that, we need to build a new userCriterion through the protobuf, and assign this criterion to the notification banner, which indicates that we would like this banner to be checked against the notification preferences of a particular user. The filtering pipeline will automatically execute the whole process for us.
Figure 3 – Filtering pipeline illustration in getBannersV2() endpoint
Providing fine-grained control on individual banners
One of the benefits of embracing the pipeline is that it facilitates us to manage the experiments of individual banners with a user interface, the campaign manager. With that, we don’t need additional codes for setting the experiments for a banner. Instead, all we need to do is to configure the experiment for a particular banner in the campaign manager. This helps us add a new banner more quickly, since new banners no longer require any code changes regarding the experiments.
Benefits of the new implementation
With the new implementation of the notification banner, it can be easily and quickly extended to other pages. Compared to the initial implementation, the logic for filtering the banners based on users’ notification preferences is the same and can be reused across notification banners on different pages. Moreover, we will not need to program experiments in the codes. Instead, by embracing the pipeline, the campaign-level experiments are naturally supported. Compared to using runtime to programmatically change the experiment settings, we can now configure the experiment through DoorDash’s in-house experiment platform – Dynamic values. Overall, the refactoring can reduce the roll-out time of the notification banner from a few hours to just a few minutes, greatly saving the engineer’s efforts.
Impact
This project has brought positive engineering influence, but perhaps even more importantly, the project is generating positive business impact as well. After refactoring, the Offer Hub page notification banner has been ramped up to all iOS users, which is millions of targeted users. We expect there will be an annualized increase of hundreds of thousands of marketing push subscribers due to this feature.
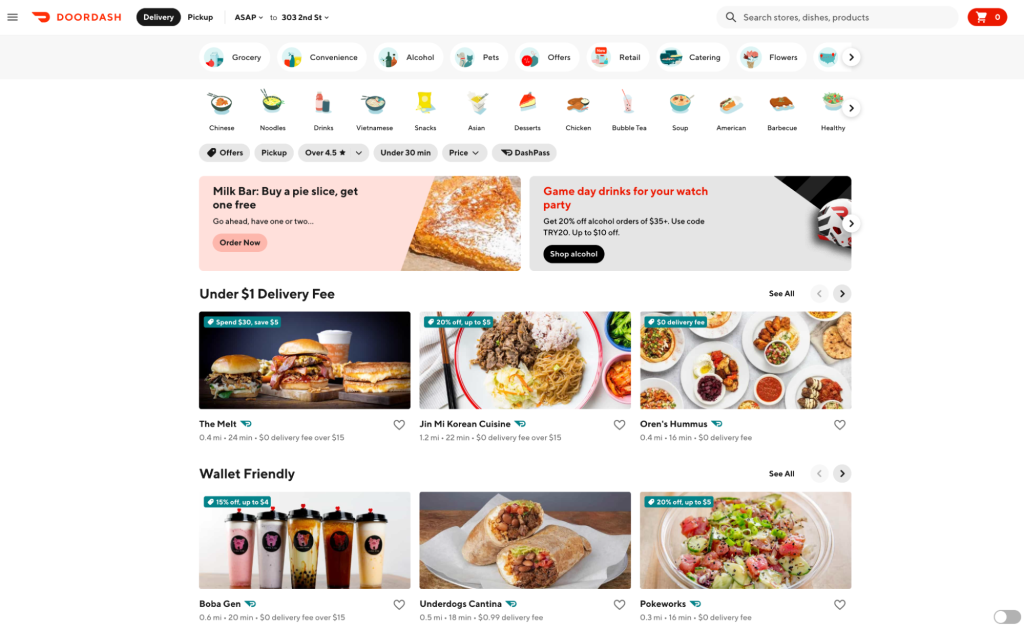
Building quality recommendations and personalizations requires delicately balancing what is already known about users while recommending new things that they might like. As one of the largest drivers of DoorDash’s business, the homepage contributes a significant portion of our total conversions. Its layout, as shown in Figure 1, is meant to inspire customers to order their favorite food and discover new merchants. Given the homepage’s limited real estate, we wanted to add personalization features to improve the customer experience through increasing the relevance of every item presented there.
Figure 1: DoorDash’s homepage displays local items, stores, and promotions to entice users to make an order.
Building personalized recommendations is challenging. Each person is nuanced in what they like and that varies based on how they feel when ordering. Personalized recommendations requires knowing each consumer well enough to surface the most relevant merchants in the space constrained homepage, typically from more than 1,000 merchants available. Additionally, our recommendation must adapt quickly to changing consumer interests at different times of the day, day of the week, and locations. Personalized recommendation at DoorDash involves using both what we already know about users ( also known as exploitation) and showing users new things to better understand what they like (also known as exploration) to improve consumer experience.
In this post, we will first give a high-level overview of how our homepage rankings work and then zero in on how our model balances exploitation and exploration during ranking to optimize the consumer experience while simultaneously improving fairness for merchants. After introducing both the challenges and opportunities in relevance ranking for mixed types of homepage entities, we present our machine learning (ML) solution, a deep-learning-based learn-to-rank (LTR) model — universal ranker (UR). We discuss the need to go beyond exploitation, sharing our exploration approach based on the concept of upper confidence bound (UCB), a reinforcement learning method known for solving multi-armed bandit (MAB) problems. Finally, we illustrate a ranking framework integrating UR and UCB, and discuss how we make intelligent trade-offs between exploitation and exploration in our homepage recommendations.
What’s behind DoorDash’s homepage recommendation
From retrieving information of thousands of stores to presenting a unique experience for consumers, DoorDash’s homepage recommendation can be divided into three major stages:
First pass ranking, or FPR, is the first part of the retrieval stage and includes:
Selecting no more than 1,200 candidates from ElasticSearch that are most relevant to the consumer experience among all stores
Satisfying a combination of strategies, such as including certain popular stores while guaranteeing diversity across verticals (for example, restaurants, convenience and grocery stores, or retail stores)
Second pass ranking, or SPR, filters and pre-ranks those candidates, ultimately:
Choosing up to 50 for the first page of the store feed
Ranking stores/items within horizontally scrollable carousels, each of which offers different subsets of candidates (for example, a “National Favorites” carousel might contain popular chain stores while the “Now on DoorDash” carousel might suggest newly onboarded local stores)
Final ranking, or FR, is the concluding stage, resulting in vertical rankings of all available carousels and stores on the first page of the store feed.
Our efforts here focus on the FR stage, which determines the order of contents shown to consumers when they scroll vertically.
Stay Informed with Weekly Updates
Subscribe to our Engineering blog to get regular updates on all the coolest projects our team is working on
Please enter a valid email address.
Thank you for Subscribing!
Contending with comparing different entities on the DoorDash homepage
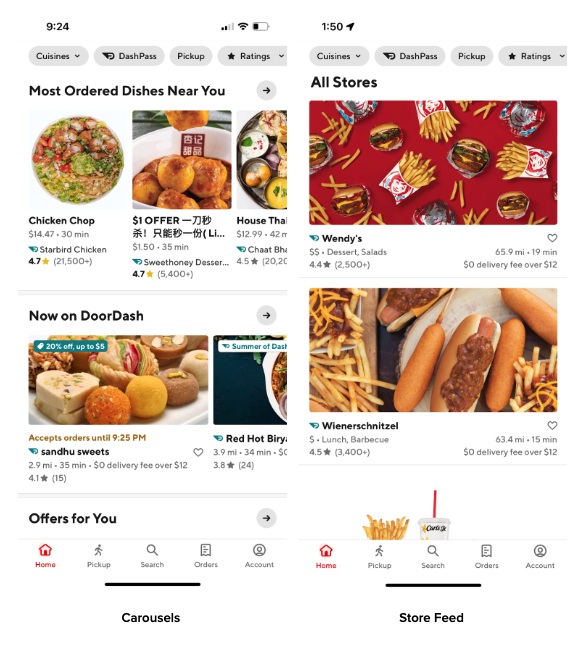
To better illustrate the complexity at the FR stage, it’s helpful to introduce how the DoorDash homepage showcases entities through its organization and layout. We define an entity as any content module that can be placed into a single slot on the homepage, such as a merchant, an item, or an offer. As shown in Figure 2, a single entity could be a store or an item while a nested entity, or carousel, contains ordered individual entities such as the “Now on DoorDash” store carousel or an item carousel such as “Most Ordered Dishes Near You.”
Figure 2: Examples of entities on the homepage highlighting relevant merchants and products to consumers
As discussed, the total candidates for recommendation already have been significantly narrowed in the initial two stages to fewer than 50 carousels — the actual number varies at different locations and time of day — and no more than 50 individual stores for the first page of the store feed. However, these candidates consist of a mixture of different entity types, which creates huge challenges for building ranking models.
Difficulties with scalability and calibration
It is not practical or scalable to build a dedicated ranking model for each entity type, both because a new model is required each time a different entity type lands on the homepage and because each model subsequently requires maintenance going forward.
What’s more, even if we built these dedicated models, it is difficult to calibrate and compare the scores they produce for different entities. For example, say we want to recommend highly relevant and good-quality Japanese restaurants and dishes to consumers who often order sushi or ramen. While it might be straightforward to compare relevance between two restaurants, comparing a Japanese restaurant with a store carousel consisting of more than 10 popular Asian restaurants and their dishes is a nontrivial task. That challenge demands comparing apples and oranges.
Enhancing relevance and efficiency opens opportunities
The ability to rank mixed entity types helps unlock the potential for more relevant homepage recommendations.
On our existing homepage, we have a fixed order for entities:
nested carousel entities come first
single-store entities come second
This worked well initially in 2020 when there were only half a dozen carousels; consumers could either scroll horizontally to engage with a favorite carousel or vertically to move quickly to individual stores for more options. But the number of carousels has exploded to more than 30 as of the third quarter of 2022, making it hard for consumers to see any individual stories below the carousels. The old homepage organization makes for a suboptimal consumer experience today. While we could place highly relevant stores just below the carousels, the distance from the beginning of the consumer journey sharply lowers their visibility. Switching positions of stores and carousels could result in low-relevance stores getting top billing, wasting precious impression opportunities.
To address the issue, we launched a new UI framework. It allows intermixing experiences on the homepage to unlock the potential for more optimal homepage recommendations; for instance, a more relevant store could be ranked higher than a less relevant carousel overall, as shown by the “New” UX in Figure 3. However, this new experience also has created challenges for the ML ranking model. Our solution has been to develop a single model that essentially can compare apples and oranges to showcase the best products to consumers.
Figure 3: Homepage ranking with mixed entity types
Building a universal ranker to empower exploitation
To improve homepage engagement, we built the UR to provide consistent ranking across a variety of entities, prioritize better relevancy, and shorten the consumer’s shopping journey. As noted earlier, this LTR model uses a deep neural network to leverage the learnings from the deep learning recommendation model and “Wide & Deep” learning, which deploys jointly trained wide linear models and deep neural networks. The UR jointly ranks vertical positions for mixed types of entities by order of their pConv — probability of conversion, which is how we measure the relevance of a recommendation.
The most complex and universal aspect of developing our UR was figuring out how to compare different entities in different places. Ultimately, we accomplished this by creating a consistent relationship across all types of entities. From high to low, we define three hierarchical levels of entities: 1) a store carousel, 2) an individual store/item carousel, and 3) an individual item, where a higher-level entity can be represented by an ordered sequence of lower-level ones. For example, a store carousel could be viewed as an ordered list of stores, each of which also could be viewed as an ordered list of items. With the bridge through individual stores, a store carousel can then be viewed as an ordered, nested list of items. The model ranks a store as a carousel with only one store and an item within that store as a carousel with only one store and one item. With this sequential relationship, we can then construct the features of a high-level entity from the low-level ones it contains. Using a feature “f” as an example, we build the feature for an individual store and a store carousel as follows:
individual store 1: [f_1, padding, padding]
carousel with 3 stores: [f_1, f_2, f_3]
In addition to the padding/clipping approach, where we need to define a pre-fixed sequence length, we can also incorporate a layer such as LSTM to transform the sequential features into the same dimensions as individual ones, which the model then can easily use.
The UR’s features can be divided into four major categories:
Entity-related features such as cuisine type, price range, popularity, quality, and rating
Consumer-related features such as cuisine/taste preference, vegan status, and affordability
Consumer-entity engagement features such as view/click/order history, rating, and reorder rate
Context-related features such as delivery ETA/distance/fee, promotion, day part, week part, holiday, and weather conditions
In addition to traditional numerical and categorical feature types, we heavily used embeddings across all the feature categories, including both pre-trained embeddings from existing ML models and embedding layers trained as part of the model itself. The ETL for the batch features was developed and maintained through our internal tool Fabricator and the LTR UR model was implemented in PyTorch.
With this model, we can show consumers items they might like despite the varying entity challenges. The next step would be to expand our model beyond what we think they like so we can broaden our understanding of customer preferences.
Exploring beyond exploitation
Only focusing on exploitation can lead consumers into the so-called filter bubble/ideological frame problem. This occurs when existing consumers begin to perceive only a small subset of merchants with whom they are already familiar, creating a self-fulfilling prophecy in which consumers buy primarily similar items. Recommendations for new consumers might be biased toward their initial engagement rather than their true preferences; their homepage may be flooded with very similar options, reducing the amount of time left to explore.
This exploitation also may delay response to consumer preference changes over time because exploitation models have strong momentum for previous behaviors and are slow to adapt to new information. Consumers also could become bored with what they perceive as a stale homepage; the lack of inspiration could depress order rates. On the merchant side, over-exploitation could cause fairness issues over time as popular merchants become ever more dominant while new merchants recede into the platform’s background.
Enabling exploration using upper confidence bound
To overcome these problems, we introduced a reinforcement learning approach based on a UCB algorithm to enable consumers to explore. In a greedy manner, the UCB algorithm favors exploration actions with the strongest potential to maximize rewards, where potential is quantified in terms of uncertainty. While there are various UCB variants with different assumptions and complexities, the core concept involves the expected reward and its associated uncertainty for a given action:
where t is the total times of all the previous trials of recommending an entity e to a consumer c.
e* t, c is the optimal entity we want to recommend to a consumer c at a time t;
e t, c Et, c are an individual entity and the entire entity set available to consumer c at time t, respectively;
Q̂ t(c, e) is the expected reward for consumer c on an entity e;
Û t(c, e) is the uncertainty of the reward for a consumer c on an entity e.
Based on Hoeffding’s inequality for any bounded distribution, this approach guarantees that with only a probability of e -2tÛt(c, e)2 could the actual reward Qt(c, e) be higher than the estimated UCB of Qt(c, e)+Ut(c, e). If we choose a very small constant p for e-2tÛt(c, e)2, then we have:
To have higher confidence in our UCB estimation as we continue to collect more reward (conversion) data from our recommendations, we can reduce the threshold by setting p=T-4 following the UCB1 algorithm:
where T is the total trial times for consumer c on all recommended entities, while t is the total trial times of entity e to consumer c.
How we combined exploitation and exploration
It is neither feasible nor optimal to directly implement the UCB in its original form because:
Each consumer can choose from thousands of stores and hundreds of thousands of items at a certain location and time, making it impossible to try each of them and hampering collection of cumulative conversion data to estimate the pConv.
Estimating the expected pConv for entities with mixed types adds further complexity
The recommendation engine produces a ranked list of entities for each consumer. But because a single app window can only show a few entities and because each consumer can choose how deep they wish to browse/scroll, there’s uncertainty around how many of the recommended entities will receive effective consumer feedback.
When introducing fresh options for a consumer, we need to control uncertainty carefully so that they do not add confusion or interrupt the consumer experience.
Given these considerations, our final solution was to integrate the UR into the UCB algorithm. This allows us to make scalable and smart trade-offs between exploitation and exploration, allowing fresh choices for consumers without disturbing their routing experience.
Defining the composite model
We define the reward from any recommendation as the consumer conversion within a certain time period; hence, the expected reward essentially is evaluated by the expected pConv for any consumer-entity pair. The consumer-entity impression is used to track the effective recommendation trial and estimate the uncertainty of the corresponding pConv. The final UCB score is then obtained by blending the UR score (pConv) with the uncertainty. Data driving the UR and uncertainty is refreshed daily; the entire process could be viewed from a Bayesian perspective. Each day, we assume the prior distribution for the pConv variable has the mean and standard deviation of the current UR score and uncertainty. We then compute the posterior distribution with another day’s consumer-entity engagement data:
where Nc is the total impressions for the consumer c on all recommended entities within a certain time period
Nc, m is the impressions between consumer c and entity e within a certain time period C is the exploration coefficient
The uncertainty increases slowly and logarithmically as a consumer’s total impression goes up but decays rapidly with the linear relationship as the specific impression for a certain entity increases. This relative relationship benefits the ranking system in two ways:
It improves freshness when a consumer mostly engages with a few entities (for example, the top 10 on the homepage). Although the UR scores for these entities remain high, their uncertainties will continue to drop rapidly. On the other hand, those entities without impressions would have their uncertainties continue to increase until they are large enough to force their way into the top 10.
It aids quick homepage personalization when a consumer enjoys broad exploration. With multiple impressions for various entities, there is a consistent uncertainty drop for each of them such that the composite score converges to its UR score, which is sensitive to positive engagement signals such as clicks, orders, and good ratings.
We also add the exploration coefficient C for the uncertainty because we are less interested in its accuracy but more in its scale, which directly determines how much disturbance will be introduced to the existing ranking (for example, how many new entities are surfaced higher and how different their positions are historically). The optimal C is then determined later through online experiments.
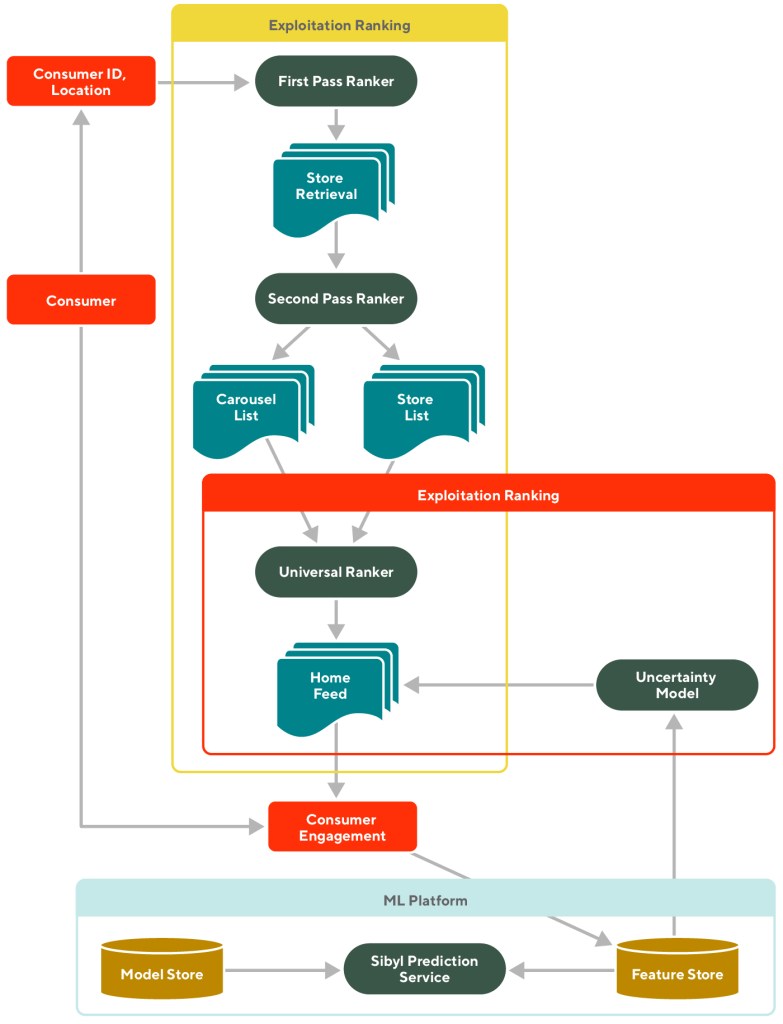
Integrating all models into a ranking framework
The DoorDash homepage ranking framework with all these pieces put together is shown in Figure 4. The exploitation component includes the FPR, SPR, and UR, while the exploration component introduces uncertainty to the expected pConv predicted by the UR. By continuing to collect and update the engagement data through daily refreshed features, we can generate a more accurate mean of the pConv while building more confidence in our uncertainty estimation.
Figure 4: Example ranking framework with exploitation and exploration components
Enabling a better homepage experience
With the newly developed framework, we give consumers an improved dynamic experience, including:
Keeping the most relevant entities at the top (high UR scores)
Downranking the entities that are somehow relevant (median UR scores) but have way too many impressions (low uncertainties)
Trying new entities from lower positions (low UR scores) that have little chance to be shown to the consumers (high uncertainties)
Prioritizing the newly tried entities if they receive positive feedback from consumers as measured by orders or good ratings, which also represents improved UR scores with dropped uncertainties
Deemphasizing newly tried entities if there is no positive feedback from consumers — for instance, only views but no further actions. This represents low UR scores with dropped uncertainties
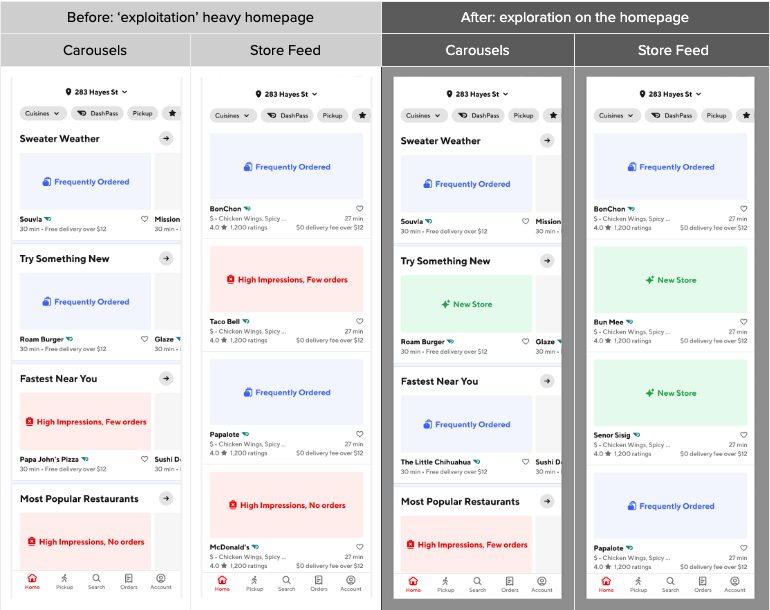
As can be seen in Figure 5, the change primarily impacts existing consumers who previously have browsed entities on our platform. There is little impact on new consumers for whom we have no engagement data. We show the example experience using carousel and store feeds separately because the homepage experience with mixed entities remains a work in progress.
Figure 5: Homepage experience powered by the ranking framework
With the developed framework, we observe consistent improvements in our online experiments. The new experience drives more consumers to engage with our recommendations and convert on the homepage. More consumers are interested in trying new merchants and items they never ordered before, which not only enriches their experience but also creates more opportunities for our local or new merchants rather than our enterprise ones.
Conclusion
We have demonstrated here the challenges, opportunities, and goals for homepage recommendations at DoorDash. Two machine learning approaches — including a deep-learning LTR UR model and a reinforcement learning algorithm UCB — have been integrated into our existing ranking framework. Through online experiments, we have proven that the ranking framework can efficiently rank various entities with a smart trade-off between exploitation and exploration to optimize consumer experience, improve marketplace diversity and fairness, and drive DoorDash’s long-term growth.
Our work to date shows positive results, but there are still potential improvements we can make. So far, we have only introduced exploration to vertical rankings. But it could be promising for horizontal ranking within high-level entities such as store and item carousels at the SPR stage and possibly for candidate retrieval during the FPR stage. Note, too, that the current exploration coefficient is uniform for all consumers; we could personalize it for different consumers based on their shopping behavior and exploration sensitivity. Ultimately, Thompson sampling could be an alternative to test against the current UCB approach.
Acknowledgments
Special thanks to Josh Zhu, Jay Zhang, Parul Khurana, and Janice Hou who worked together to make this exciting work happen! Also thanks Di Li, Sandor Nyako, Eric Gu, Xiaochang Miao, Han Shu, Matthieu Monsch, Abhi Ramachandran, Chen Dong, Chun-Chen Kuo, Mengjiao Zhang, Kunal Moudgil, Mauricio Barrera, Melissa Hahn, Kurt Smith, Meng Chen, and Wu Han for sharing their insights on the development and support for the execution of the ideas in this blog post. Our gratitude also goes to Elena Lin and Jessica Zhang for the data-driven insights and for helping us develop the experiment strategy and measurement framework. Thanks Ezra Berger for the continuous support, review, and editing of this article.