Pride Month honors the ability of every person to be their authentic selves. We celebrate the progress that has been made for LGBTQIA+ people, while acknowledging the work that still needs to be done. DoorDash is working to empower the LGBTQIA+ community this month and throughout the year by supporting nonprofits serving LGBTQIA+ people, amplifying LGBTQIA+ voices, and highlighting LGBTQIA+ employee, Dasher, merchant, and community stories.
Our national campaign Every Flavor Welcome invites our community to make room at the table for individuals who don’t have a seat. This year, we’re even creating our own Every Flavor Welcome…Flavor available via DashMart later this month. For every Every Flavor Welcome seasoning sold, we will donate a $25 DoorDash gift card to The Okra Project, up to $25,000, through the Community Credits program. The gift cards will support The Okra Project’s mission to provide free, delicious, and nutritious meals to Black Trans people experiencing food insecurity.
“The Okra Project’s philosophy is very simple: where there is a need, meet it, and do it in style. As the world becomes more aware of the daily systemic and interpersonal struggles that Black Trans people face every day, The Okra Project’s focus on holistic nourishment has never wavered. We remain committed to our community and steady in the fight to ensure that every Black Trans person who comes to the table may eat with abundance. Providing meals is a great start to removing some of the barriers that contribute to multilevel discrimination preventing Black Trans people from accessing adequate food. Partnering with DoorDash is helping us deliver on our promise to nurture and support Black Trans people experiencing food insecurity and more. This is the flavor we savor.” — Ianne Fields Stewart, Founder, The Okra Project
In addition to our Every Flavor Welcome… Flavor seasonings, for every Caviar pickup order during the entire month of June, Caviar will donate up to $25,000 to the Ali Forney Center. The Ali Forney Center is the largest and most comprehensive program in the U.S. dedicated to meeting the needs of homeless LGBTQIA+ youth, and works to empower LGBTQIA+ youth with the tools needed to live independently.
In Canada, we are producing a second round of our Courageous Conversations card decks rooted in core Pride themes: Individuality, Empowerment, Community and Acceptance. Additionally, $1 from any order made on Pride Sunday’s across the country will be donated to Queer safe spaces in Toronto at the 519, Vancouver Saige Community Centre & Montreal West Island LGBTQ2+ Centre. We truly believe that conversations open minds and create change.
“You can’t make room at the table if you don’t know who is missing a seat.” — Paul Costa, Pride@ Co-Chair
The DoorDash employee community is celebrating Pride Month in many colorful ways, too. Our Pride@ Employee Resource Group (ERG) will host a panel featuring LGBTQIA+ DoorDash merchants to share how they have navigated the cis, straight, white male-dominated industry and succeeded in the face of these challenges. We are also excited to discuss the topic of being “out” in sports with sports icons and basketball stars Jason Collins and Natasha Cloud, and screen the docu-short, Manning Up, which spotlights comedian James Lorien McDonald’s journey as he transitions from female to male. Throughout June, DoorDash is matching employee donations to our Pride Community Support Fund benefitting The Trevor Project, the San Francisco Lesbian Gay Bisexual Transgender Community Center, and The Okra Project.
During Pride, we’re reminded that “making room at the table” is a year-round commitment. We’re proud to count LGBTQIA+ people as our friends, colleagues, and family members.
— —
For each Every Flavor Welcome seasoning purchased from select DashMart while supplies last, DoorDash will donate a $25 gift card to The Okra Project. For every Caviar pickup order between 6/1/21 and 6/30/21, Caviar will donate $1, up to $25,000, to the Ali Forney Center.
The vast majority of work in developing machine learning models in the industry is data preparation, but current methods require a lot of intensive and repetitive work by practitioners. This includes collecting data, formatting it correctly, validating that the data is meaningful and accurate, and applying transformations so that it can be easily interpreted by models. Machine learning engineers at DoorDash routinely perform these tasks as part of our development process, and through careful observation of common data issues we have developed analytical tools to accelerate the data preparation process.
In this post, we’ll discuss the most common data issues in machine learning datasets, including missing and invalid values, outliers, defaulting, and sampling errors. We’ll also show how our new, open-source DataQualityReport library for Pandas quickly and easily uncovers these issues and can be applied to a wide variety of data.
Introducing DataQualityReport
To share what we at DoorDash have learned about data quality, we have released a new open source library called DataQualityReport (https://github.com/doordash-oss/DataQualityReport) that generates diagnostics for datasets specifically targeting data validation for machine learning models. Throughout this article we will use DataQualityReport to uncover common data quality issues through simple methods which work with any Pandas dataframe.
Getting started with DataQualityReport
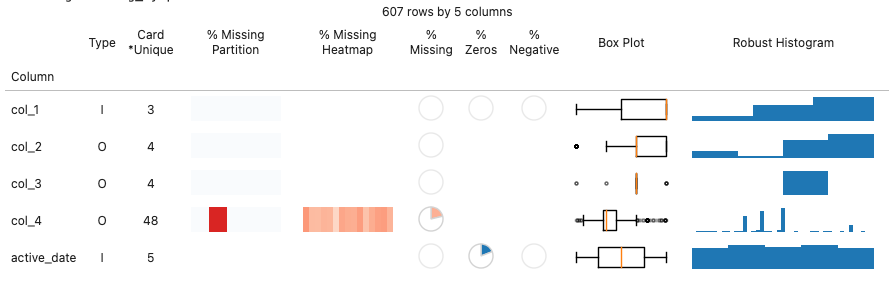
To start our guide on how to use the DataQualityReport tool, we will begin with the `dqr_table`, as seen in Figure 1. Dqr_table provides a wide range of information about each column within a Pandas dataframe.
Figure 1: An example of the dqr_table visualization
Using dqr_table with a Pandas dataframe requires two simple lines of Python code:
from dataqualityreport import dqr_table
dqr_table(my_df) # supply your own dataframe: my_df
In this article, we’ll discuss common data quality issues, as well as show how dqr_table highlights these issues and makes it easy to quickly diagnose them.
Identifying missing values
Perhaps the most obvious data quality issue is missing data in the dataset. Beyond identifying that data is missing, understanding characteristics of the missing data can help provide clues about how best to proceed when training ML models .
Grossly missing values
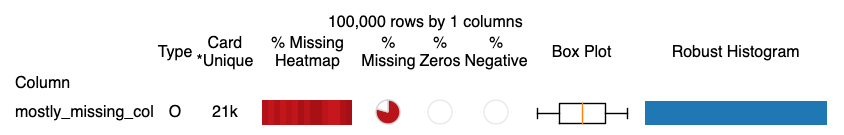
Sometimes a field isn’t being populated, usually due to a logging error, or the query used to generate this field fails to join it correctly. An example dataset is shown in Figure 2.
Figure 2: Sample dqr_table with a severe missing value issue: The % Missing column shows a simple pie-chart representation of the missing proportion.
While pie-charts are much maligned among information design practitioners, we found that in this compact format, pie charts offer some significant advantages, as shown in Figure 2. Unlike bar charts, no axis is required to understand what proportion of values are missing. They also are extremely compact and easy to scan – which is likely why the related harvey balls are frequently used in business presentations and consumer rating magazines alike.
Partially missing values with correlations
Often, a collection of data fields is not available under certain conditions, such as a particular product outcome (e.g. order cancellation), or related properties for a foreign key (e.g. store dimensional data) that was not found. Understanding the correlation between fields can both be helpful to root cause an issue, as well as prioritize which data quality issues to address.
Figure 3: Sample dqr_table with correlated missing values: The % Missing Heatmap column easily highlights that columns 2-4 likely have a related data quality issue, while column 1 is a different issue.
Missing values by partition
For companies doing data collection from online services, publishing data to the data warehouse is often done as a daily ETL process. Each day, source data logs and external sources are processed, and a new ‘partition’ for the day, i.e. yesterday, is populated for tables in the data warehouse. DataQualityReport allows users to define a partition column (here named `active_date`) and constructs a visualization of the missing proportion grouped by that column.
Figure 4: Sample dqr_table with missing partitions: Col_1 is missing many partitions as shown in the % Missing Partition column.
In Col_1 of the dataset shown in Figure 4, it is likely something changed over the observed period either in the collection of this data, or a portion of the data population process was not completed.
Col_2 exhibits a likely more acceptable, but still notable issue. The final partition is partially missing data. This happens frequently as some data sources may not be fully available in time for the next data population job. This partition will be repopulated the next day once all the data is available. From an ML perspective, the incidence of missing data in this scenario is likely not representative of the distribution of missing data in the online scoring environment, so it may be appropriate to remove this final partition.
Missing data comes in a variety of flavors, and detecting trends in missing data can help easily determine how severe the issue might be, how its root causes might be remediated, and how modeling may be affected by data quality.
Invalid values
Some fields may only be valid within certain ranges. Two of the most common domains are non-negative and non-zero values. Within DoorDash, time duration features (e.g. 3 minutes of Dasher wait time) are often constrained to be non-negative, and potentially non-zero as well. In other contexts, -1 or 0 are used in place of NULL as default values that indicate a valid value was not available.
Figure 5: Sample dqr_table with invalid values: Col_1 contains a small fraction of negative values, while Col_2 has zero values.
Figure 5 demonstrates using two pie charts to easily detect the range of a given field: % Zeros & % Negative. It is worth noting that the pie chart is particularly effective in distinguishing between identically zero and small but non-zero percents while enabling easy scanning across multiple fields.
Data distribution anomalies
Some of the most difficult to detect data quality issues happen when values are present and within the domain of valid values, but are still biased or reflect other errors in data processing.
Outliers
Features can sometimes assume extreme values that are artifacts of data quality issues and / or may cause issues with model training. Some common data failure modes that result in extreme values include:
Users providing times that are off-by-one day / hour
Users providing times in the wrong time zone or UTC vs. local
Client devices that have the wrong device time (perhaps maliciously)
Software Testing (e.g. some testing / canary environment is generating logs for ‘fake’ data that doesn’t have valid properties)
Overflow errors on data types
Figure 6: Sample dqr_table with outliers: Col_1 has extreme positive values that may need to be removed or winsorized.
The most common visualization for understanding outliers is a box plot. As shown in Figure 6, DataQualityReport includes the Box Plot for each column to easily find and visualize outliers. Tree-based machine learning models can often handle outliers easily in features, but parametric functional models, such as regression or neural networks, need to remove or bound inputs to models.
Default values
Systems can sometimes use non-zero, non-negative values when source data is not available, also known as defaulting. In machine learning use cases, an overall or conditional mean may be used to replace missing values in the online environment.
In another scenario, sometimes a default value is populated into a user field, which can be modified by the user but frequently is left unchanged as seen in the Robust Histogram of Figure 6. The robust histogram uses an interquartile range outlier removal process to create a usable histogram of just the core distribution in a feature. If there are spikes for specific values in the distribution, that indicates that there is likely some factor contributing to a bias towards these values. Machine learning models can learn and account for these biases, but it also may be useful to provide separate features indicating when these biases are active (e.g. did the user input the value directly or just accept the default).
Identifying sampling errors
Supervised machine learning models try to generate predictions across a given distribution of inputs that match target outputs. We design our training set distribution to match the distribution of production inputs we expect to see and evaluate our loss function across this distribution. However, training data doesn’t always match this distribution, most often due to duplicate join keys but potentially due to other upstream data processing errors.
Figure 7: Sample dqr_table with unique and almost unique columns: Col_1 is unique (as indicated with the *), while col_2 is not unique.
Figure 7 demonstrates how the Cardinality field helps understand the number of distinct values in a field, and whether each value is unique, as indicated by the * (star character). If a field that should act as a sample primary key is not unique, the data set may be corrupt or the data generation process flawed.
In machine learning applications, alignment between training and serving features is also very important. Common issues include encoding categorical variables differently between training and serving, using different numerical transformations / units for continuous variables or staleness / latency issues with real-time features.
DataQualityReport provides a special method for comparing multiple datasets, dqr_compare, which produces a table similar to the one shown in Figure 8.
Figure 8: Sample dqr_compare for comparing training and evaluation datasets: Col_1 does not appear to be adequately represented in the evaluation set.
In addition to sorting your column names alphabetically to collate columns across datasets, the histogram and box plots share common axes when the same column exists in multiple datasets, enabling easy comparison of outliers and distributional variations.
Finding Bad Data Types
Python is a dynamically typed language allowing developers to throw data into Python without thinking too much about how it should be stored. In many cases, machine learning modeling libraries can handle these inputs gracefully, although problems can arise when numeric values are handled as categorical, or vice versa.
Figure 9: Sample dqr_table with an object column: Tooltips are available for many of the elements in the dqr_table.
The Pandas data type (i.e. dtype) is included in the Type column of the DataQualityReport, as seen in Figure 9. Here, a numeric value is encoded as an object type, which may cause problems for some ML libraries. Often the solution is to cast the column to a new type, or ensure that the correct type is inferred by Pandas / Python by updating the source data processing and ingestion.
Conclusion
Data quality issues come in a variety of forms, from obviously missing and extreme values to biases hiding in duplication and defaulting. Detecting these issues quickly and diagnosing likely causes will help prioritize which problems need to be solved, which can be handled through ML techniques, and ultimately lead to better performance and success in ML modeling projects.
DataQualityReport is now open sourced under an Apache 2.0 license and we welcome contributions and feedback on the project. You can find out more about using DataQualityReport in our tutorial.
Infrastructure-as-code is growing in popularity because it automates and streamlines the complexities of deploying company infrastructure into multi-cloud environments. DoorDash uses Terraform with Atlantis GitOps workflow to provision its infrastructure. These technologies worked great initially, but as the business continued to grow, our cloud infrastructure expanded significantly. The core-infra team engineers soon became full-time code reviewers for all the changes that were needed to keep the platform from breaking. Naturally, at this volume human error began to start impacting the platform’s health negatively. Networking changes, database updates, or failure to review infrastructure pull requests all could impact the entire organization in potentially very expensive and time-consuming ways.
A critical part of infrastructure deployment revolves around ensuring automated provisioning, updates, and management of cloud infrastructure quickly without breaking requirements related to security, reliability, or costs. We will discuss here how DoorDash leverages an open policy agent, or OPA, to build policy-based guardrails with codified rules that ensure velocity and reliability for cloud infrastructure automated deployments.
Defining infrastructure-as-code
Infrastructure-as-code, or IaC, allows managing and provisioning infrastructure through code instead of using manual processes. Terraform is an infrastructure provisioning tool that allows use of HCL HashiCorp Configuration Language — to describe and create the desired infrastructure and automatically delete and modify existing infrastructure. At DoorDash, we use GitHub for version control and to manage the lifecycle of our IaC, integrating it with a set of CI/CD tools known as GitOps.
Defining policy as code with an open policy agent
An OPA is an open-source, general-purpose policy engine that unifies enforcement across the stack. Using a high-level declarative language called Rego, users can write policy and simple APIs as code to offload policy decision-making from the business logic. Among the policies that can be enforced are cloud infrastructure automation, microservices, Kubernetes, CI/CD pipelines, API gateways, and more.
OPA decouples policy decision-making from policy enforcement. When the software needs to make policy decisions, it queries OPA and supplies structured data such as JSON as input. The OPA generates policy decisions by evaluating the query input against policies and data.
At DoorDash we use an open-source utility tool called Conftest which uses the Rego language from OPA to check assertions. Using Conftest is pivotal for our goals because it allows us to validate the Terraform plan against the OPA rules inside the PR review pipeline process.
Using policy as code
Policy is a set of rules, conditions, or instructions meant to be enforced across the organization, including such things as cloud-native infrastructure, application authorization, or Kubernetes admission control. One example would be establishing policy rules to define the conditions required for infrastructure code to pass a security control and be deployed.
At DoorDash, we built policy-based guardrails by codifying rules to secure infrastructure deployments and changes, including but not limited to:
The critical resource changes that require extra code review from different teams (a good example of this might be a load balancer where a change may require an additional review from a traffic engineer)
The supported Terraform modules allowed for infrastructure changes, where so long as engineers are taking the prescriptive approach with respect to deploying a cloud resource the approval is automated
The specific actions allowed for particular resources
The changes that require security team review
Ensuring that cloud resources tags are being used
The cost parameters around allowable changes to infrastructure
Validating resource type to ensure engineers are taking advantage of existing reserved instances and savings plans
Recipe 1. Require core-infra admin group review when critical resources are deleted
package resources_protection

# Critical Resources List Examples
critical_resources = {
        "aws_elasticache_cluster",
        "aws_elasticache_replication_group",
        "aws_elasticsearch_domain",
        "aws_elasticache_subnet_group",
        "aws_db_instance",
        "aws_db_option_group",
        "aws_db_parameter_group",
        "aws_s3_bucket",
        "aws_route",
}

# check if any protected resources has unsupported delete ops
protected_resource_deletion_detect = true {
        type := input.resource_changes[r].type
        critical_resources[type]
        input.resource_changes[r].change.actions[_] == "delete"
}

# deny any protected resources delete ops
deny[msg] {
        protected_resource_deletion_detect
        msg := "Some of the resources actions require core-infra admin review.
}
Attempts to delete critical cloud resources from infrastructure code will generate the following “OPA check failed” message:
Evaluating cloud
FAIL - /root/atlantis/.atlantis/repos/doordash/default.tfplan.json - Some of the resources actions require core-infra admin review.
Recipe 2. Require security review for security groups with port 22 (SSH) without source restrictions.
package sg_module_check

ssh_open_to_all_cidrs = true {
	input.ingress[r].from_port == 22
	input.ingress[r].cidr_blocks[_] == "0.0.0.0/0"
}

deny[msg] {
	ssh_open_to_all_cidrs
	msg := "Security Group with SSH port open to all networks. It requires a security review."
}
Attempts to create/update a security group with port 22 and the CIDR 0.0.0.0/0 generates the following “OPA check failed” message:
Evaluating sec
FAIL - /root/.atlantis/repos/doordash/default.tfplan.json -
Security Group with SSH port open to all networks. It requires a security review.
Integrating OPA with Atlantis
At DoorDash, the infrastructure code review process is supercharged with policy-as-code through a custom workflow that uses Conftest in Atlantis (DoorDash’s setup predates official OPA support in Atlantis). We self-host Atlantis, which is an open-source golang application for Terraform pull request automation. When a GitHub pull request is created, Atlantis runs a Terraform plan and passes the plan file to Conftest, which then pulls custom policies written in Rego from an AWS S3 bucket, evaluates the OPA policy based on the Terraform plan, then comments the output to the PR — all in a single action. As shown in Figure 1, the PR owners then know whether their PR meets all policy requirements or requires fixes before it is submitted for further review.
Figure 1:DoorDash policy automation flowchart
Conclusion
With infrastructure-as-code becoming ever more prevalent, it’s becoming increasingly important to quickly identify cloud infrastructure changes, deployed resources, and usage. Using policy-as-code within infrastructure-as-code helps DoorDash automate infrastructure pull-request reviews and adds extra guardrails for continuously deploying infrastructure without fear of breaking anything. This approach also ensures our infrastructure stays compliant with company policies.
Ideas for the Future
One area also being actively explored is the introduction of cloud cost policies. We could set future policies on cost estimates before resources are launched. Such guardrails would enable our infrastructure team and the wider engineering organization to self-serve while staying within an acceptable cloud infrastructure budget. Also we can ensure no engineer or team can introduce significant spend changes without explicit approval from a member of our FinOps team.
The DoorDash core-infra cloud team is working on an API-driven self-serve approach for automating some of the infrastructure tasks currently done via the Atlantis GitOps workflow discussed above. The goal is to provide a unified experience for all infrastructure operations, which we believe is the future of engineering workflow changes. We will likely cover this in a future blog post.
At DoorDash, we are intentional in our approach to engaging people of all backgrounds while fostering an environment of diversity and inclusion. In partnership with our Unidos@ Employee Resource Group, we provide opportunities, support, and an amplified voice to all identifying with the Hispanic and Latin culture at DoorDash. During National Hispanic Heritage Month (NHHM), and throughout the year, we are proud to celebrate the culture and contributions of American citizens whose ancestors originated from Spain, Mexico, the Caribbean, and Central & South America.
“NHHM is a special month and time for our people to step into the spotlight, come together to share the diverse cultures and backgrounds that are woven in our Unidos fabric! It’s also an opportunity to celebrate our community and the different paths of life we’ve walked to get to this point.” – Adriana Jenings Farmer, Manager, Product Operations
To celebrate National Hispanic Heritage Month at DoorDash, our Unidos@ ERG is hosting a blend of virtual and in-person events. We will jumpstart NHHM with an afternoon of entertainment hosted by actor, writer, and stand-up comedian Erik Rivera. Employees will then compete for bragging rights in our NHHM themed trivia event kicked off by In the Heights actress Leslie Grace.
For an in-office celebration, participating offices will host our Monthly Cafecito y Chisme with Unidos@ featuring Hispanic treats. Our teams will have the opportunity to connect with colleagues, talk Hispanic comfort food, and enjoy traditional bites, such as croquetas, pan dulce, empanadas, and more. And to close out NHHM, we will host Lotería hour, a traditional game of chance similar to bingo.
As we celebrate NHHM, our Learning and Development team at DoorDash will continue to empower and encourage learning opportunities, including sessions around how to succeed as a Latina in a global work environment, how to develop your authentic self and more.
DoorDash will also continue to empower Hispanic and Latin Dashers, merchants, and communities throughout the year. Partnering with UnidosUS, the Caminos financial empowerment program helps Dashers save and plan for their financial future. Our Accelerator for Local Goods and Accelerator for Local Restaurants provide grants, training, and networking opportunities for merchants from underserved communities across the U.S. This fall, we launched applications for the Accelerator for Local Restaurants in partnership with the Hispanic Chamber of Commerce – Denver Chapter. Our Disaster Relief Fund provides grants to businesses recovering from natural disasters and to-date, at least 88% of grantees businesses are from underrepresented backgrounds. Finally, as part of our ongoing work to broaden food access, 85% of Project DASH deliveries are made to communities of color across the U.S. and Canada.
During Hispanic Heritage Month, Caviar will spotlight Hispanic merchants from across local neighborhoods. Be sure to check out the Caviar app to help support these businesses not only during Hispanic Heritage Month, but all year round.
Our support and celebration of Hispanic and Latin culture doesn’t stop at the end of National Hispanic Heritage Month. Through our company culture, community efforts, and engagement with merchants, we’ll continue to support and empower Hispanic and Latin merchants and the community.
To learn about how we’re making room at the table and to find open roles, click here.