Skip to content

When moving from a monolith to a microservices architecture, engineering teams often need to master a new programming paradigm. During our own migration, we opted to base our new backend architecture on Kotlin, shifting away from Python. Kotlin coroutines were an area our engineering teams needed to quickly understand.

While Kotlin’s benefits include a rich ecosystem, interoperability with Java, and developer friendliness, many engineers are unfamiliar with using Kotlin in backend development. It’s typically considered a frontend language, but it also allows implementing robust and high performance backend services. 

We created this guide to help engineers understand how coroutines work in Kotlin, as compared to Java threading. We will discuss what coroutines are, get an overview of language, library and scheduling components of Kotlin coroutines, and then deep dive into these components. The guide also helps illustrate programming with coroutines in general. 

What are coroutines? 

Let’s start with the basics. Coroutines, according to Wikipedia, are “computer program components that generalize subroutines for non-preemptive multitasking, by allowing execution to be suspended and resumed.“ Kotlin’s native language and runtime support for coroutines allows easy asynchronous programming when building high performance applications. Compared to a Java thread, a Kotlin coroutine has a smaller memory footprint and lower overhead in context-switching.

The example below comes from Kotlin’s official tutorial. This example created 100K coroutines with a few lines of code. The highlighted code will be executed in coroutines. Each coroutine prints a dot character after five seconds. The language and standard libraries make it super convenient to create coroutines, and the Kotlin runtime scheduling hides the complexities of managing concurrent coroutines.

import kotlinx.coroutines.*

//sampleStart
fun main() = runBlocking {
    repeat(100_000) { // launch a lot of coroutines
        launch {
            delay(5000L)
            print(".")
        }
    }
}
//sampleEnd
Figure 1: When coroutines are waiting for an external response, the Kotlin scheduler puts them in a suspended state and continues to process other coroutines.

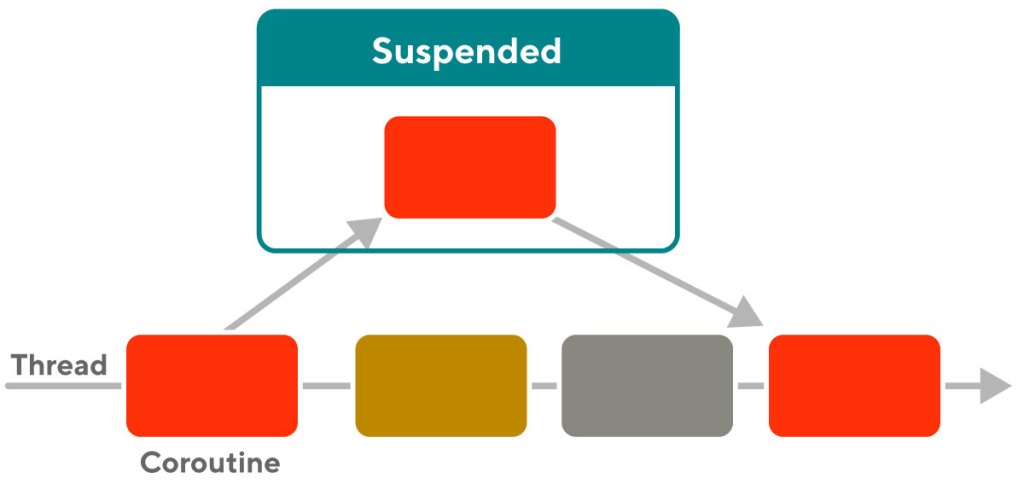
Figure 1 above shows how a coroutine’s body (actual code written by a developer to achieve a certain purpose) is executed by a thread. Coroutines are also suspendable. meaning that when a coroutine is waiting for an external response (such as a network response or a device I/O) it becomes suspended and the Kotlin scheduler moves this coroutine off the thread. The same thread can then pick up other coroutines waiting to be executed. This way coroutines appear to always be executing concurrently (but may not be simultaneously). In fact, replacing “suspended” with “blocked” and “coroutine” with “thread” points to an obvious analogy in that coroutines and threads both enter waiting states and can resume executing after transitioning out of waiting states. 

In addition to the code blocks in the above example, a function can be defined as suspendable using the keyword, “suspend”:

suspend fun doSomethingUsefulOne(): Int {
    delay(1000L) // pretend we are doing something useful here
    return 13
} 

In the above example, a coroutine running doSomethingUsefulOne will suspend upon executing the delay call, which makes the coroutine wait for one second. When the delay is finished, the Kotlin scheduler puts the suspended coroutine back into the thread for execution, returns 13 and finishes this function call.

By design, it is convenient to write asynchronous programming code without nested callbacks. Asynchronous calls, such as the delay code above, simply become suspend points and developers can focus on business logic.

Overview of the language, library, and scheduling components

Approximately three components, the Kotlin language, the standard library, and scheduling, combine to make coroutines work in Kotlin.

  • Language: The Kotlin language compiles directly to JVM bytecode. The runtime context and control flow states of a coroutine are managed through a mechanism called continuation passing. First, a method is called, and local variables are created on the stack. Then, upon suspension, the runtime saves all the local variables used so far, saves where the code has executed so far in this method, and returns the state. Finally, upon resume, the runtime restores all the local variables from the saved context, jumps to where the code was suspended, and resumes execution.
  • Standard library: All the support for coroutines is written in Kotlin’s core libraries. A coroutine internally uses a Continuation class to capture the contexts for its execution. Then the dynamic aspect is modeled as a Job class. The use of async usually creates a Deferred job, which is a subclass of the Job class. The CoroutineContext type is required for a coroutine to execute. To summarize:
    • “Continuation” is concerned with how Kotlin passes around blocks of code in a higher order functional way.
    • “Job” is concerned with how Kotlin manages the lifecycle of a coroutine (cancelled, completed, active, etc.).
    • “CoroutineContext” is concerned with the runtime of a coroutine or a group of coroutines, such as how it’s dispatched or existing context data. One of the important related concepts is CoroutineScope which defines an interface to wrap the coroutine context and facilitates context propagation among coroutines.
  • Scheduling: This is actually also part of the standard library. With language support we have a coroutine natively represented as some mechanisms in JVM bytecode. With standard libraries we are able to write code to create coroutines. The last step is to make the JVM runtime execute coroutines.
    • There are many ways to schedule a coroutine. Some common ways include default scheduling, which uses the CoroutineScheduler, and ExecutorCoroutineDispatcher, which wraps around a Java SDK Executor thread pool.
    • When a Job is ready to execute, it will be executed as a DispatchedTask. The code block (coroutine in byte code) will be run and the returned state will further be dispatched through a dispatcher.

A closer look at the Kotlin language for coroutines through compiled codes

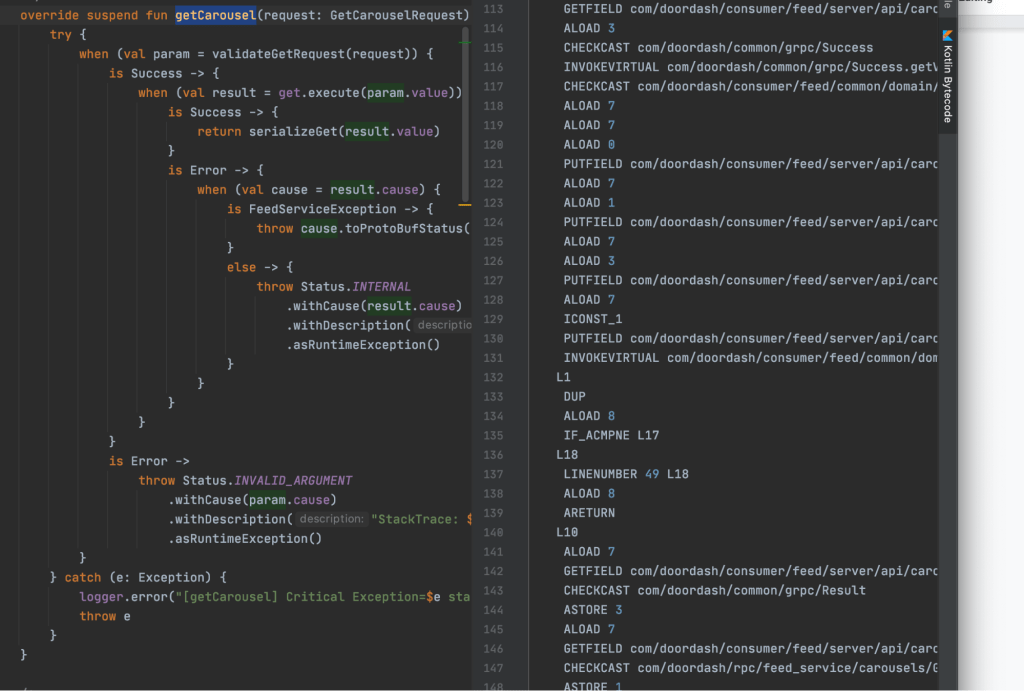
Let’s see in a code sample what a coroutine is. We will use a suspend function, shown in Figure 2, below, as the running example. In this example we used the IntelliJ IDE for Kotlin-to-bytecode inspection and JVM bytecode decompilation.

The IntelliJ IDE supports inspecting a Kotlin function through compiled JVM bytecodes. This means we can compare side by side a snippet of Kotlin code and the corresponding JVM bytecodes the same Kotlin code compiles to. This feature is located in the “Tools” option in the IntelliJ IDE. By opening the Tools option list we can further locate the “Kotlin” option to see the “Show Kotlin Bytecode” option. 

The figure below is an example that shows what we would expect to see the side by side comparison between a suspend function in Kotlin and its corresponding bytecodes on the right. 

Figure 2: The left side is the Kotlin code and the right side is the compiled JVM bytecode. For anyone who is really curious, this is the JVM bytecode spec.

After seeing the JVM bytecodes of a Kotlin function we can rely on IntelliJ to de-compile the bytecodes back to Java. With the bytecodes in the above example (Figure 2, right hand side), the de-compiled Java code looks like below (figure 3):

Figure 3: The above screenshot is the Java-equivalent code from decompiling the bytecode. It shows that a suspend function is a static method.

Ignore the details of variable names (they are programmatic and hard to read, because they were generated in a programmatic way), and for now let’s focus on the following aspects of the aforementioned code snippet:

  1. The code uses labels: Java supports goto statements through the use of labels. We will soon see that scopes and labels are used extensively as the way to implement coroutines. Now we know a Kotlin suspend function (the static aspect of a coroutine) will be compiled into a static JVM method.
  2. One label is defined as an int variable: Using an int variable label is very important because it serves as the key to a switch statement for a coroutine to resume back to where it left off.
Figure 4: shows the beginning of the control flow switch code block. The Label variable will be passed around as the “next code block pointer” to resume. The Kotlin compiler at compilation time will figure out all the suspend call sites and reorganize the code (in a generic code generation way) so that each number will map to a suspend call site.

From the above example we are making several observations regarding how the code is written and structured:

  • The smallest execution unit is the code between two suspend calls within a method. If we have a method where we call 50 suspend functions, logically Kotlin considers this method to have up to 50 units of execution scheduling (as the upper bound).
  • Case 0 is special. It corresponds to the beginning of a method up to the first call site of a suspend function. This implementation detail perfectly explains the documentation on the Kotlin website: “… The Dispatchers.Unconfined coroutine dispatcher starts a coroutine in the caller thread, but only until the first suspension point…
  • Notice this variable: Object var8 = IntrinsicsKt.getCOROUTINE_SUSPENDED(). We can see that a suspend function can either return IntrinsicsKt.getCOROUTINE_SUSPENDED() or the actual result of the function. If the return value is the former case, we know the suspend function we are calling is not ready, and we need to suspend the current function and return.
  • Notice the variables: L$0, L$1, L$2…. These are the states to save for local variables. When the coroutine resumes, these variables will be restored with the saved values. Also, Kotlin captures all necessary local variables statically at compile time and makes them member objects of the continuation class.

Now let’s see another more complex example:

Figure 5: an example of a complex control flow switch code block with nested labels.

Notice the break labelxx statements and similar try blocks. The innermost scope has a switch statement, which is the control flow statement we discussed before as the jump table for suspend code blocks. The Kotlin compiler programmatically generates numbered label scopes for suspend code blocks. In the above example, if label == 1, it breaks off to run the try block immediately following the switch block. If label == 2, it breaks off to run the try block immediately following label477’s block, and so on.

Now we can see that with the control flow switch statement, local variable capturing, and labeled code scopes, Kotlin has implemented the control and data flows of a coroutine in JVM.

Before concluding this section, let’s examine the following code snippet:

Figure 6: The upper half is the decompiled Java code for a coroutine’s suspend function call. The lower half is the bytecode for the if-return block. The above logic is as follows: if the call to the suspend function returns suspended, then we return from this coroutine.

This file in Kotlin’s compiler generates the above bytecode:

Figure 7: The Kotlin compiler implementation that generates code in figure 6

Introducing Kotlin’s standard library

Kotlin provides a set of out-of-the-box classes and utilities to make app development easier. Kotlin’s classes and utilities are wrapped inside the Kotlin standard library. In this section we will examine a few classes to illustrate how they facilitate development with coroutines.

We will use the following code (which is a Kotlin async code block) to see what we could find out:

Figure 8: An example of creating a Kotlin coroutine through an async code block.

Then it leads us to the Builders.common.kt file.

Figure 9: The implementation of function async in the standard library.

There are a whole bunch of classes that we don’t know about yet in the above figures. Let’s do some more digging to understand the functionalities of each class in the above example:

  • CoroutineContext: We see this almost everywhere throughout the code bases. It’s used for passing some context and data as key-value pairs. What’s interesting is the public operator fun plus(context: CoroutineContext): CoroutineContext method. Now we know why we sometimes do “context + something” when we launch new coroutines. The “+” is just an “operator overloading” defined for CoroutineContext.
  • CoroutineStart: This determines how and when a coroutine should start. Ignore other cases (we only occasionally or rarely do), and focus on DEFAULT. Later the file defined the “invoke” operator overloading. In Java/JVM “invoke” means “calling”. This means CoroutineStart essentially is a “Functional Interface”. It in turn will call startCoroutineCancellable of the provided block, which is of type suspend () -> T. Recall the Language section where we use the same trick to see what Kotlin does with it. Below is the result:
/** A function that takes 1 argument. */
public interface Function1<in P1, out R> : Function<R> {
    /** Invokes the function with the specified argument. */
    public operator fun invoke(p1: P1): R
}

It’s a functional interface with one input parameter. Of course, every suspend function under the cover will have one extra parameter, which is the Continuation object.

  • Deferred: From tracing the source code we know it’s a subclass of Job. And this “Deferred” class has a result. From this observation we now know that an “async” call does a bunch of bookkeeping and finally creates a coroutine and dispatches a Deferred Job with a result.
  • Job: This file is rather big and complicated, but it’s well documented. It defines the state machine of a job. The description of this state machine  is “... A background job. Conceptually, a job is a cancellable thing with a life-cycle that culminates in its completion.” A few things worth noticing:
    • A job only completes when all children jobs are completed.
    • A child job’s cancelation will cancel the parent job.
    • Cancellation is such an important concept that Kotlin models it natively and weaves this concept throughout its implementation for coroutines.

We have looked at a bunch of Kotlin classes for async and coroutines. Here are a few takeaways:

  • Whenever in doubt, we could just look at the implementation given that the core classes are not too many and it’s fairly straightforward to understand what Kotlin does under the covers.
  • Coroutines have their code represented as static Java method/classes in bytecode in compilation time. Coroutines have their runtime data structures represented as Jobs along with contexts, which are just a bunch of JVM objects which are object oriented pointers. Coroutines are indeed cheap (compared to creating tons of threads which in turn create the same number of Linux threads).
  • Coroutines, at the end of the day, are just a bunch of jobs getting scheduled and executed at some point in JVM. As long as we keep that in mind, from a programming model perspective it’s very similar to thread programming.

Scheduling coroutines

So far we figured out how JVM understands a coroutine so it can run a coroutine, suspend a coroutine, and resume a coroutine. We also figured out how a coroutine is represented with core classes in the Kotlin standard library. Now let’s look at how a coroutine (or a Job) is actually getting run in JVM.

There are quite a number of ways to run coroutines. The official documentation has a good high-level overview. We will take an implementation perspective. Here we examine three types (in fact there could be more, but this article is not intended to be exhaustive):

  • Event loop-based: A thread runs a while true loop looks for jobs to execute in its queue. Such an event loop also takes care of scheduling delayed jobs (e.g. scheduling to run in the future given a delay time). Usually when we do runBlocking or launch(Dispatchers.Unconfined) we end up submitting a coroutine to an event-based dispatch for execution.
  • CoroutineScheduler: This work stealing scheduler is used as the default dispatcher. The dispatcher spawns a pool of worker threads with each thread attached to a designated CPU core. Each worker maintains a local job queue and in addition there is a global queue. Jobs (coroutines) submitted by a worker will be added to the worker’s local queue. And workers can steal other workers’ jobs in their local queues to work on so that, on average, if there are P processors and N jobs the workload per processor is expected to be N/P. Golang’s scheduler is similar to this design, which is commonly referred to as m:n scheduling.
  • ExecutorCoroutineDispatcher: This is the most used thread type throughout DoorDash’s codebases. Essentially it wraps around a plain Java Executor. Each submitted coroutine is also wrapped as a Runnable, a type expected by the Java Development Kit. The per-thread affinity is not preserved, because when a coroutine returns due to suspension, the next scheduling will be added to the thread pool’s job queue. And every thread has a fair chance to grab it (most common thread pool implementations).

Whenever a coroutine is up for execution by one of the dispatcher types, the following code will be run (in normal use cases):

  1. A DispatchedTask will be used to represent a coroutine job in the context of a Dispatcher. This is a subclass of kotlinx.coroutines.scheduling.Task, which in turn is a subclass of Java’s Runnable.
  2. The DispatchedTask’s overriding run() method does all the magic for running a coroutine, including:
    1. Bookkeeping to prepare for coroutine state to pass into the continuation
    2. Running the coroutine code block (recall from the Language section how that’s done) with the states and contexts to pass to the code block
    3. Checking return results. And, if there is more work, dispatch (e.g. submit to the worker queue) again the next call for the coroutine with the newly obtained context from the return result. This way at some point in the future the dispatcher’s thread(s) will pick up the new work from the queue and run it.

Before concluding this section, a few points about scheduling:

  1. Event loop-based dispatchers will be frequently referred to in the mobile app development (e.g. main thread). We need to be careful not to schedule anything CPU-intensive (or blocking the event loop thread).
  2. The default dispatcher is a general purpose dispatcher which is optimized for CPU-intensive computation with no-blocking. The reason is that default dispatch only has a small set of worker threads (number of cores) blocking any of these would significantly hurt the throughput.
  3. Executor dispatchers are more tolerant to misuses. But in that case the general wisdom of Java concurrently/threading/performance will apply. Properly sizing the thread pool is always a good approach toward more predictable Kotlin service performances.

Conclusion

We have examined Kotlin coroutines from multiple angles through a combination of source code reading and bytecode/Kotlin compilation/decompilation exercises. Now we know that coroutines are resumable tasks that are lightweight to create and schedule. We also know when and how a coroutine suspends during its execution. Finally we have a better understanding of what mechanism is used for scheduling the execution of coroutines. These deeper understandings of coroutines should guide us writing high performance code, or simply, better code in Kotlin.

DoorDash has rich image data collected by Dashers, our delivery drivers, that we use in a number of use cases. We can use this wealth of data for a number of things, including to check whether pizza bags are properly equipped, stores are closed, or catering has been set up, among many other possibilities. With the large volume of image data that comes in daily, it’s impossible for humans to examine images manually and confirm the information associated with them. It is therefore critical to create an automated, responsive, and reusable solution to extract important information from the images to advance use cases across myriad domains from logistics to fraud. 

In the past, DoorDash relied on third-party vendors to analyze incoming image data in a slow, expensive, and largely unscalable process. Our current image recognition solution described here enables us to spin up new use case models quickly, efficiently, inexpensively, and at scale.

In-house image processing sets new standards

Creating a DoorDash-centric image recognition solution mitigates multiple concerns created while working with third-party vendors, including:

  • Seamless integration with existing in-house image data sources and services
  • Fast analysis and data wipes of sensitive consumer information which privacy regulations require the company to jettison within a matter of days
  • Fast data transfer to keep use cases fresh and manage additional privacy concerns
  • Reduced costs and rapid scalability to manage growing internal demands as DoorDash grows its business lines

From an engineering perspective, an in-house solution is straightforward to maintain and can easily be extended and improved with more advanced machine learning models, a faster data pipeline, and more robust support across multiple services.

A light-weight solution keeps us nimble

Once the decision was made to build an in-house solution, we sought a balance between the traditional heavy-handed team approach to building sophisticated models and a streamlined rapid iteration solution. Typical image recognition solutions require plentiful labeled data to feed into the model and comprehensive work conducted by data engineers to bring the model into production. 

At DoorDash, however, we value fast iteration and immediate outcomes (it’s in the name after all!), so we opted for a lightweight solution that could be brought up to speed fast. Rather than putting time and resources into over-complicated model tuning, we have adopted transfer learning, leveraging pre-trained computer vision models with our own labeled data for model training. Those models are then integrated into daily extract-transform-load, or ETL, jobs for real-time systems to test the effectiveness and online accuracy.

Our solution: Build a deep neural network pipeline

Our deep neural network pipeline (as shown in Fig. 1) evolves through the following steps: 

  1. We train image recognition models with limited labeled data, using ResNet as a backbone network. We balance the data set by selecting images from evenly distributed classes while also applying image pre-processing and data augmentation.
  1. We productionalize models into the business quickly, regardless of the use case origin. Depending on the case, we leverage daily ETL or a real-time prediction service to host the trained model and save outputs to tables that can be used by downstream services.
  1. We continuously monitor model performance through model tracking dashboards that record performance and predict job status. Because some data is time-sensitive, we maximize use of the raw images to extract information quickly and efficiently.
Fig. 1. In model building, historical image data with labels are used to train a DNN model, then performance is evaluated by stakeholders to satisfy accuracy requirements. Ultimately, the model is productionalized by ETL or a real-time prediction service to generate prediction results to be consumed by downstream services.

How to select appropriate business problems 

As the business grows in both depth and breadth, new use cases arise broadly from many different teams who want to use the system to solve their problems. Although the pipeline moves quickly toward solutions, it’s important to prioritize which use cases should be on boarded first. DoorDash has established a few simple questions and rules to identify the most compelling cases:  

  • Does the use case have a significant business impact for the company?
    • Not all interesting business problems are equally important. Use cases that can generate profit or reduce costs become the top priority. For example, we use this solution to recognize pizza bags so that our dispatching system can assign pizza orders to those Dashers who have suitable equipment, leading to better consumer experiences. 
  • Can the problem be solved using an image classification model?
    • In some use cases, image data must be combined with other data to enhance the solution. For example, some Dashers fraudulently report a store closure by uploading a fake storefront image and then collecting  half of the delivery fee. Our image recognition solution can compare a proper storefront against the Dasher’s submitted image and use real-time GPS information to discern whether the Dasher is at the correct store location.
  • Do we have annotated data for training?
    • Business partners seeking to use the solution must provide label definitions with real images to facilitate training.

Three affirmative answers will lead to onboarding a new use case, which can be completed within a few weeks’ time. When we partner with an internal business team to onboard a new use case, who needs a deep learning use case, we first run a pilot, including model building and testing. If the partner is satisfied with overall performance, we move the model into full production and feed its prediction data into downstream services.

Identifying the best audiences for light-weight image solutions

Companies eager to incorporate the image data generated from their daily operations frequently are stuck using third-party vendors because they lack a platform and the knowledge to conduct image processing themselves. A lightweight system similar to DoorDash’s can reduce costs, speed problem solving, streamline product integration, and standardize data and use cases across teams.

By developing an image processing solution capable of rapid iterations and quick turn-arounds, companies can avoid bringing on a dedicated computer vision or data engineering team. DoorDash’s lightweight and reusable pipeline is ideal for quickly testing proofs-of-concept with business partners across a variety of functions. In fact, after the first use case took advantage of the solution, three more cases quickly were ready to be onboarded. 

DoorDash is often interested in knowing not only the average effect of an intervention, but also the more granular effect of that intervention on specific cohorts. To estimate such subgroup effects, it is common for practitioners to simply filter experimental data by subgroup and then note the observed difference between treatment and control groups in the filtered dataset. This approach is intuitive and unbiased, but the variance for each segment can quickly escalate. Beyond affecting error size, variance creates additional problems when the sample sizes of subgroups are unequal and we are interested in the groups that are performing best or worst. Because of their larger variances, smaller subgroups will be overrepresented in the tail results, as famously explicated in Howard Wainer’s 2007 American Scientist article “The Most Dangerous Equation.” By failing to account for these issues, practitioners may be constructing false theories of change, iterating less effectively, or mistargeting their interventions. 

To resolve these issues at DoorDash, we utilized a canonical method from the field of Empirical Bayes called the James-Stein estimator (JSE). At a high level, the JSE shrinks subgroup-level estimates toward the global mean in proportion to their variance. The JSE produces better composite predictions than classic segmentation while mitigating the overrepresentation of smaller subgroups in our most extreme results. We’re hopeful that a high-level explanation and a DoorDash case study will help practitioners conduct subgroup analysis more effectively in the face of challenges posed by variance. 

The benefits of subgroup analysis 

It is common to break down experimental results by subgroup. At DoorDash, we will often zoom in and look at distinct consumer, Dasher (our name for delivery drivers ), and merchant groups and their specific results. This partitioning is useful for tracking the impact on important subgroups, for example, local merchants. Segmentation is also often leveraged to identify patterns in the subgroups that deviate most from the mean. These patterns frequently allow us to generate hypotheses around the causal mechanism and inspire iterations geared toward improving the experience for poor-performing subgroups. We also use segmentation to target our intervention exclusively to the subgroups that are estimated to be most positively affected. This targeting can be particularly helpful in these circumstances:

  • When the overall results are significant, we can often make our interventions more efficient by rolling them out to only the most positively affected segments.  
  • When overall results are not significant, we can still frequently find certain segments for whom there is a positive impact. We discuss this in detail in this blog post

Overall, segmentation allows us to go beyond estimating the single average treatment effect (ATE) of an experiment or new feature on the entire use base. Instead, we signal our interest in something deeper by breaking up the ATE into a series of estimated treatment effects that are conditional to a specific cohort. These cohort-specific effects are known as conditional average treatment effects (CATEs). 

The challenges posed by variance for typical subgroup analysis 

An intuitive and straightforward approach to estimating the CATEs involves segmenting experimental data and separately estimating the treatment effect in each segment; it even results in an unbiased estimate. At the same time, variance creates several concerns for this type of subgroup analysis. 

Larger Errors 

First, as the number of subgroups increases, the variance of our CATE estimates will also increase, resulting in larger errors. This degradation follows from what is often called the “most dangerous equation” — the inverse proportionality between the sampling variance and the sample size.

Formula 1

Here, sigma-x-bar is the standard error of the mean (and its square is the sampling variance), sigma is the standard deviation of the sample (and its square is the variance of the sample), and n is the sample size. Additionally, because sampling variance is governed by a non-linear 1/n relationship with the sample size n, each new subgroup that’s further segmented will result in an escalating degradation to the sampling variance — and therefore estimate error — as shown below.

Figure 1: Above, we plot how sampling variance scales with sample size (here the variance of the sample is normalized to 1). You can see that sampling variance goes up a lot more when the sample is cut from four to two than when it is cut from six to four.

Overrepresentation of small segments in extreme results 

Beyond general concerns around error size, variance concerns are particularly acute when: 

  •  Segments are of different sizes 
  •  We’re interested in identifying the groups that have the most extreme results 

Because small subgroups will have the largest sampling variance, they will be overrepresented whenever we look for the groups in the tails (see figure 2 below). 

Figure 2: Above, we plot two sampling distributions around a mean of 0; the small sample has a variance of three, and the large sample has a variance of two. When we focus on the tail results region with a value greater than five, there are many more instances from the small sample than from the large sample.

The law of statistics can often create misleading results when looking for extreme values. For example, education activists were once motivated to champion smaller school size based on the observation that small schools were overrepresented among the highest-achieving schools in the US. However, when studying the problem by looking at the relationship between school size and performance in the whole dataset rather than the highest-performing tail, researchers found there was actually a positive correlation between school size and performance — debunking the notion that smaller schools are better (as illustrated by The Most Dangerous Equation article). This study is not unique; “best” lists of things like cities or hospitals often disproportionately cite smaller entities, failing to account for how higher variance makes these smaller examples more likely to revert to average performance in future observation periods.  

How the JSE mitigates subgroup variance issues 

Fortunately, there is a way to estimate our CATEs while mitigating the variance concerns by using the JSE. At a high level, the JSE shrinks a group of estimates toward the global mean in proportion to the variance of each estimate and a modulating parameter. Formally, the JSE can be written as:

Formula 2

where z is the JSE, y-bar is the global mean, y is the group mean, and c is a modulating parameter that depends partly on the sampling variance of the group estimate. 

A synonym for the “shrinkage” that the JSE performs is “regularization.” All regularization can be interpreted as a Bayesian approach that shrinks coefficients toward some prior value. Widely popular forms of regularization like Ridge and Lasso techniques, for instance, shrink parameters toward zero using the L2 and L1 norm respectively. Stein shrinkage is not just Bayesian, but also a canonical technique from the burgeoning set of Empirical Bayes methods. The JSE is “empirical” in constructing its Bayesian prior from the data at hand; it pools the data and uses the global average for shrinkage rather than using an invariant prior value like zero. 

The JSE addresses issues with traditional segmentation-based estimates of CATEs in two ways: 

When the JSE works best 

Two notes about the expected difference in MSE between the JSE and using subgroup observed averages: 

The second point — that JSE always dominates observed averages for three or more parameters, but only in aggregate — underscores the primary insight behind the approach. If we have to predict a number of parameter values and we only care about the composite prediction accuracy, then there are better ways to predict those values in combination than how we would predict them in isolation. 

For example, if you have estimates of three completely unrelated parameters, such as wheat yield in 1993, number of spectators at Wimbledon in 2001, and the weight of a candy bar, then using the JSE and shrinking your estimates toward the global mean of all three parameters would still dominate using your individual estimates. However, for no single parameter would you expect the JSE to outperform the individual estimate; the dominance is truly an emergent property, existing only when considering the combined prediction accuracy. If we really care about the individual predictions such that we would regret degrading one of our estimates, even if we were successful in improving the combined accuracy of all estimates, then the JSE is not appropriate. 

Using JSE for consumer promotions at DoorDash

DoorDash, for instance, uses promotions to ensure affordable prices for consumers while ensuring they are sustainable. We can model this goal as a formal optimization problem whose objective blends the business’s top-line metrics (like revenue) with bottom-line metrics (like net income). The optimization problem also features various constraints such as price consistency and algorithmic fairness. 

For this use case, we were interested in a particular consumer promotion and we were able to estimate the relevant parameter values through a combination of experimentation, historical data, and simulation. Moreover, we specifically aimed to estimate the parameter values for each and every “submarket,” which is a high-level geographic area. Note that because submarkets are based on geography, they can vary widely in the number of orders they comprise. 

The challenges variance poses for promotion optimization

Unfortunately, our consumer promotion optimization set-up has all the complications of variance previously mentioned: we have a large set of segments — submarkets — which can lead to larger estimate errors for our parameters of interest. We thus needed to improve the composite accuracy of submarket-level parameter estimation to improve the business performance of our optimization. Moreover, we have different sample sizes used for estimation and we’re interested in the extreme values: for instance, we would like to know the most sensitive areas where it’s best to invest in offering the promotions.

Without an approach like JSE, we’d be poised to mistarget our interventions — calling-out and taking action on our smaller submarkets more than our larger submarkets. Note also that one of our constraints for optimization is that we want price consistency; we know that consumers value predictable promotions and there is a cost to frequently changing promotion levels. With naive segment analysis, we’d be poised to change promotion investment frequently in small submarkets because their estimated parameters, like sensitivity, fluctuate wildly. But that would stunt the development of our smaller, often newer, submarkets and keep them from reaching their long-term potential. Given these factors, it’s clear why Stein shrinkage can be applied to this problem space. 

Perhaps most importantly, however, the large variance in small submarkets could have led to suspicious recommendations that undermined trust in the whole system of optimized promotional recommendations. As optimization matures at DoorDash, there is still quite a bit of room for manual operational intervention. A lack of trust in our models can undermine the values of those models, and that certainly would have been the case here. Manual interventions likely would have produced effects that were the reverse of Stein shrinkage, with a high likelihood of improving individual situations — making the recommendations warranted — but a combined performance likely expected to be worse, eating into the large gains we were able to achieve with this optimization. Therefore, to build trust in our recommendations, it was essential we had credible recommendations even in our smallest, highest-variance submarkets. 

Details on Stein shrinkage implementation 

We implemented Stein shrinkage by making a few practical alterations from the ordinary JSE approach outlined above. We started with the shrinkage estimator shown in formula 3.

Formula 3

Here, subscript b represents submarket b, beta-tilde is the JSE, beta-hat is the observed average, beta-bar-hat is the observed global average, var-hat is the observed sample variance, and lambda is a tunable parameter. 

This estimator also shrinks a group of estimates toward the global mean in proportion to the variance of each estimate and a modulating parameter. This method, however, uses the observed variance because the actual variance is unknown. The estimator is also optimized to handle unknown and unequal variances, which fits our use case when estimating parameter values from data.

A note on “sensitivity” and derived metrics

We used Stein shrinkage to estimate a number of different parameters of interest in the promotion optimization. One of those parameters, sensitivity, is actually a formula derived from the difference between groups rather than a metric that could be averaged across the units of randomization. This formulation of sensitivity renders traditional HTE modeling inoperable and complicates the calculation of sample variance. While we could use the bootstrap or delta method to estimate sampling variance of sensitivity, we instead used a simple variance proxy calculated from sample size and fee differences in each submarket as a first pass. 

Hyperparameter tuning for Stein shrinkage

Let’s talk about our choice of a loss function for hyperparameter tuning of lambda. For our use case in industry, we decided the most business-relevant loss function was weighted mean average error (wMAE). We select MAE rather than MSE because there was no particular reason to overweight large errors in this set-up; we’ve observed fairly linear sensitivities and our promotions are ultimately clipped in a fairly narrow range. We then weighted the error in each submarket according to historical delivery volume. Using wMAE, rather than MAE, is common when concerned most with aggregate business impact. 

The results from using Stein shrinkage 

Stein shrinkage improved the wMAE for all of our parameters of interest. For any single parameter, like sensitivity, the gains were moderate; however, summing up all the improvements resulted in a noticeable lift to optimization. This was especially the case because the wMAE improvements were larger among our smaller submarkets, resulting in a better ordering of optimal submarkets in which to invest. This allowed us to avoid mistargeting too much of our limited promotion budget to smaller, more variable submarkets. 

The larger wMAE gain in smaller submarkets was also critical in avoiding the long-term risk of frequently changing promotion levels on our smallest submarkets, which would have deterred consumers and hurt the development of these submarkets. Last, and most importantly, Stein shrinkage allowed us to use the most business-relevant loss function of wMAE while still ensuring that our smallest submarkets had high-quality estimates. By making plausible recommendations in even our smallest submarkets and optimizing for aggregate business results, we successfully built trust in the recommendations, generated large gains from the optimization, and generated excitement for continued use of the system. 

Conclusion

When estimating the treatment effect for different segments, variance poses a number of issues. It increases error size and can lead to a misleading ordering of the most affected segments, with smaller segments exhibiting more extreme effects because of their larger variances. To address these issues at DoorDash while optimizing promotions, we had notable success using Stein shrinkage. Stein shrinkage is a form of regularization that accepts some bias in order to constrain variance by shrinking estimates toward the global mean in proportion to their sampling variance. 

Zooming out, we want to offer two concluding thoughts on Stein shrinkage. Firstly, the JSE actually was the original innovation in using regularization to improve variance at the expense of bias; widely popular shrinkage techniques like Ridge and Lasso were all preceded by the JSE. Despite still being broadly useful, the JSE is not as universally known or taught today as are other forms of regularization. Secondly, regularization and bias-variance tradeoffs are well-known considerations in predictive modeling. But these techniques are not as widely used when analyzing experiment data. By convention, experiment analysis to this day is conducted primarily according to strictly frequentist approaches that aim for unbiasedness. There are almost certainly times this convention is unhelpful, however, and it instead makes sense to minimize the error of our estimates. 

Acknowledgements 

Thank you to the DoorDash Causal Inference Reading Group (including Abhi Ramachandran, Yixin Tang, Lewis Warne, Stas Sajin, Dawn Lu, and Carol Huangci) for contributing to the ideas in this post. Thanks also to Alok Gupta, and Han Shu for reviewing the blog post. Lastly, an enormous thank you to Ezra Berger for the many improvements and iterations on the draft of the blog post.

Today, I’m excited to announce that DoorDash is building an engineering team in the “Steel City” – Pittsburgh, PA. The DoorDash engineering team is expanding quickly, and we’re looking forward to leveraging the technical talent in the area. Our new Pittsburgh team will be focused on core platform technologies that drive our delivery logistics platform and solve some of our team’s largest distributed systems challenges. Our new office location will be opening in Pittsburgh early next year and we plan to bring on fifty new team members by next summer. 

Why Pittsburgh?

Once a city of industry known for its steel mills and manufacturing, Pittsburgh is now home to a vibrant tech scene fueled by world-class research institutions, technology, robotics, and innovation. The city boasts a massive amount of both professional and new graduate talent and we’re excited to become a key part of the local tech community. Pittsburgh is key to DoorDash’s expansion strategy. 

Pittsburgh Mayor William Peduto said, “DoorDash has provided invaluable service to the residents, businesses and economy of the City of Pittsburgh through the delivery of local products to local people and families as well as providing $150,000 in grants to local restaurants earlier this year to help them get through the pressures of the pandemic. We are pleased that DoorDash has announced they will be expanding their local operations and contributing to Pittsburgh’s innovation economy by bringing 50 engineering jobs to the city and we look forward to continuing our partnership.”

Pittsburgh Engineering Teams

Platform Evolution is a newly formed engineering team and will be the first (of many) teams to be located in Pittsburgh. As previous blog posts have discussed, the DoorDash engineering team has been focused on transitioning away from a monolithic codebase to a microservices architecture. This new team represents the next phase in this transformation. In addition to having our product teams focus on the migration, we’ll also be staffing a fully dedicated team. Platform Evolution will be responsible for building the core platform components to enable a seamless migration, while also ensuring we are able to increase capacity and expand to new global markets. As a centralized platform team, our software engineers will have the opportunity to contribute to all aspects of DoorDash’s products and internal services.

If the idea of solving deep technical challenges and being a founding member of a new engineering team sounds interesting, check out our open positions:

With the rise of digital accounts that enable impactful transactions, keeping these accounts secure from unauthorized account takeovers is becoming essential for any online business.  With millions of regular users and the ability to spend money or order food, keeping accounts secure is a top priority at DoorDash as well.

To combat these takeovers while still offering convenient credential-based logins, we have opted to use multifactor authentication to ensure accounts are not the target of fraud. The challenge is figuring out how often to ask for MFA credentials only when the situation warrants it, as it can be an obstacle to a frictionless experience. In this post, we will discuss the general problem and how we found a way to optimize MFA for fraudsters while reducing the friction for real users. 

The security dangers of credential based logins  

Due to the fact that many online accounts ask for credentials, namely usernames and passwords, users are subject to a range of attacks aimed at taking over their accounts. One common way to fraudulently gain access to a user account is with credential stuffing. This is an automated injection of username and password pairs. The logic of these attacks are that many users will reuse usernames and passwords. If credentials are reused on a less secure site, then any leak can make accounts vulnerable on a more secure website. 

Preventing unauthorized account takeovers with MFA 

In order to protect user accounts, DoorDash built multi-factor authentication (MFA) into the app login process. MFA is where we ask the user for another type of authentication to prove who they are. While credential stuffing can make someone seem like the true owner of a DoorDash account, asking for another form of identification can verify if they are in fact the owner. MFA is one of the strongest protections against account compromise because it’s hard for anyone other than the true owner of an account to have credentials and the second form of verification at the same time. 

While it is a powerful tool to prevent fraud, we want to ensure that deploying MFA as an extra layer of protection does not negatively impact our users. Every time someone logs in, we could theoretically ask them to verify their identity with MFA–– but this would add a lot of friction to the online ordering experience and likely turn off customers. Not only is the extra step putting more time between users and making their next order, but poor network connectivity or technical issues can sometimes prevent a good user from accessing their account, which creates a negative user experience. Therefore, we needed to find a way to build a secure yet frictionless way to utilize MFA in the login process. Prioritizing security, we opted for MFA for all, but came up with a framework that exempted MFA from low risk login attempts and continued to optimize the decision engine to reduce more good user frictions.

Providing users with the best experience possible is still important. After we minimized the number of MFA challenges to issue, the next challenge was to ensure MFA code delivery. Users could have trouble passing if they are not able to receive the MFA code or do not receive them in a timely manner. These issues can happen when 3rd party vendors have outages, mobile carriers having network issues cause SMS messages to be delayed or undelivered, or certain mobile carriers inaccurately mark sender phone numbers as spam sender, and block all messages coming from this number. With email delivery, a successful delivery also depends on the recipient’s email server. Many of these factors are out of our control, but we still need a plan when things are not working. 

Features that keep user experiences in mind

There are several key features that helped us to achieve our goal of security with minimum impact to user experience.  First, an automatic MFA when a login event is deemed suspicious. We built a decision engine that makes the decision based on various signals on the login attempt. For the majority of the user logins, we detect that they are initiated by the owner of the account with high confidence, the MFA challenge then is never issued.

The decision engine utilizes multiple signals which allows fine-tuning of the algorithm over time to exclude even more login attempts as trustable. The second feature is to ensure there are backups. Our initial version of the login MFA uses SMS for code delivery by default with email as backup. MFA code delivery with SMS is familiar to most users. It is also a relatively secure and reliable option and simplifies user flow. The email option enables users to still pass the MFA challenge in case of failure with SMS delivery, which can be a big friction as failure to get the SMS message will effectively lock a good user out of their account. These features are the foundation of login MFA, providing security but ensuring a good user experience.

Figure 1. The MFA system relies on a risk decision engine to only apply frictions to risky users.

Multi-Factor Authentication Architecture

A few things on the top of our list to consider when architecting a solution are reusability, reliability, development speed and security. MFA is a very useful common risk challenge that can be applied in other critical events of the user flows in-app. We want to build MFA at login in such a way that the MFA challenge component can be easily reused and integrated with. Therefore we separated the MFA decision engine at login with the MFA service that is only responsible for code generation and verification. Both components are built on existing Risk Platform and the MFA service is a common service that is utilized by many other use cases that triggers MFA challenges. MFA service is built with a highly available in-memory data structure store. 

Figure 2: DoorDash’s BFFs (Backend for Frontend) and MFA service are designed as reusable components for other MFA use cases other than login.

There are several key security features to highlight: 

Locking, to make sure only one instance of MFA is activated  per user session.  

Throttling, throttles requests to prevent spam and attacks and other anti-abuse features, for example, only issues MFA when a user has requested login to prevent an attacker from abusing external endpoints. 

Integrating 3rd party SMS and email sender: Building MFA service internally gives us finer control and more flexibility on the MFA decisioning and features, but we chose to use 3rd party services for delivering SMS and email messages, offloading the standard messaging delivery to vendors with this expertise, allowing us to focus more on the MFA business logic. This sped up development time significantly and the messaging vendors provided excellent reliable solutions in terms of message delivery.

Overcoming code delivery challenges

First, we needed to detect the occurrences of SMS and email sending outages and assess the magnitude of the problem. We worked on monitoring and alerting for MFA code delivery and tracked both the number of MFA challenges issued and the number of MFA challenges successfully verified. By tracking these two key metrics, at any moment we are able to detect the current quality of the MFA code delivery. We also integrated 3rd party message delivery status via web hooks, feedback into our monitoring system to detect issues with the 3rd party systems. 

Next, we created a mitigation plan for when the codes or any of the third party services were down. Having email as the backup already provides some system resilience should SMS messages degrade. Code delivery is a challenge we continue to work on to improve. For example, based on the insights from the metrics, we noticed MFA messages delivered with a toll-free number having higher error rate based on the deliverability of certain carriers and phones. We were able to improve the error rate by 3% by switching the Toll-free number to a number of 10 Digit Long Code. 

Conclusion

With MFA enabled at login, we have built a highly effective protection against account compromise and keeping the friction at minimum. It is always challenging to balance security with usability. What we have built so far is a solution that enables fine tuning in the long term to improve precision on identifying risk during account logins. We also realized login MFA is such a critical feature, that we have spent much of time working on improving reliability and system resilience.

If you are interested in working in creating frictionless, safe and secure ways to access DoorDash’s product and services or building the Identity platform with deep knowledge of our users, please get in touch! The Identity team is hiring, and you can see our open roles here

DoorDash prides itself on offering an internship experience where interns fully integrate with Engineering teams and get the kind of real industry experience that is not taught in a classroom. To showcase some of our summer of 2021 intern’s experience we have put together this collection of intern projects.

Contents: 

Optimizing Two Factor Authentication to Improve the User Experience

By Nir Levin

DoorDash uses two-factor authentication (2FA) as a means of preventing bad actors from being able to log into innocent user accounts and making purchases on their behalf. Of course, this shouldn’t be a surprise – the vast majority of companies have a consumer login which employs some form of 2FA in order to prevent these unauthorized account takeovers (ATOs) from happening. The main challenge we set out to tackle is determining the right level of risk to send out a 2FA. We need a good balance so that fraudsters are blocked but we also minimize the number of good users who experience the 2FA friction.    

How 2FA is utilized

The purpose of 2FA is to allow good users to prove they are the rightful account holder and stop ATOs by fraudsters who don’t own the account they’re trying to log in to. Most commonly, ATOs occur when a bad actor gets hold of a good user’s credentials through methods such as phishing, reusing leaked credentials, or by taking over a users’ email account. In order to prevent unauthorized access, a 2FA request can be sent when the user logs in. The 2FA is typically a text message sent to the user’s device. Because the fraudster only has the user’s credentials and not their device they will not be able to log in and take over the account.  

The problem with casting too large of a net

Theoretically, DoorDash could send a 2FA request every time a user logs in. While this would maximize security it also interrupts the user experience which can cause frustrated customers to stop using the platform. To minimize the use of 2FA requests we only issue them when there is a high risk of an ATO. To optimize catching fraudsters while minimizing sending the 2FA to good users, we needed to update the algorithm for deciding when to issue an 2FA.

Building the algorithm pipeline

The first step in issuing a 2FA request was to gather and analyze user metadata in the production database table using an extract transform load (ETL) job. We created rules which would use the user attributes stored in the database in order to evaluate the risk of each login being an ATO or not. These rules are part of DoorDash’s fraud risk engine. If a user’s login violated these rules, like logging in on a new device for which the ID isn’t already present in our database, the risk engine could react in real-time and issue a 2FA request. There are several login features like the device ID which are fed into the risk engine so that it can determine whether the user is trustable enough to continue without 2FA. The new algorithm introduces more features, which are accessed by the risk engine via supplementary tables built by the ETL job.

Results

According to our experimentation, pushing out our new algorithm resulted in a 15% relative reduction in 2FA requests. In addition, there was a notable increase in users with successful logins and successful deliveries. There was also no increase in chargebacks, which would happen if fraudsters were successfully completing taking over accounts, due to our new algorithm, and placing orders. 

Figuring out how to protect accounts with 2FA while still ensuring a positive user experience can be utilized for many companies looking to have a secure digital login.

Gradually Releasing a New Onboarding Feature With Email Bucketing

By Austin Leung

In order to improve DoorDash’s selection, we need a strong onboarding process. While most merchant onboarding is standard, in order to expand selection we needed to build out a new type of onboarding experience for merchants who do not use Dashers for delivery. This experience would need to be tested before completely going live to all merchants. Here we will talk about how we built a new experience with internal tooling and decided on a bucketing solution to gradually release it to merchants. 

Why we had to move off of Formstack for self-delivery merchant onboarding  

Previously, self-delivery merchants who wanted to complete a self-serve onboarding had to use Formstack, a third-party service similar to Google Forms. While Formstack has served us well to this point, there are major pain points we’d like to address moving forward to improve the onboarding experience:

  • Security standards: Formstack is not SOC II Type 2 compliant which no longer meets our requirements.
  • Loading speed: fairly slow based on negative feedback from users
  • No chat support from sales team: often users get stuck and need help to proceed smoothly
  • Insufficient reliability: DoorDash operators often had to fix issues which was not ideal  

Overall these issues created risk that the technology would be responsible for loss of merchant signups each week, which could hurt the onboarding experience.

The legacy self-delivery Formstack experience merchants would use to sign up with frequent breaks.

To provide a better user experience to merchants  we decided to build this experience ourselves by leveraging the existing Self Serve Merchant Onboarding (SSMO) application. The existing SSMO already had a flow to support marketplace merchants, so this presented the opportunity to adapt it for a separate self-delivery flow.

The new Self-Delivery SSMO experience we are rolling out.

At DoorDash it is not enough to simply build a new feature, we run experiments to prove that the new experience is better and do incremental rollout to maintain reliability. To test this feature we set up bucketing against the legacy solution. If our success metrics such as successful onboarding experiences increased and there were no issues, we could safely scale the new form to a larger share of the overall traffic. 

We use bucketing because it:

  • Allowed us to minimize the impact of any issues, with issues affecting only the experience of the smaller group who was redirected to SSMO
  • Enabled us to rollback all traffic to Formstack immediately, if any issues did occur, mitigating the negative impact
  • Can help us demonstrate the new feature is not only a net positive towards conversion rate, but has better reliability metrics than the Formstack experience

To implement this gradual release, we needed to figure out how fast we would increase traffic to the new solution and how we would power that transition. 

Finding the best bucket key to split traffic

In terms of implementing the bucketing itself, DoorDash uses a library for configuring dynamic values we can pull into our code. There are many capabilities such as specifying the bucket key, the percentage for each bucket, and mapping specific percentages to individual submarkets. One of our main design decisions was identifying the bucket key among the many options. 

Here were our main criteria for selecting our bucket key:

  • Identifiable on each onboarding record so we could use it to redirect to the correct experience.
  • Inputted by the user. In development and testing, we wanted to use the bucket key to forcefully decide what experience we would be redirected to. Our aim was to have an optional substring in the bucket key that would force the session into a certain bucket. This would provide us a stable environment instead of hoping we get bucketed into a specific experience. 
  • Consistent across multiple on-boardings for a merchant. Merchants oftentimes do not complete their initial onboarding, but come back later to start a new onboarding. We want to ensure that each merchant always enters the same experience that they have become accustomed to.
Landing page lead form where self-delivery merchants begin their sign up. We considered using either the business address and the email address provided here as our bucket key. This way we could input certain values to guarantee we would be redirected to a specific experience.

To solve this we considered three options for our bucket key: 

  • Splitting by UUID 
  • Splitting by location 
  • Splitting by email 

The natural option would be to use the UUID of the merchant’s session for bucketing as we generate a UUID for each onboarding. However this violated our requirements: 

  • It was not consistent. Because UUIDs were identified with each session a user could come back and have a totally new experience. 
  • It was not easy to control the traffic. In development and testing, we often intended to enter the new SSMO experience, but would be bucketed into Formstack. Ideally, we would want to ensure UUIDs ending in a certain string of characters would be bucketed into certain experiences. However, because a session’s UUID is automatically generated instead of being inputted by the user, this was not possible. 

Next, we considered bucketing by location as this was inputted as the business address on the landing page lead form. If we used the submarket of the merchant’s location as our bucket key, merchants would always have a consistent experience. However, our concern with using this bucket key was that in order to run a true A/B test, we wanted users to be split without grouping by submarket as a confounding factor.

Instead, we decided to bucket based on emails. Merchants would fill out the lead form with their email and we could then redirect them to the right experience based on that. Using email as the key satisfies all of our initial criteria as it is specified at the beginning of each onboarding, saved in the onboarding record thereafter, and is consistent for merchants who want to restart their onboarding. We could also use the email to force any user that ends their email in a certain string to be placed into a specific bucket. This way we could override the proportion of traffic that is supposed to enter each experience, and proceed with development and testing smoothly. 

How this was a successful bucketing solution 

We’ve been able to successfully develop and test our solution at high velocity, having built and rolled out the new self-delivery flow over the course of 12 weeks. With the easy to use email bucketing, we were able to do thorough testing even with non-engineering stakeholders. Rollout began with all traffic directed towards Formstack and has been ramped up to 10%, 25%, and 50% of merchants entering SSMO self-delivery. As we run our A/B test, we hope to continue to see increased conversion rate and reliability! We’re currently targeting a 29% relative increase in conversion rate and a 14x reduction in downtime.

During this project, we’ve learned that bucketing is best done in a highly controlled environment where you are able to control the different experiences users get. For DoorDash and other data-driven organizations, gradual rollout is a necessity to determine the impact of any new feature against success metrics. Features like self-delivery in SSMO can be adapted if they are successful, ensuring the product is constantly improving. Selecting an appropriate bucket key is an invaluable tool to achieve this, allowing us to rapidly iterate and reliably deploy without interruptions.

Building an efficient lookup system to speed up DashMart receiving times

By Anna Sun

In August 2020, DoorDash launched DashMart, a DoorDash-exclusive store that stocks everything from convenience and grocery store items to custom products, emergency items, household items, and more.

Inventory from a Dashmart warehouse.

DashMart associates collect customer orders from the DoorDash marketplace and pick and pack the orders, and a Dasher comes to collect the order and deliver it to the customer. To make DashMart more efficient we needed to update the DashMart associate UI so that restocking orders that replenish our inventory could be better processed and the DashMart inventory would be updated correctly.

Initially the process of the warehouse intaking shipments for item restocking was manual and not yet automated. This made it slow and prone to human error.

Figure 1: An example of the DashMart associate UI tool which tracked what restocking orders were coming in.

To start the restocking orders intake process, associates previously had to manually search and enter an order ID, which held all the data on what was ordered which could then be added to the DashMart’s inventory. 

To reduce human error we updated the UI tool so that it could search for the necessary order ID in the database automatically, rather than requiring the associate to spend time searching for the ID manually. This feature prevents confusion and human error when accepting restocking orders and adding them to the DashMart inventory. 

We implemented this feature by displaying the facility order data and breaking it down by vendors, using GET APIs. Through these integrations and some frontend tweaks, operators could now use this system to input restocking order IDs and ensure items were speedily added to the inventory.

Figure 2: Operators can now click on any line of the table and it will automatically select that order ID, a process that used to take 2-15 minutes to retrieve.

Considering that 400 to 500 operators utilize this order-receiving portal daily, this change made a huge impact and improved productivity immensely. By saving operators dozens of minutes everyday, we’re making sure that DashMart deliveries get delivered as soon as possible.

Building data dependency discoverability at scale

By Michael Yu 

As DoorDash’s data infrastructure grows to support more than 20 million consumers per month across four countries, maintaining data lineage becomes more challenging. Understanding where specific data comes from, how our systems transform it, and which databases it is written to is critical to keep our logistics platform running smoothly. Addressing this need involved integrating data lineage into a new platform based on the open source Amundsen project.

Problems with discovering data dependencies at scale

Prior to building this solution, discovering upstream data producers and downstream consumers required significant manual investigation. Understanding the context behind data sources is essential for making data-driven decisions. This makes it hard for engineers and analysts to make data-driven decisions as discovering the context behind their data sources requires significant manual investigation. For example, let’s say we have a column in a table that holds the average order volume over the past 90 days. If we see an inconsistency in that metric, the process for discovering the upstream root cause might involve tracking down the ETL job writing to that table, figuring out what SQL queries were run by that ETL job, and finding the source tables of those SQL queries. This process might be repeated several times over if the root cause is not a direct upstream data source, using significant engineering resources. 

Building a data discovery platform

Our new platform, which we call the Data Catalog, indexes all data processes across DoorDash to increase their discoverability. It enables users to quickly find the data sources they’re interested in and view their upstream and downstream dependencies.

The platform targets two distinct areas, dependencies across ETL jobs and across tables hosted by Snowflake, a DoorDash data infrastructure vendor. There are two data sources that we read from to catch the dependencies between ETL jobs: ETL definition code and the Apache Airflow metadata database. Getting the lineage across Snowflake tables is a complicated task as, unlike ETL jobs, there are no explicit dependencies defined. Instead, we have to look at the SQL queries running on Snowflake. Using a SQL parser that ingests raw SQL queries, we can extract the source and destination table information.

Impact

Integrating data lineage in the Data Catalog provides engineers and analysts with a unified means of retrieving all upstream and downstream dependencies of any data source they are interested in. This platform completely removes any need to trace through code, SQL queries, or logs. Ultimately, our Data Catalog paves the way for getting complete end-to-end lineage, allowing anyone to track the flow of data as it moves through dashboards, metrics, services, and ETL jobs.

Reducing database outages by persisting order data from PostgresDB to Amazon S3

By Austin Kim

Amazon Web Services (AWS) advises keeping database tables smaller than 500GB, but the database table that stores all the orders made on DoorDash consistently exceeded this limit. A short-term solution, archiving data older than 90 days, was not scalable, especially as DoorDash grows. Analyzing data usage, we found that over 80% of data came from a single JSON column. Our long-term solution was to persist that JSON column to Amazon’s Simple Storage Service (S3).

One challenge for this solution involved making sure any use cases of the JSON were now fetching data from S3 and not depending on the database. As another challenge, we needed to fetch the JSON from S3 in a way that did not freeze or add risk of failure to the workflows that process orders. Lastly, because this operation will be touching millions of orders made on DoorDash, we need to safely roll it out into production in a way that is secure and not at risk of crashing the workflows that process orders.

The first part of this solution required persisting the JSON to S3. This process begins with one of our microservices receiving a gRPC request that contains the order payload data. Our microservice then uses that payload to create an order object in the database. Typically we store the entire order payload with it, but now we send the data to S3. We then retrieve the S3 address of the file where we stored the JSON and save that link into the database so we can access it in the future. Next, we implement exception handlers and timeouts that terminate and retry the S3 request if it’s stalling for too long, making sure that a freeze in S3 will not freeze the entire workflow.

Our solution reduces the data stored in the order table by more than 80%. This reduction significantly decreases our table’s risk of a database outage and will no longer have to archive orders to resolve this issue. We added a new gRPC endpoint to provide easy access to outside microservices that need the order object and potentially related JSONs that are now stored in S3, making it more efficient and modularized for usages of the order JSON outside of merchant integrations.

Effective implementation of payments in a mobile app requires precise attention to factors such as payment methods, the user experience, and fraud prevention. The critical importance of mobile payments to a business means engineers should take a thoughtful approach, anticipating all eventualities. At DoorDash, we discovered eight essential factors that help create a robust and successful mobile payment system.

For any mobile application, the payment component is key to the customer shopping experience. An easy checkout experience leads to higher conversion and increased sales. In recent years, the use of mobile payments increased significantly across sectors including retail, travel, food delivery, and mobile gaming. 

Infrastructure from credit card companies and mobile operating system makers supports frictionless transactions, but mobile engineers need to do their part as well. DoorDash has processed more than 2 billion orders, so the factors we cover here should be helpful to other companies launching their own mobile payments.

How mobile payments are typically implemented

Before we jump into the lessons we learned, let’s first review how payment components are typically implemented in mobile apps. When making an online order, users submit their card information to a payment gateway such as Stripe or PayPal. The gateway encrypts this information and in turn facilitates the transaction with payment processors. The payment processor talks to the issuing bank and requests approval. The approval then bubbles to the backend, which lets the client know if the payment was accepted or declined.

Figure 1: In a typical mobile payment flow, the app sends cart and payment information to a backend, which seeks authorization for the payment from an appropriate financial institution.

In addition to requiring complicated data flow between internal and external systems, mobile payments are complex for the following reasons:

  • Multiple payment methods (Paypal, Google Pay, Stripe, etc.):
    • Payment methods can be a digital wallet on the device such as Google Pay, or through an external payment gateway, such as Stripe or PayPal. We want to offer as many options as possible to the user, but it’s challenging to enable all the payment options available.
    • Each payment method requires its own complicated integration into the app.
    • Each payment method requires a custom testing strategy.
  • User experience: 
    • Mobile payments need to be as frictionless as possible to enable quick checkouts.
    • Not only does the UI need to work with all payment methods, but it also has to work for new and existing users. Multiply the number of payment methods with new and existing user flows and we have a complex matrix of flows to implement and test.
  • Performance: 
    • The app must remain performant while still supporting all payment methods.
    • We need to ensure the app has all the necessary information to start processing payments as quickly as it can while still being up to date with the information on our servers.
  • Testing: 
    • Testing cannot be an afterthought. We need to design the backend and the app in a way that allows each payment method and flow to be isolated and tested before a release.
  • Fraud: 
    • Anti-fraud measures need to be implemented in any app that includes a mobile payment component.
  • Location: 
    • We need to account for the user’s region before processing their payment to comply with each country’s laws and regulations.

Every app developer is likely to experience these pain points eventually, so we thought it would be useful to share our experience with payments.

What we learned from implementing payments in our Android app

Figure 2: A typical screen for users to add their preferred method of payment 

Plan and design for future payment methods

Our first versions of the DoorDash Android consumer app only accommodated credit cards and Google Pay, so the database structure and models were all stored as “Cards.” This architecture led to developers trying to combine the result of the cards query in the database along with other payment methods such as Google Pay before sending a consistent result to the view model or presenter. We also were experimenting with PayPal at the time and we had to pivot to accommodate it. 

In an earlier version of the DoorDash app, many decisions were made at higher architectural domain layer objects, such as the manager or the view; they should have been made in the repository layers and also persisted the state in the database. In our tech stack, managers are classes that don’t maintain data or state; rather, they interact with the data layer, and then modify and make calculations based on information from it. Because of this, we think of managers as stateless abstractions for encapsulating our business rules. For example, the logic for finding the current payment method was duplicated at the manager layers or higher, when it could have been in a single source of truth at the repository or database layers. To add to the complexity, the concept of credits was introduced later, which we did not initially plan for at the repository or database layers. This caused recalculation of pricing information in several domain layer objects  or view models that could have been avoided by better planning and pushing down the logic into lower infrastructure layers.

This proliferation is why we introduced the notion of payment methods, which can handle payment cards, Google Pay, and PayPal. Broadly, we classify the payment methods into two categories: local payment methods that are part of the device such as Google Pay, and other payment methods that require implementing interactions with a payment gateway such as Stripe.

We should be able to query each of the methods for their associated functionality and use them throughout the app as needed. We included a property that indicates if there are digital wallets on the device such as Google Pay, or if they only exist on the backend. We termed these digital wallets as “local payment methods”.  An example of this is given in figure 3 below where Payment Methods is the abstract class that contains common properties or methods that can be inherited by concrete payment methods.

Figure 3 The Class diagram indicates different types of subclasses (payment methods) that inherit the common functionality and properties of the payment method superclass.

Beware of restrictions and implementation guidelines specific to payment methods

Payment vendors may have specific ways they want to be portrayed in an app. For example, Google Pay’s strict UX guidelines explain how to display its logos and buttons. In addition, Google Pay also requires that it be the primary payment option wherever possible. The app’s assets need to comply with all payment vendor guidelines.

Make the onboarding process easy for first-time users 

We recently rewrote much of our payments stack on Android. When doing this, we realized that most first-time users do not have payment methods set up. The app wouldn’t let them check out and instead showed an error. Users didn’t know what to do when they got that message, so we had to redesign the flow to onboard new users swiftly. One suggestion here is to use the local payment method on the device, such as Google Pay, because it lets users add a card when they initiate the flow. This means the users don’t need to have a card on file with the app to make the payment.

Plan for consumers in different countries or traveling consumers

Payments usually can’t be implemented in a generic way that scales worldwide. Each country typically has its own accounting methods. For example, if a consumer is registered in the U.S. but travels to Canada and orders from a restaurant, there are technical, legal, and accounting implications for the company.

Also, some payment methods might need extra verification or information in other countries. 

In such cases, we have to make sure that the publishable API keys (that are meant solely to identify an account with Stripe) are country-specific and ensure we fetch them based on the consumer’s location. Doing this also eliminates any accounting issues or tax issues that might arise as a result of incorrect billing.

Security and fraud

Most businesses aren’t prepared to deal with mobile fraud. Fraudsters try to find bugs or loopholes in each new app that gets launched and can use a variety of methods to game the system. We have an in-house fraud detection system that presents the user with additional verification checks when it suspects an action — such as checkout, login, or profile edit — might be fraudulent. These verification checks are designed to be very difficult for fraudsters to pass but easy for well-intentioned users. Our in-house fraud detection systems consist of machine learning models and rules engines that are constantly being updated to keep up with emerging fraud vectors. 

Storing API keys or secrets on the device is a bad idea and should be avoided. The best way is to get keys from the backend. This method comes with its own challenges, however, because the app would need to cache API keys or secrets and have logic in place to invalidate them and fetch a new key when needed. It’s also important to be careful that the API keys are retrieved at the start of the app and have appropriate retry logic in place so payments on the app don’t fail for a user.

Plan for testing

Most payment providers such as Google Pay or Stripe have test API keys and live API keys. The idea is that the test keys are used to send transactions to a sandbox environment (with no fees incurred) while the live keys are meant to be used on production. Ensure that the backend and client both accept and work on these test keys as well as the live production keys.

The app needs to be in a state where test tokens that represent sensitive card or bank details and test transactions are accepted by backend systems. All major payment processors offer this functionality with some additional setup needed. It’s also crucial to test the build by releasing it through the Google Play Console’s Test Tracks. Signing can affect how Google Pay functions. Google Pay offers a test mode that developers can set up in their apps.

Plan for performance

It’s absolutely critical to keep an app performant while it processes payments. We learned that caching the payment methods and cards hastens the checkout process for a consumer because there’s less waiting for payment information on the cart and checkout screens. This has to be done with care and must account for numerous error cases where the backend and the device may be out of sync. Performance monitoring is also critical; it’s important to know how users interact with payment flows in the app and when those flows break.

For our Android app, we rely on caching of most of our payment information and ensuring that when users start or use the app we have the most up-to-date payment information on file. Payment information is not only required on the final checkout, but also throughout the app flow to calculate benefits at the order cart screen and show items in the cart and their final cost, including credits and benefits.

Add lots of telemetry

Telemetry, or tele-metering, is automated remote measurement and data collection.

Telemetry collects readings and sends useful information that helps monitor the health of features and lets us know if the app is truly serving our business goals. If users are stuck or crash somewhere in the app’s flow, metrics will reflect that information. Telemetry contains events, which are human-readable verbs or actions we want to track. These typically represent some action that the user performed along with some metadata for that action, such as when the user selects a different card or when there’s an error as the user tries to pay.

When we rewrote our payments stack on Android, we could see that consumers were running into errors trying to pay. However, we didn’t have enough data on the flows that caused these issues. We added additional telemetry to the user payment flows to detect first-time users, how many payment methods they had, the type of device used, whether Google Pay was set up with an existing card on file, and similar issues. We also added telemetry to record payment failure reasons, such as invalid card, network errors, and fraud check errors.

Payment flows can be tricky to debug if they don’t work properly in the wild. Instead of just sending generic telemetry such as “payment failed,” the system should include as much information as possible, including such things as error codes from providers, device information, or any diagnostics that can help to identify the state of the app when it failed. Be careful not to include any personal identifiable information (PII) or any payment information that could be compromised by an attacker.

Conclusion

Successful mobile payment implementation is critical to business success. If users can’t easily make payments through an app, they will be denied a company’s services and likely will seek out a competitor. Implementing mobile payments is extremely challenging because of such factors as integration issues, security, testing, and performance. But getting mobile payments right from the start can make or break a new business. By sharing our experience, we hope that newer developers will be able to plan ahead for such challenges and ensure that their payments are integrated correctly.

As an orchestration engine, Apache Airflow let us quickly build pipelines in our data infrastructure. However, as our business grew to 2 billion orders delivered, scalability became an issue. Our solution came from a new Airflow version which let us pair it with Kubenetes, ensuring that our data infrastructure could keep up with our business growth.

Data not only powers workflows in our infrastructure, such as sending an order from a customer to a restaurant, but also supplies models with fresh data and enables our Data Science and Business Intelligence teams to analyze and optimize our services. As we grew to cover more than 4,000 cities, all the data became more complex and voluminous, making orchestration hard to manage.

Managing data in our infrastructure to make it usable for the DoorDash teams who need it requires various pipelines and ETL jobs. Initially, we used Airflow for orchestration to build data pipelines and set up a single node to get started quickly. When scalability became an issue, we looked for another orchestration solution.

The open source community came to the rescue with a new Airflow version adding support for Kubernetes pod operators. This solution was perfect for our needs, as we already use Kubernetes clusters and the combination scaled to handle our traffic.

How Airflow helped orchestrate our initial data delivery

To contextualize our legacy system we will dive into how Apache Airflow was set up to orchestrate all the ETL’s that power DoorDash’s data platform. Apache Airflow’s platform helps programmatically create, schedule, and monitor complex workflows, as shown in Figure 1 below the DAG gets extremely complicated. It provides an easy-to-read UI and simple ways to manage dependencies in these workflows. Airflow also comes with built-in operators for frameworks like Apache Spark, Google Cloud’s BigQuery, Apache Hive, Kubernetes, and AWS’ EMR, which helps with various integrations. When we began using Airflow for scheduling our ETL jobs, we set it up to run in a single node cluster on an AWS EC2 machine using Local Executor. This configuration was easy to set up and provided us with the framework needed to run all our ETL jobs. While this was a great place to start, it did not scale to meet our business’ continued growth.

Figure 1: Airflow is able to handle the kind of ordering complexities which would otherwise be impossible to schedule correctly. This diagram demonstrates how complex our DAG can be.

The challenges of scaling ETL pipelines 

DoorDash has significant data infrastructure requirements to analyze its business functions. These analytics cover everything from product development to sales, and all depend on getting data from Snowflake, our data warehouse vendor. Our data infrastructure powers thousands of dashboards that fetch data from this system every five to ten minutes during the peak hours of usage. 

These ETL pipelines, depicted in Figure 2, below, ensure that data for analysis is delivered accurately and in a timely manner. Many of our ETL jobs run in Airflow, and about a thousand of them are very critical, high-priority jobs affecting business-critical functions. In addition, the number of ETL jobs we host grows everyday, threatening the reliability of our data orchestration pipelines.

Figure 2: Airflow is at the center of our data pipelines, which becomes problematic if it cannot scale to meet our organization’s growing needs.

Scaling our Airflow setup

Our original Airflow setup ran on an AWS EC2 instance, making it a single point of failure, hampering our system’s scalability. If there was machine failure or other issues with the EC2 instance our only recourse would be to replicate the whole setup on a new machine, which was not an easy or reliable alternative. It was also difficult to scale the EC2 instance dynamically for resources, causing performance issues due to CPU and memory limitations. The lack of fault tolerance and the scalability issues in our Airflow setup were not acceptable, as they could lead to outages where data was not available and important business decisions and ML models would be disrupted. These outages could also impede some of our critical data analysis, slowing the team’s productivity. 

We had to build a distributed setup to make Airflow more scalable. A running instance of Airflow has a number of daemons, including a web server, scheduler, and workers, that work together. In a multi-node Airflow setup there is a node which has a web server and/or scheduler, and a group of worker nodes. Setting up daemon processes that are distributed across all worker nodes and use one of the RemoteExecutors makes it very easy to scale the cluster horizontally if we can add more workers. Although it’s a common industry practice to use Celery, a distributed task queue, in a remote setup, we found an option to set up Airflow on Kubernetes. As our infrastructure ecosystem runs on Kubernetes, this solution made the most sense as this helps with standardizing deployments, access controls, and monitoring etc.

Using Kubernetes for Airflow 

The Kubernetes Executor, introduced in Apache Airflow 1.10.0, can run all Airflow tasks on Kubernetes as separate Pods. The difference between Kubernetes executor and the KubernetesPodOperator is that KubernetesPodOperator can run a container as a task, and that container will be run inside a pod on a Kubernetes cluster. KubernetesPodOperator can be used with any type of executor, including Celery executors and Kubernetes executors. 

At DoorDash, we have Airflow workflows ranging from ETL transformations to Data Science pipelines. These workflows might use different configurations that have different resource needs, or trigger tasks that run in different languages or different versions of the same language. For such varied use cases KubernetesPodOperator provides more flexibility compared to other executors as it will run a container which can encapsulate these varied configuration requirements.

The Kubernetes Operator uses the Kubernetes Python client to generate a request that is processed by the API server. Pods can be launched with defined specifications. It is very easy to specify what image has to be used, especially with options like  environment variables and secrets. Logs can be gathered locally to the scheduler or to any distributed logging service used in their Kubernetes cluster. Using Kubernetes, Airflow users now have more power over their run-time environments, resources, and secrets, basically turning Airflow into a more dynamic workflow orchestrator.

How did we do this migration?

To get things onto Kubernetes we took the following steps:

  • Containerized ETL code
  • Migrated Airflow scheduler and web server to Kubernetes

Containerizing our ETL code

The first step to move Airflow onto Kubernetes was the process of containerizing all our ETL code. To be able to run our code on Kubernetes, we first had to create a Docker image. We used Puckel’s Airflow containerization image and customized it by adding our system files and packages. Credentials were then passed to the Kubernetes Pods using Kuberenetes secrets. With our ETLs containerized, we could easily run our code inside the Kubernetes Operators. So we just need to reconfigure our Airflow setup to use Kubernetes operators. 

Migrating the Airflow scheduler and web server to Kubernetes

As discussed above, two main daemons for Airflow are the scheduler and web server. For better fault tolerance and isolation, we separated the scheduler and web server into two Pods. We used a docker-compose file to manage two containers. After the two containers spun up and Airflow DAGs ran successfully, we moved to the next step, deploying the containers to our Kubernetes cluster. For continuous deployment, we need to manage and store our Docker images. Because our cluster is set up on AWS, we used the Amazon Elastic Container Registry (ECR) for storing these images. 

To implement our ETL jobs using Kubernetes Operator we initially decided to start with jobs that were showing issues related to resource constraints. These jobs did not have special environment requirements so we used a common base image and then installed any additional requirements for that job. We still run some small jobs which don’t require significant resources using a local executor, but eventually every job will run in a different Pod. 

This new setup enables us to meet all our Data team’s requirements. For example, whenever we get a new requirement from one of our data customers we need to ensure that their environment is saved and easily accessible. We store this requirement for resourcing in our jobs metadata table, and when we need to execute we can easily access the requirements and use it to spin up a new Kubernetes Pod. The only thing that we need to watch out for are the large image downloads that can cause timeouts, which can be solved by increasing the startup_timeout_seconds variable for the Pods. 

Figure 3 and figure 4 depict the memory available on the Airflow scheduler pod. Before we started using the KubernetesPodOperator, available memory for the scheduler was hitting 0 causing many ETL jobs to fail. After completing our migration, as shown in figure 4  the available memory continued to stay above 50% and jobs finished much faster as they were not competing for resources.

Figure 3: Available memory issues before we had Kubernetes Pod Operators caused outages and failed ETL jobs 
Figure 4: Higher available memory for scheduler after Kubernetes Pod Operator prevents outages.

Results

We got a lot of benefits from moving our Airflow setup to Kubernetes. Dockerizing helped us make our systems easier to run in this new setup. We now have more scalability and better resource utilization compared to using a single Kubernetes Node. The new system is helping us onboard 10 to 15 new ETL jobs per week without having to worry about how resources will be allocated for them. This setup on Kubernetes can be scaled by adding more nodes to ensure this growth is sustainable. With improved resource utilization ETL jobs are running faster and we are able to run more jobs concurrently, ensuring we meet our data availability SLA for our users. Additionally, new kinds of jobs are easier to integrate if they have different environment requirements. For example, we had a job that needed a specific version of Python and we were able to run it with a custom image and environment. 

Conclusion 

For companies that are starting their data journey, managing data pipelines with Airflow is a great choice but it needs to be set up in a scalable way using distributed execution. DoorDash started with a simple Airflow set up but this became a bottleneck with our growing business and data needs.We looked for options to mitigate and KubernetesPodOperator turned out to be an excellent solution/choice. Running our orchestration on Kubernetes helped us standardize deployment, monitoring, and access controls while supporting a more customizable workload reliably. For companies that are struggling to orchestrate data pipelines with a variety of environments and resource requirements, Airflow with Kubernetes Pod Operators is a great solution that provides scalability and dynamic setup to run a variety of workloads. 

Acknowledgements:

Thanks to Sophia Rong, Ian Schweer, Si Li, Satya Boora,  and many other data infra engineers for their contributions and in making this a successful project. Additional thanks as well to Sudhir Tonse and the DoorDash Compute team for their support.

In our real-time delivery logistics system, the environment, behavior of Dashers (our term for delivery drivers), and consumer demand are highly volatile. Because small changes to the decision-making process of matching deliveries to Dashers can cause a cascade of different assignment decisions, it is difficult to determine the expected outcome of any algorithm iteration or product change. All of this makes it hard to determine the impact of any change via offline sizing or analysis. On DoorDash’s Assignment team, we adopted an experiment-driven framework to determine the outcome of any change with scientific precision and run this analysis at scale. 

Figure 1: By improving our experimentation platform our team has increased  the number of experiments to over 100 a month. 

Because experimentation drives our product development, ramping up our experimentation velocity is critical to sustaining the growth of our business. The Assignment team has been able to grow experimentation volume by over 1000% in the last three years (Figure 1). At the time of writing, we run about one thousand experiments per year, including 30 concurrently running switchback experiments, which make up to 200,000 QPS of bucket evaluations. We will discuss the challenges we faced initially and the characteristics of the system we built to scale our experiments.

The challenges inherent in scaling experimentation

Behind the hypergrowth of ramping experimentation, we have overcome a variety of challenges and made improvements over time. The challenges we faced include: 

Failure aversion

In data science, a field with many high-achieving individuals, there is an aversion to failure. A team that does not celebrate failure and the lessons learned from it will likely be less productive. At DoorDash, we accept failure, as 95% of experiments are bound to fail initially. Therefore, we needed to build a culture that would embrace failure so we could learn from mistakes and improve on each iteration. 

Lack of an effective decision-making process

Large teams make the process of reviewing experiments at scale challenging. At DoorDash, we needed a way to manage 25-plus weekly experiments during short meetings with many stakeholders. 

Creating effective experiment methodologies is complex

Experiments with strong network effects are difficult to analyze and set up. Because experiments might affect Dasher behavior and the low sensitivity of switchback experiments, we needed statistical methods and an experimentation design that allowed us to run many concurrent experiments, measure network effects, and use variance reduction to speed up experiments

 Ad hoc analysis doesn’t scale

Before platformization, experiment owners used one-off SQL, Python, and R notebooks for experiment analysis, which were prone to human error and took a lot of time to build. We needed an experimentation platform where we could automate the process of setting up a new experiment. Not only would this help us standardize our experiment results, but would also make analyzing experiment data much faster.

Stay Informed with Weekly Updates

Subscribe to our Engineering blog to get regular updates on all the coolest projects our team is working on

How we scaled our experimentation 1000%

In order to scale our experiment capacity we focused on building an approach with the following four attributes: 

  • Operating with a fail-fast to learn-fast culture 
  • Building a scalable experimentation process 
  • Using optimal statistical methods
  • Building a customizable and automated experimentation platform and tooling

Let’s go through each pillar to illustrate how these all came together to increase our experiment capacity.

Developing a fail-fast to learn-fast culture

At the heart of implementing effective experimentation is building a culture that has the right mindset for success. Often experimentation is bogged down by members trying to use experiments to validate their point of view rather than using the data to help them better understand the problem space. To build this culture, we emphasized the following values to ensure our team focuses on what’s most important when running experiments: 

  • Failing fast and learning fast
  • Operating at the lowest level of detail 
  • Having intellectual honesty and humility

Failing fast to learn fast

In order to facilitate rapid learning, we must accept that failure is common. As a team, we should embrace and expect failure, under two conditions: 

  • We should always aim to fail fast 
  • We should try and fail forward, and learn from every failure so that each experimental hypothesis is better than the last one

By embracing these conditions we aim to get a signal as fast as possible and turn off experiments as soon as we collect enough data to conclude what happened and execute the next steps. As we enable ourselves to fail faster we can learn faster and reduce the time it takes to get more impactful results.

Understand the problem space at the lowest level of detail

At DoorDash the single most important input into our product development is an improved understanding of our problem space. Every day we seek to better understand the millions of deliveries completed per day, the meaningful differences across delivery types or regions, and the areas where DoorDash logistics currently falls short.

Experimentation allows us to do all of this. When we want to learn something, we form a hypothesis, test it, and then analyze where we were wrong and where we were right. Most experiments do not succeed in improving our dispatch engine, but they all build on our detailed understanding of our system. Any improvement of our experimentation approach improves our understanding of how logistics work.

Encouraging Intellectual honesty and humility

Learning quickly through experimentation can be a humbling experience: a good week often reveals that our team was completely wrong about a number of past assumptions. It is not uncommon for a new experiment to invalidate a message we were sharing externally only a week prior. Due to the nature of our work, assumptions are constantly changing, leaving little room for perfectionism or fear of failure.

Those of us who have worked on the Assignment team for a while have come to expect this: today, we are wrong about many things, we just don’t know what they are yet. In our experimentation process, it’s important to be able to let go of assumptions. When the data tells us something counter to previously held notions, we give the data an honest read, and change perspectives accordingly.

Building a scalable experimentation process

Our experimentation process has scaled massively over the last three years. In 2018, we’d run around ten experiments during a typical month. In June 2021, we ran over 100. In order to ensure these experiments are trustworthy at our rapid speed, the Assignment cross-functional team has been iterating and optimizing the experiment launch and review process over time and built improvements like: 

  • Standardized experimentation metrics 
  • A two-filter system 
  • Weekly experiment cadence 

Standardizing experiment metrics and shipping criteria, in advance

Well-defined metrics and standardized shipping criteria are critical to running a high-velocity process. We have three categories of these metrics: goals, guardrails, and diagnostic metrics.  

  • Goal metrics are the North Star the team strives to improve week over week (specifically, the Assignment team looks at Dasher active time per delivery, and delivery duration times).
  • Guardrail metrics are metrics that we do not actively seek to improve but want to ensure do not degrade.
  • Diagnostic metrics are input metrics that help each experiment owner interpret behavioral changes of the system to iterate their experiments. For example, the delivery duration can be broken down into smaller components (e.g. the Dashers’ travel time to the store and wait time at the store) to help the experiment diagnosis and investigation.

Every type of metric is calculated using a centralized experimentation analysis system and can be compared and prioritized.  

In order to release an experiment we need to define our Goal and Guardrail metrics. These metrics let us measure our experiments against business priorities, and our success metrics are kept as stable as possible (only changing when we adjust our product roadmaps or business priorities). Standardized metrics let experiment owners make decisions faster and independently, which speeds up the experimentation process. 

Using a two-filter system for optimizing limited sample sizes

Switchback experiments, the most common deployed on our team, have relatively low power, meaning there is a higher chance our new feature will seem to make no impact when it actually did (essentially we are more likely to have a type II error). To mitigate the low power factor we need to run the experiment in large regions, which means we need as much experiment parallelization as possible. Using parallelization to run multiple experiments in tandem also allows for greater experiment velocity since we can run more at the same time without reducing power. However, when the volume of experiments grows too large, we find that the potential interaction between experiments cannot be ignored. As a result, we have tested and simulated several versions of factorial designs which try to balance these interactions and remove bias. 

After several iterations, we gave up on the most complicated factorial designs model and decided to adopt a two-zone system that requires less overhead management and human input. In this two-zone system, every window, split by region and hour, is randomly classified into either zone 1 or zone 2. In both zone 1 and zone 2, we have multiple layers, and each layer can have one or more experiments. Each week, we limit the number of layers in zone 2 to three so that we can measure interactions efficiently between experiments with high confidence.

Figure 2: Having multiple layers allows us to test the most important experiments with the most power

Zone 1 serves as a preliminary filter to select good candidates. Experiments running in zone 1 that meet our success metrics then move on to zone 2 for further testing. Zone 2 results are used to validate the Zone 1 results and make shipping decisions. Having this second filter not only limits the interactions between candidate experiments to be shipped but also avoids shipping experiments based on one week of data.

Setting up a weekly experiment cadence

Before we had a fixed experiment cadence, each experiment owner launched experiments on their own schedule. When the number of experiments increases, the overhead of coordination between experiment owners, the time spent on product reviews, and the risk of engineering reliability also dramatically increases. A weekly experiment cadence is at the center of our experimentation process and ensures that the execution of experiments is seamless and well organized. Our experiment cadence facilitates seamless collaboration between the engineering team, product team, and experiment owners. 

Our experiment cadence process: 

  • Early in the week, the experiment owner reviews the experiment results and makes decisions on the next steps of the experiment based on the metrics and shipping criteria.  
  • In the middle of the week, our product manager hosts a centralized review to coordinate the next steps for all experiments. During the experiment review, the team reviews the zone 2 experiments that should be shipped; the zone 1 experiments that should be promoted into zone 2 in the next week; and any new experiments that should be launched. People in the cross-functional team normally call out possible risks (e.g. interactions between experiments) and take steps to mitigate those risks. 
  • Later in the week, the engineering team implements the experiments, deploys experiments to production, and enables the experiments. After deployment, the engineering team closely monitors the experiment results and takes actions to make sure the production and quality metrics are healthy.  
  • After experiments are launched, each experiment owner will set up their analysis results in our experiment analysis platform.

Our weekly cadence is designed to give each experiment owner full control of the experiment and the ability to iterate swiftly. The review process can also help make sure that the experiment shipped is consistent with our product roadmap.

Figure 3: Weekly assignment experiment cadence: The whole process requires seamless collaboration between experiment owners, the product team, and the engineering team.

Overall our process ensures that: 

  • The product team is able to communicate with each individual experiment owner and understand the status so they can track the delivery of the features they own.
  • The progress of experiments is more easily shared within the team.
  • The deployment of each experiment is correctly delegated and is not tedious or time-consuming.
  • Each experiment owner can be more disciplined about maintaining experiment timelines.
  • The engineering team can closely monitor and mitigate the risk of experiments’ impact on the reliability of the system

Using optimal statistical methods

Part of building a scalable experimentation platform is creating a set of reliable statistical methods that will ensure experiments are accurate and reliable. Because we have a lot of network effects we need to create specific statistical methods to ensure that the switchback experiments we run are effective. After a number of iterations, our team was able to identify a set of statistical methods that performed best on our experiment setting. It is worth mentioning that our partnership with academics at Stanford University has provided us with many insights, guidance, and confidence.

Why switchback experiments are especially hard to deal with

In the assignment world, there is a strong network effect because we seek to match deliveries to Dashers in a region. As a result, traditional delivery-level A/B testing violates  Stable Unit Treatment Value Assumption (SUTVA).  For example, giving higher priorities for deliveries in treatment will delay the assignment of deliveries in control, because the treatment and control deliveries share the same Dasher pool. For most experiments, we rely on switchback experiments, which mitigate the violation of SUTVA by using region and time window combinations as the randomization unit, so the treatment and control groups will be separated.

Given the experimentation setup, the randomization unit (time window, region) is usually coarser than the analysis unit (delivery, which means our metrics are calculated at the delivery level). The analysis can easily get into a trap of not adjusting for the cluster, which leads to underestimated standard error. As a result, the false-positive rate can be at least 70% from our simulations. We need more sophisticated methodologies to analyze the result, such as cluster robust standard error, bootstraping, or the Delta method.

Optimizing our switchback experiments

There are two parameters in the switchback experiment design, region size and window size, both of which impact the bias and power of the experiment. 

The selection of window size of switchback is critical to determining the bias and power. If the window size is too small, there could be strong spillover effects between control and treatment units that are adjacent. On the other extreme, if the window size that’s selected is too wide, we will avoid the bias caused by spillover but have low power or sensitivity due to a smaller number of units that are getting the treatment. We have chosen the window sizes by conducting meta-experiments to understand the impact of window size on the experiment sensitivity and the bias of experiment results.

It is a similar case for the selection of region size. A larger region prevents the spillover between geography-adjacent control and treatment and hence has a smaller bias, however, with smaller power because of the smaller amount of units. An extreme case of the smallest region is using each individual store as a region. We conducted meta-experiments to validate that store-level region size will lead to inaccurate measurements. In some rare cases, if we want to use switchback to understand the impact of changing settings for a limited number of stores, we use store switchback. Because region switchback experiments are extremely insensitive and we believe the network effect is relatively small.

Our meta experiments help us understand the impact of using different window sizes and region sizes and pick the size that gets a good trade-off between experiment trustworthiness and velocity.

Figure 2: Different window sizes in our switchback experiments (x-axis) can yield different metric values (y-axis) for both treatment (blue) and control (orange) groups

Controlling variance reduction

The sensitivity or power of a controlled experiment refers to its ability to detect differences in business metrics due to product changes. The Assignment team is the pioneer in conducting experimentation at DoorDash, where we tested and simulated a wide variety of methods to increase power, including simple covariates, stratification, post-stratification, and CUPAC

In switchback experiments today, we mainly rely on one of the most effective and convenient variance reduction methods, CUPAC, which extends the idea for CUPED and is typically applied in consumer experiments. The idea of CUPAC is to leverage machine learning to construct the covariate that have a high correlation with the metric.

The CUPAC method dramatically improves the sensitivity of our experiments and thus improves our experiment velocity.

Capturing interactions between experiments 

Given that at any given time, we have multiple experiments running simultaneously in the same region, those experiments may interact with each other to make the experiment results less trustworthy. Our two-zone system mitigates the issue by only allowing up to three experiments in zone 2 at a time. To mitigate the risk of shipping experiments with inaccurate measurements, we set up a playbook for interactions between zone 2 experiments. 

First, we use advanced statistical methods to measure the interaction effect between each pair of experiments. The interaction effect gives us guidance on whether the two experiments augment each other’s impact, decrease each other’s impact, or have independent effects. In our playbook, we clearly define the experiment shipping criteria and rules based on the statistical inference on the experiment interaction. Our playbook for interaction is essential for us to run simultaneous experiments in parallel without worrying about the trustworthiness of experiment results.

Building an automated experimentation platform 

DoorDash’s experimentation platform, Curie, automates as much of the experimentation process as possible. After the experiment is implemented and deployed, we need to turn on the experiment, monitor the experiment, and set up experiment analysis in Curie. As our experiment volume grows, it is critical to automate and streamline our experiment setup and analytics processes for any task that generalizes across experiments. Our team has been working closely with the experimentation platform team to minimize the incremental costs of creating and analyzing new experiments. 

Creating the experimentation setup infrastructure

DoorDash’s experiment platform team has provided us with tools to build customizable experimentation infrastructure..  

  • We built an assignment-specific bucketing system to make it easier to run switchback experiments using our two-zone process.  
  • Real-time logging infrastructure allows us to query experiment buckets and other data in real-time. This is critical for monitoring and debugging our experiments.
  • Most experiment settings can be performed with simple configuration changes, without code deployment. This makes it easy to enable, disable, ramp up, and ramp down any experiments. 

Optimizing experimentation analysis infrastructure

The experimentation platform team built an in-house analytics portal to automate the analysis of experiments with simple user inputs. The tools have integrated  state-of-the-art methodologies we have found useful to make the analysis scalable and scientific. Because of this infrastructure, experiment owners have easy access to trustworthy experiment results at any time without relying on analytics partners. It takes less than 5 minutes to add an experiment to Curie, and once added, the experiment metrics and p-values are calculated each day that the experiment is live.   

Our analytics team has standardized  and refined our metric calculations. Each experiment run by our team uses a standardized set of 100+ goal, guardrail, and diagnostic metrics. Our analytics and engineering teams built a custom experiment result dashboard so that the 30+ assignment experiment run per week can be accessed easily from one place to check daily metric movement. This has been essential for our weekly experiment review process where we make ship and iteration decisions for all assignment experiments in less than 45 minutes. 

Conclusion

In a data-driven world being able to run massive numbers of experiments with scientific rigor and accuracy is key to unlocking fast development velocity. At DoorDash we were able to achieve this through the four pillars of our platform: a fail-forward culture, a scalable experiment process, rigorous statistical methods, and automation of our experimentation platform. While many of these actions address the Assignment team’s specific needs they can be utilized by many teams who suffer from similar challenges we worked to overcome. 

Acknowledgments

Thanks to all members of the cross-functional Assignment team for the support to build the framework and develop the culture over the years. Thanks to Caixia Huang, Richard Hwang, Longsheng Sun, Jared Bauman, Carla Sneider, Arun Kumar Balasubramani, Yihan Tan, Alex Weinstein, Chi Zhang, Darby Schumacher, and Colin Schoppert for their contributions! 

Special thanks to Professor Navdeep S. Sahni for providing guidance and counseling on the development of the framework and experimentation science at DoorDash.

Also thanks to Colin Schoppert and Darby Schumacher for their advice and help in organizing, refining, and editing the blogpost. 

About the authors 

Sifeng Lin works as an operations research scientist on Doordash’s engineering assignment team.  He leads the design and maintenance of the experimentation infrastructure in the assignment team.  He also works with the experimentation platform team to develop and improve the experiment analysis methodology in the assignment team.

Yixin Tang is a software engineer on DoorDash’s Experimentation Platform team. He is responsible for developing and maintaining the platform. He also leads the methodology working group in collaboration with Professor Sahni.

As DoorDash expanded and grew its product lines, we needed to find a better way to manage user data. In DoorDash’s Storefront offering, which provides merchants with a customizable online ordering solution along with the Dasher network for delivery fulfillment, we needed a better way to manage user data because customers could checkout as guests but had to endure the negative user experience when providing their payment and address information each time they checked out. The technical challenge was that we could not persist duplicate users, which would mean a customer with an existing DoorDash account wouldn’t be able to create a Storefront merchant account with the same information. To solve this user data management problem, we introduced the concept of multi-tenancy to our existing codebase and infrastructure which altered how we manage sensitive user data and improved our customer’s user experience.

The challenge with guest checkouts

Whenever customers ordered from one of our Storefront merchants, who have a customized online ordering UI but are powered by DoorDash’s backend infrastructure,  they would have to fill in their personal information (e.g. contact details, payment) each time. After ordering a few times, this process feels long and tedious. Even if customers were coming back to shop from the same exact store, they would have to enter their information again. Furthermore, the ordering experience lacked a degree of personalization, as customers weren’t shown reorder recommendations or other personal touches that might improve their ordering experience. 

Stay Informed with Weekly Updates

Subscribe to our Engineering blog to get regular updates on all the coolest projects our team is working on

This customer friction caused many customers, even loyal customers of the merchant, to leave during checkout, reducing reorder rates. Ultimately we wanted to enable storefront customers to create accounts with their go-to merchants so they would not have to re-enter their information repeatedly and would receive a more personalized experience. 

The data challenges inherent in persisting user data  

One of the most daunting challenges in solving this problem was that our existing user data tables didn’t allow duplicate users, which was enforced by a constraint dictating that no two users could have the same email. From the Storefront product perspective, we couldn’t support allowing users to create multiple accounts that were each tied to their favorite merchants because this would create duplicate accounts with the same email addresses and phone numbers. Additionally, Storefront accounts could be duplicates of existing DoorDash accounts. Given future goals of expanding internationally, we were also mindful to not violate GDPR requirements, which favor clear user data separation.

Where multi-tenancy comes in

Multi-tenancy is an architecture paradigm where one software application and its supporting infrastructure is designed to serve multiple customer segments, also called tenants. We addressed our data challenges by adopting the multi-tenancy model and introducing a separate database for each business vertical (e.g. Marketplace vs. Storefront vs. Drive). Each vertical can be considered an L0 tenant, representing a larger separation of data. Furthermore, multi-tenancy enforces logical separation within each database to allow for even more differentiation/labeling of data within the L0 tenant. This more granular division of data consists of what we call L1 tenants, which represent merchants in the Storefront case. Using this concept of multi-tenancy, we were able to incorporate this model of data separation into the existing DoorDash engineering ecosystem to unblock storefront’s business problem and enable future flexibility.

Figure 1: L0 tenants are based on different business verticals and L1 tenants are database divisions within verticals .

How we incorporated multi-tenancy into DoorDash’s codebase

To address Storefront’s business needs, we built a flow for user authentication allowing users to create one account per merchant and have their user data pre-filled when they visit the merchant’s stores again. Instead of relying on email addresses as the primary identifier, we used phone numbers with the goal of a password-less authentication process. Additionally, we handled Storefront user data in a similar fashion as DoorDash user data: 

  • preserve user control over their data
  • preserve data integrity with the appropriate constraints
  • prevent data intermingling among different verticals

To ensure that data was handled according to these requirements, multi-tenancy helped solve two problems for us: separating Storefront and existing DoorDash’s Marketplace/Caviar users and allowing duplicate phone numbers/emails across different Storefront merchants. Incorporating multi-tenancy into our system involved a few steps:

  1. With help from partner teams, we first created a new database for the Storefront vertical (L0 tenant) and added a new column to all user-related tables called tenant id (a string which contains both L0 and L1 tenant). This step introduces both the larger L0 level of separation and the more granular L1 division.
  2. Then, we added logic to route a user-related query to the correct database based on the L0 tenant (first part of the tenant id) passed in from the request header. To break it down a bit, we defined tenant id as a string formatted like the code sample below. In our case, this was represented as “<business vertical>:<entity/merchant id>”, This value allows us to derive the high-level vertical (L0 tenant) as well as a more granular differentiator (L1 tenant/subtenant) from a request.
 “<L0 tenant>:<L1 tenant>”
  1. In addition, we included this tenant id value in the headers of requests throughout the chain of services Storefront calls to power the vertical. 
  2. Finally, we changed the uniqueness constraint on the user table to be enforced on a (phone number/email, tenant id) pair instead of just phone number/email. This would allow a user to create multiple accounts with different merchants with the same phone number, but the database wouldn’t complain as the tenant ids are different for different merchants. Thus, a user can log into each of their favorite merchants with the same phone number, but the system would register each as a separate merchant account.
Figure 2: Our solution passes the tenant id is through different services until it reaches the user management service, including navigating the multi-tenant database.

Conclusion 

Supporting multiple accounts is a typical problem as businesses want to retain their customers and improve/personalize their experiences. Additionally, data separation and labelling is becoming more important given compliance requirements such as GDPR. This sensitive user data can get messy for companies with multiple product offerings. As product lines grow over time, coming up with new data storage and handling processes becomes a necessary bridge to cross.

The multi-tenancy solution detailed in this article is helpful for those who want a pragmatic, more feasible solution to supporting multiple accounts for users or improving their user management in general. It doesn’t involve any overly complex technologies or external integrations. Instead, it looks at what is already built in our existing services and builds on top of it in an extensible way. 

For most companies starting out, it’s probably a typical pattern to start off with one centralized database to manage user data. However, as the company grows, it might be necessary to figure out a better, more scalable way to manage the growing data. Multi-tenancy provides a practical solution for this problem, without having to uproot what’s already built. With multi-tenancy, business verticals can enforce both physical and logical separation in their codebase and supporting infrastructure, allowing both existing and new user data to abide by the same model of separation. After completing the initial integration, this model of user data management can be easily extended to new verticals, while maintaining consistency and data integrity across all verticals.

Acknowledgements

Thanks to all the individuals and teams who were involved in this ongoing effort to make multi-tenancy a reality! Special shout-out to Kritarth Upadhyay, Omendra Rathor, and Ivar Lazzaro for their hard work on this project to bring Storefront user accounts and multi-tenancy to life. 

If you are interested in solving these kinds of challenges, please consider joining the Storefront engineering team. We are actively hiring backend and frontend engineers in both San Francisco and Seattle. For questions on Storefront-specific roles, please reach out directly to our recruiter, Dolores, on Linkedin. If you are interested in working on other areas at DoorDash, check out our careers page.