

The complexity of a microservice architecture requires fine-grained observability to spot impending service and infrastructure failures, and quickly mitigate them. Recognizing this need at DoorDash, we developed Infra Prober, a new tool to help us maintain the reliability of our platform.
Our earlier observability system monitored the performance of our services and infrastructure independently. However, the failures of one infrastructure component can impact multiple services and may even affect other infrastructure components. With this strategy, we could not always identify an originating issue among those that followed. To improve our reliability and reach our goals, we needed an approach to identify the health and reliability of infrastructure components directly with a higher signal-to-noise ratio (SNR).
In 2019, we began work on a blackbox probe, a technique that mimics user behavior to find faults in a system. If, for example, a cluster in our caching system that enables services to get/set keys was degraded, a blackbox probe would attempt to do the get/set operations to the cluster, just as the services depending on the caching system would.
We built our new Infra Prober tool around Cloudprober, an observability tool developed by Google and released as open source under the Apache 2.0 license. Cloudprober does an excellent job running probes to determine the health of a system. To suit our purposes, we built a number of components to extend Cloudprober to monitor our infrastructure components.
With its reports delivered through Prometheus, another open source project released under the Apache 2.0 license, we’ve reduced our time to detect critical incidents by 82.5% since 2019.
Original microservices-based monitoring strategy
DoorDash’s microservice architecture consists of multiple loosely coupled, collaborating services managed by service teams and a set of API-driven, self-service infrastructure components maintained by infrastructure teams. The service teams and the infrastructure teams each support two parts of the monitoring system independently, as shown in Figure 1, below:

Each service provides service-level metrics that indicate its health. If the service performance degrades, the related service team receives an alert.
Each infrastructure component provides system-level metrics measuring its own performance. The service team and/or the related infrastructure team is notified if the infrastructure component becomes unhealthy.
Deficiencies with this strategy
Although the two types of monitoring defined above are essential, we found that significant incidents often resulted in cascading failures causing many metrics-based alerts to fire. Multiple alerts made it difficult to find the root cause failure quickly.
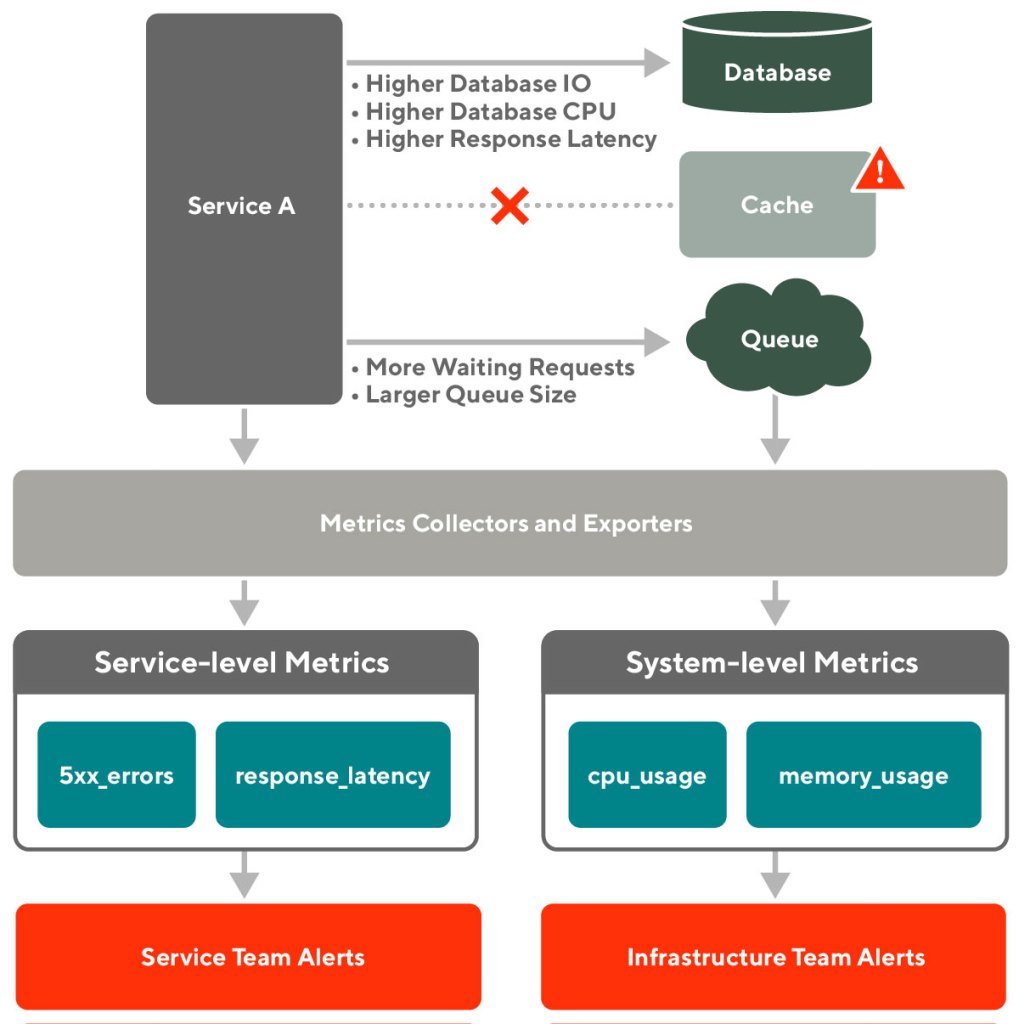
For example, if an unexpected failover occurred with the caching system due to a bad infrastructure change, the related services may see higher response latency and error rates. At the same time, the infrastructure team may see higher I/O rates and CPU usage of the associated database and more messages queued, as shown in Figure 2, above. In this case, engineers would have a difficult time identifying the root cause unless someone manually checks the status and events of the caching system.
Due to these deficiencies, we found it crucial to have an additional monitoring approach that could provide a fast and reliable signal to identify the health and reliability of infrastructure components directly.
Designing Infra Prober to monitor infrastructure components
We believe the health and reliability of a system is best measured from an external users’ point of view, which can be established by blackbox probing. This technique monitors the behavior of a system similar to how external users would see it. Blackbox probing can provide a high SNR by focusing on what really matters to the external users.
To accomplish this goal, we developed Infra Prober, a new tool that actively probes our infrastructure components by executing small checks that mimic basic client behavior. We purposefully selected basic operations and small checks to make sure the actions provide very reliable signals when they succeed or fail, rather than alerts based on the probe operation steps themselves, as with our earlier alerting strategy.
If the caching system is inaccessible, Infra Prober can detect the failures immediately and fire off an alert ahead of the original teams’ alerts. Based on the alerts timeline, the root cause becomes much easier to detect.

Key components
Rather than reinvent the wheel, we used the open source Cloudprober as the core of Infra Prober. From there, we added components to connect Cloudprober to our infrastructure components. We also found a need for a cleanup component in the system.

Cloudprober and probes
Cloudprober makes it very easy to monitor availability and performance of various components of the system. Employing an active monitoring model, Cloudprober’s main task is to run probes. A probe executes a time-bound check against the system’s components to verify that they are working as expected from a users’ point of view, at a configured interval, and exports results as a set of metrics. Cloudprober has multiple built-in probes for the most common types of checks, such as ping. It allows using external probes to customize checks as well.
Infrastructure configurations
Infrastructure configurations, stored in configuration files, define the probes’ details, including type, name, interval, timeout, and target. To maintain the configuration files, we added components around Cloudprober to support a more dynamic configuration.
Infrastructure Collector
Our dynamic infrastructure and varying list of clusters makes the configurations difficult to maintain statically. We designed the Infrastructure Collector to automatically discover the latest states of infrastructure components and update the configuration file.
Allowlist and blocklist
Specifying the allowlists and blocklists in a dynamic configuration system lets engineers update the configurations on the fly without restarting the probe service when it needs a quick or urgent configuration change.
Observability
Cloudprober exports probe results as a set of Prometheus metrics. All types of probes collect the following metrics at a minimum, which are, in turn, used for alerting:
| Metric | Type | Description |
| Total | Counter | Total number of probes. |
| Success | Counter | Number of successful probes. Deficit between total and success indicates failures. |
| Latency | Counter | Cumulative probe latency. By default it's just the sum of the latencies observed so far. Average latency can be computed using rate(latency)/rate(success). |
Cleanup
Some probes modify the state of the target system, such as inserting and deleting a record. When such a probe fails, it may leave that record in the system. In time, those records build up as garbage (memory or storage level) and impact the system performance. The cleanup process is responsible for garbage collection and cleanup.
Key challenges we resolved
Monitoring systems generally use system resources. With Infra Prober, one key challenge was to limit the overhead, which we managed through probe design and controlling the number of connections. We also needed to tune the system to optimize alert sensitivity and time-to-detection of issues.
Designing a reasonable workflow for each probe
Infra Prober needs to run its probes repeatedly to continually monitor our services and infrastructure. To keep resource usage low, we designed the probe workflow to be simple and lightweight. We focused on the most basic client behaviors for each infrastructure component. For example, the basic client behaviors for a Redis cluster are to set and get a key, so a SET and a GET are the only two checks in a Redis probe workflow.
The key difference between probe checks and normal service behaviors on the infrastructure components is the frequency. When designing the workflow of a probe, another important metric to think about is the time to live (TTL). In the case of a Redis probe, if the Redis cluster is tiny and the probe is using the default TTL set for a standard service, it has a higher risk of overloading the cluster memory, which can cause issues.
Detecting issues quickly while maintaining a high SNR
One goal of Infra Prober is to reduce the detection time when any infrastructure component is down. To achieve this goal, we needed to improve the metrics precision and alerts sensitivity.
- To improve the metrics precision, we wanted to make the probes’ intervals as short as possible to get more samples. However, shorter intervals increase the concurrent processes of probes and consume more system resources.
- To improve the alert sensitivity, we wanted to fire the alerts as soon as possible after the service-level objective (SLO) was impacted. However, more sensitivity means more noise.
To balance the issue detection time and SNR while making the Infra Prober alerts more reliable, we took the following actions:
- Conducted multiple experiments and monitored the metrics for multiple months to find the best probe intervals and alert thresholds for different infrastructure components.
- Eliminated the noise during Infra Prober server warmup by automatically creating maintenance windows to mute the alerts.
- Reduced the noise due to metrics lags by adding additional checks to the alert conditions. For example, one alert condition checks if metrics have missing data or an abnormal data volume before firing the alerts.
- Clarified the ownership of each infrastructure component and forwarded high urgency alerts directly to the owners to reduce the incident response time.
- Provided detailed documentation to teams and enabled them to modify alert sensitivity to their needs.
These efforts make Infra Prober able to detect real issues and fire reliable alerts in two minutes with an extremely high SNR.
Managing the number of connections when probe frequency is high
By default, Cloudprober forks out a new probe process for every probe cycle, which can become resource intensive if the probe frequency is high and the process is big. If each probe cycle creates a new connection to the infrastructure cluster, the cluster may become overloaded and unavailable.

To solve this problem, we use Cloudprober's server mode in Infra Prober, which provides a way to run the probe process in the background, as a daemon. In server mode, Cloudprober communicates with this process over standard output (stdout) and standard input (stdin).
Results and impact
We launched Infra Prober in October 2019 and it now actively probes nine of our critical infrastructure components with over 160 infrastructure clusters. More infrastructure components will be covered in the future.
Infra Prober helps oncall engineers quickly identify infrastructure failures and adds extra context to solving ongoing issues.
Compared with the second and third quarters of 2019, before we launched Infra Prober, the mean time-to-detection for critical incidents was reduced by 82.5%, and the growth rate of system uptime was increased by about three times. Infra Prober contributed greatly to this big win.


Looking to the future
In the future, we will keep reducing the issue detection time and increasing the SNR of Infra Prober. There will be multiple Cloudprober instances running together with a rolling update strategy to minimize the impacts from feature and code rollouts and server warmup processes.
In the long term, Infra Prober metrics will set a baseline as our service level indicators (SLIs). After establishing this standard, we will be able to hold ourselves to uptime SLOs and use the results to prioritize our infrastructure investment.
Moreover, as our infrastructure matures, we will use the health signals provided by Infra Prober as indicators that a specific availability zone or region is unhealthy and should be drained of traffic.
Acknowledgments
Kudos to Luigi Tagliamonte, Luke Christopherson, Qixuan Wang, Rabun Kosar, and Sebastian Yates for contributing to this project. Big thanks to Alessandro Salvatori, Robert Treat, Sean Chittenden, Stephen Chu, and Wuang Qin for helping maintain this project. Also, special thanks to Manu Garg and other contributors of the Cloudprober open source project.
Header photo by Lianhao Qu on Unsplash.