
The vast majority of work in developing machine learning models in the industry is data preparation, but current methods require a lot of intensive and repetitive work by practitioners. This includes collecting data, formatting it correctly, validating that the data is meaningful and accurate, and applying transformations so that it can be easily interpreted by models. Machine learning engineers at DoorDash routinely perform these tasks as part of our development process, and through careful observation of common data issues we have developed analytical tools to accelerate the data preparation process.
In this post, we’ll discuss the most common data issues in machine learning datasets, including missing and invalid values, outliers, defaulting, and sampling errors. We’ll also show how our new, open-source DataQualityReport library for Pandas quickly and easily uncovers these issues and can be applied to a wide variety of data.
Introducing DataQualityReport
To share what we at DoorDash have learned about data quality, we have released a new open source library called DataQualityReport (https://github.com/doordash-oss/DataQualityReport) that generates diagnostics for datasets specifically targeting data validation for machine learning models. Throughout this article we will use DataQualityReport to uncover common data quality issues through simple methods which work with any Pandas dataframe.
Getting started with DataQualityReport
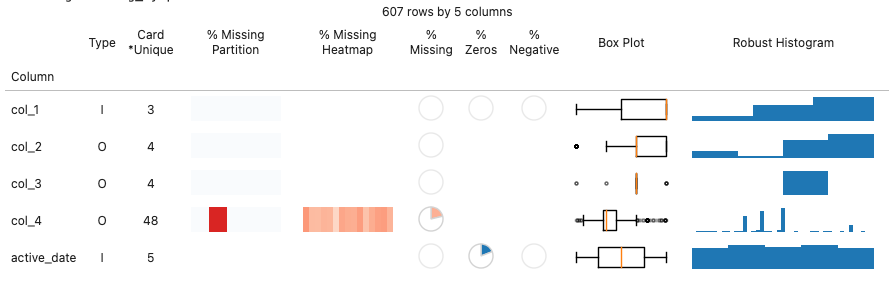
To start our guide on how to use the DataQualityReport tool, we will begin with the `dqr_table`, as seen in Figure 1. Dqr_table provides a wide range of information about each column within a Pandas dataframe.
Using dqr_table with a Pandas dataframe requires two simple lines of Python code:
from dataqualityreport import dqr_table
dqr_table(my_df) # supply your own dataframe: my_df
In this article, we’ll discuss common data quality issues, as well as show how dqr_table highlights these issues and makes it easy to quickly diagnose them.
Identifying missing values
Perhaps the most obvious data quality issue is missing data in the dataset. Beyond identifying that data is missing, understanding characteristics of the missing data can help provide clues about how best to proceed when training ML models .
Grossly missing values
Sometimes a field isn’t being populated, usually due to a logging error, or the query used to generate this field fails to join it correctly. An example dataset is shown in Figure 2.
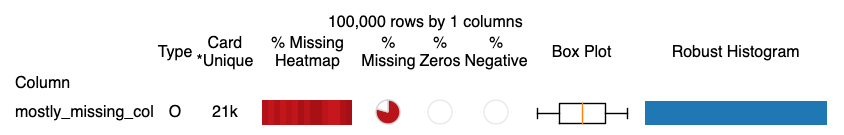
While pie-charts are much maligned among information design practitioners, we found that in this compact format, pie charts offer some significant advantages, as shown in Figure 2. Unlike bar charts, no axis is required to understand what proportion of values are missing. They also are extremely compact and easy to scan - which is likely why the related harvey balls are frequently used in business presentations and consumer rating magazines alike.
Partially missing values with correlations
Often, a collection of data fields is not available under certain conditions, such as a particular product outcome (e.g. order cancellation), or related properties for a foreign key (e.g. store dimensional data) that was not found. Understanding the correlation between fields can both be helpful to root cause an issue, as well as prioritize which data quality issues to address.

Missing values by partition
For companies doing data collection from online services, publishing data to the data warehouse is often done as a daily ETL process. Each day, source data logs and external sources are processed, and a new ‘partition’ for the day, i.e. yesterday, is populated for tables in the data warehouse. DataQualityReport allows users to define a partition column (here named `active_date`) and constructs a visualization of the missing proportion grouped by that column.

In Col_1 of the dataset shown in Figure 4, it is likely something changed over the observed period either in the collection of this data, or a portion of the data population process was not completed.
Col_2 exhibits a likely more acceptable, but still notable issue. The final partition is partially missing data. This happens frequently as some data sources may not be fully available in time for the next data population job. This partition will be repopulated the next day once all the data is available. From an ML perspective, the incidence of missing data in this scenario is likely not representative of the distribution of missing data in the online scoring environment, so it may be appropriate to remove this final partition.
Missing data comes in a variety of flavors, and detecting trends in missing data can help easily determine how severe the issue might be, how its root causes might be remediated, and how modeling may be affected by data quality.
Invalid values
Some fields may only be valid within certain ranges. Two of the most common domains are non-negative and non-zero values. Within DoorDash, time duration features (e.g. 3 minutes of Dasher wait time) are often constrained to be non-negative, and potentially non-zero as well. In other contexts, -1 or 0 are used in place of NULL as default values that indicate a valid value was not available.

Figure 5 demonstrates using two pie charts to easily detect the range of a given field: % Zeros & % Negative. It is worth noting that the pie chart is particularly effective in distinguishing between identically zero and small but non-zero percents while enabling easy scanning across multiple fields.
Data distribution anomalies
Some of the most difficult to detect data quality issues happen when values are present and within the domain of valid values, but are still biased or reflect other errors in data processing.
Outliers
Features can sometimes assume extreme values that are artifacts of data quality issues and / or may cause issues with model training. Some common data failure modes that result in extreme values include:
- Users providing times that are off-by-one day / hour
- Users providing times in the wrong time zone or UTC vs. local
- Client devices that have the wrong device time (perhaps maliciously)
- Software Testing (e.g. some testing / canary environment is generating logs for ‘fake’ data that doesn’t have valid properties)
- Overflow errors on data types

The most common visualization for understanding outliers is a box plot. As shown in Figure 6, DataQualityReport includes the Box Plot for each column to easily find and visualize outliers. Tree-based machine learning models can often handle outliers easily in features, but parametric functional models, such as regression or neural networks, need to remove or bound inputs to models.
Default values
Systems can sometimes use non-zero, non-negative values when source data is not available, also known as defaulting. In machine learning use cases, an overall or conditional mean may be used to replace missing values in the online environment.
In another scenario, sometimes a default value is populated into a user field, which can be modified by the user but frequently is left unchanged as seen in the Robust Histogram of Figure 6. The robust histogram uses an interquartile range outlier removal process to create a usable histogram of just the core distribution in a feature. If there are spikes for specific values in the distribution, that indicates that there is likely some factor contributing to a bias towards these values. Machine learning models can learn and account for these biases, but it also may be useful to provide separate features indicating when these biases are active (e.g. did the user input the value directly or just accept the default).
Identifying sampling errors
Supervised machine learning models try to generate predictions across a given distribution of inputs that match target outputs. We design our training set distribution to match the distribution of production inputs we expect to see and evaluate our loss function across this distribution. However, training data doesn’t always match this distribution, most often due to duplicate join keys but potentially due to other upstream data processing errors.

Figure 7 demonstrates how the Cardinality field helps understand the number of distinct values in a field, and whether each value is unique, as indicated by the * (star character). If a field that should act as a sample primary key is not unique, the data set may be corrupt or the data generation process flawed.
In machine learning applications, alignment between training and serving features is also very important. Common issues include encoding categorical variables differently between training and serving, using different numerical transformations / units for continuous variables or staleness / latency issues with real-time features.
DataQualityReport provides a special method for comparing multiple datasets, dqr_compare, which produces a table similar to the one shown in Figure 8.

In addition to sorting your column names alphabetically to collate columns across datasets, the histogram and box plots share common axes when the same column exists in multiple datasets, enabling easy comparison of outliers and distributional variations.
Finding Bad Data Types
Python is a dynamically typed language allowing developers to throw data into Python without thinking too much about how it should be stored. In many cases, machine learning modeling libraries can handle these inputs gracefully, although problems can arise when numeric values are handled as categorical, or vice versa.

The Pandas data type (i.e. dtype) is included in the Type column of the DataQualityReport, as seen in Figure 9. Here, a numeric value is encoded as an object type, which may cause problems for some ML libraries. Often the solution is to cast the column to a new type, or ensure that the correct type is inferred by Pandas / Python by updating the source data processing and ingestion.
Conclusion
Data quality issues come in a variety of forms, from obviously missing and extreme values to biases hiding in duplication and defaulting. Detecting these issues quickly and diagnosing likely causes will help prioritize which problems need to be solved, which can be handled through ML techniques, and ultimately lead to better performance and success in ML modeling projects.
DataQualityReport is now open sourced under an Apache 2.0 license and we welcome contributions and feedback on the project. You can find out more about using DataQualityReport in our tutorial.