
DoorDash features an engaging internship program that integrates software engineering interns into our Engineering teams, providing them with valuable hands-on experience that supplements their academic studies. This is second post that showcases the exciting projects our summer 2024 interns developed. If you missed the first post, you can read it here.
Optimizing and scaling merchant monthly statement generation
By: Hana Mirbagheri
The merchant monthly statement, a PDF document offered to merchants (Mx) through the Mx portal, provides a clear and concise overview of DoorDash earnings and expenditures to help merchants track financial performance and reconcile accounts efficiently. While the current architecture has generated these statements successfully for several years, the expanding Mx roster and evolving needs require shifting toward a more scalable and reliable system.
Legacy architecture problems
- Data mismatch with the rest of the Mx portal: Mx portal dynamic pages, which allow Mx to reconcile data for any number of days, are powered by two main source tables in snowflake that are separate from the monthly statement architecture. Monthly statement data is reconciled from multiple sources, generating mismatches for some merchants with other portal pages.
- Lack of scalability: Because all monthly aggregation of data is done online on the generation side, workflows can occasionally time out with too many API calls, leaving some merchants with no statement for the month. On top of that, current architecture results in excessive history events due to the large number of cadence activities used, which often leads to incomplete job runs. The complex online data aggregation logic also makes it difficult to add new statement fields as DoorDash’s offerings expand.
These issues can result in a fragmented and non-unified experience for Mx as they navigate through the portal, with some failing to benefit at all from the monthly statement feature.
Creating a more unified and scalable architecture
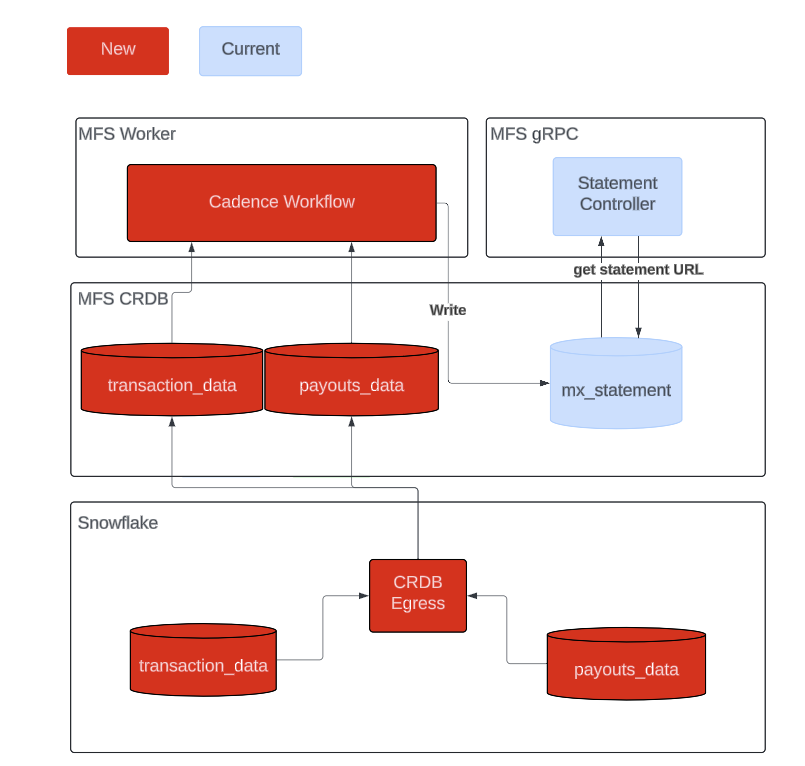
To make sure monthly statement data reconciles with the rest of the portal, we decided to pre-prepare the data so the new cadence workflow only needs to read and generate like shown in Figure 1, To reduce the number of history events, we designed a system with three main components: a cron scheduler, a dispatcher, and a store-level generator as shown in Figure 2. We leveraged the existing table from the previous system to store generated statements, streamlining statement integration into the Mx portal. All three of the new components use Cadence workflows, a framework for building distributed applications. Cadence workflows handle task deployment, automatically manage retries in the event of errors, and streamline code distribution without requiring additional programming beyond the specific tasks themselves.

Delving deeper into each component
Derived from the Greek chronos, or time, a cron scheduler creates the dispatcher on the second of each month. This timekeeping task ensures statement generation is kicked off as scheduled.
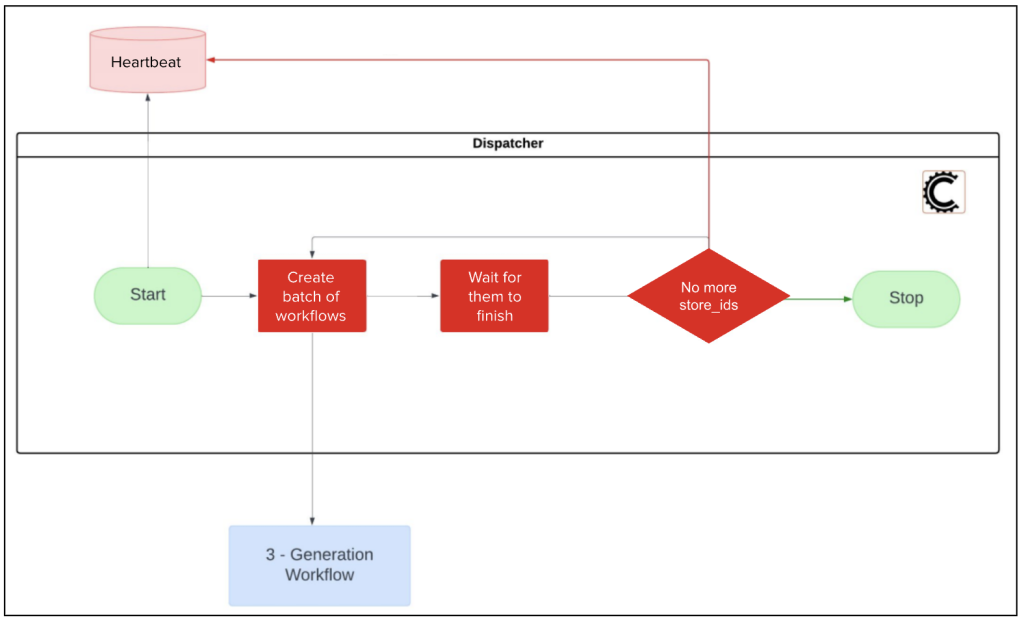
As seen in Figure 3, the dispatcher is the longest-running activity of the whole workflow, deploying all generation workflows with the option to wait for the previous batch to finish. Because this workflow can run for several hours to create all required statements — chances of failure are high. To contend with this, we created a heartbeat value to keep track of the last store-id deployed in each batch, ensuring we can return to the previous state if the dispatcher activity fails or times out.
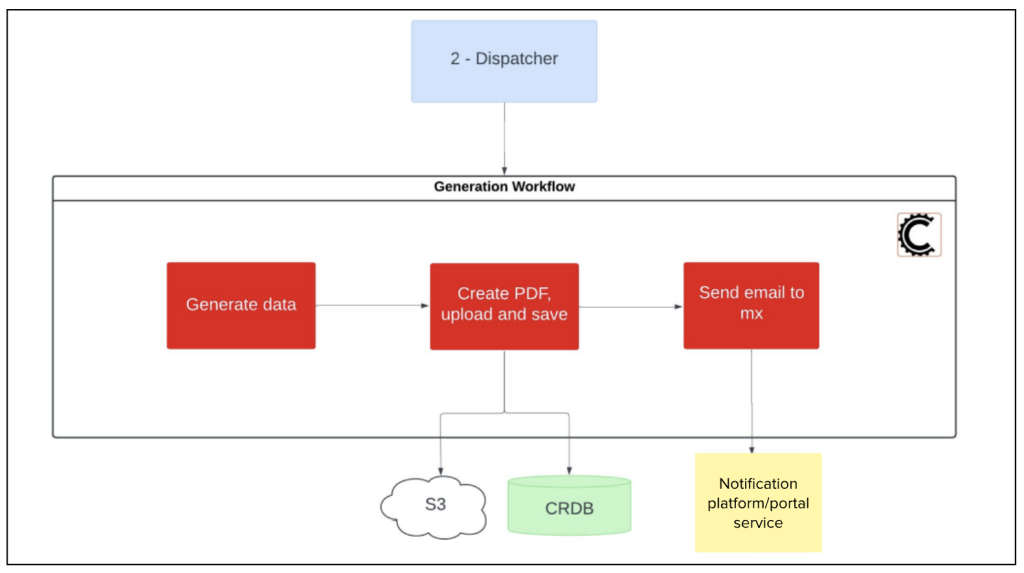
As seen below in Figure 4, the generator handles the bulk of the work involved in creating statements. To ensure consistency, the generator pulls data from the same two databases that power the rest of the Mx portal, populates the PDF’s fields, and uploads the final document to Amazon S3 for storage. It also saves the statement to the CockroachDB ‘mx_statement’ table, a component retained from the previous architecture. When done, it sends an email notification to the merchant, letting them know that the statement is ready for viewing.
Impact
The new system architecture eliminates data mismatch within the Mx portal, improving the experience for 8% of merchants by fully aligning all data within the portal.
Because all data aggregation now is done on the data side prior to the actual run, rather than within the workflow, statement generation no longer times out, allowing all merchants to benefit from the monthly statements. Increased architecture scalability also makes it simple to add new statement fields, reducing the time for this task from one month to less than three days.
This project is just one step toward improving our systems and architecture to meet the evolving needs of DoorDash merchants, ensuring we can scale efficiently and support their success.
Enhancing DoorDash's forecast platform with advanced AI
By: Hao Quan
Forecasting is crucial to DoorDash, driving operations from deliveries to financial planning. As the business expands, our forecast platform team strives to provide scalable, accurate, and efficient forecasts for increasingly granular use cases, including such things as predicting daily ad traffic for hundreds of thousands of stores or demand for millions of items. Consequently, DoorDash is deploying innovative approaches to address forecasting needs. Chronos, a pre-trained time series model based on AI language model architectures, is one such innovation. In this post we explore benchmarking Chronos against DoorDash’s existing ELITE framework — short for ensemble learning for improved time-series estimation — to assess improvements in forecast accuracy, speed, and computational cost.
Challenges with the current solution
Currently, ELITE enhances accuracy and speed through an ensemble of models. It relies, however, on traditional methods that require separate models for each time series, making it computationally intensive and difficult to scale. Moreover, statistical and machine learning models in the ELITE framework demand frequent retraining and struggle with complex patterns, such as mixed seasonalities, long historical contexts and forecast horizons, and volatile high-frequency data dynamics. As DoorDash’s needs grow, ELITE's approach becomes less sustainable because of increased runtime, memory usage, and maintenance efforts.
Our solution: One model for all series
New deep learning models like Chronos offer a modern solution by providing a global model that forecasts multiple time series simultaneously. Developed by Amazon, Chronos leverages a language model architecture to learn from all series in a dataset, generating shared forecasts and enhancing adaptability. It simplifies the forecasting pipeline by potentially offering zero-shot performance — accurate predictions without the need for fine-tuning. Here we evaluate both pre-trained and fine-tuned versions of Chronos to determine their effectiveness in improving forecast accuracy and efficiency.
Experiment details
- Datasets: We benchmarked Chronos and ELITE using a dataset of weekly delivery order volumes at the submarket level, covering thousands of submarkets with series lengths ranging from two to four years.
- Train/test split: To avoid look-ahead bias, we performed a temporal split rather than splitting among different series. For each time series, the most recent year's data — 52 weeks — is used for backtesting, while older data is used for training. Given that all series are derived from a single, highly correlated dataset, a simple series split would lead to inaccurate results. Backtesting follows an expanding window approach, as shown in Figure 1 below, in which the model forecasts the next weeks, expands the window to include actuals, and repeats this process. We report the average accuracy across all forecasts over the course of a year.

Model specifications:We compared both pre-trained and fine-tuned Chronos models with the ELITE model. Chronos models were evaluated across five parameter sizes (in millions): tiny (8 M), mini (20 M), small (46 M), base (200 M), and large (710 M). Fine-tuning was conducted on tiny, mini, and small models with look-back window sizes from 104 to 256 weeks. Models are denoted as follows:
- Pre-trained Chronos models: c-size-pretrained (e.g., c-large-pretrained)
- Fine-tuned Chronos models: c-size-lookback_window-horizon (e.g., c-tiny-104-8)
- ELITE: current flagship model on the forecast platform
Metrics:Model accuracy is measured using the weighted mean absolute percentage error, or wMAPE, which weights errors based on order volume, giving greater importance to submarkets with larger volumes. This approach aligns more closely with business needs than unweighted MAPE.

where is the actual order volume for submarket at the -th week into the future, is the forecasted value, is the forecast horizon, and is the number of submarkets.
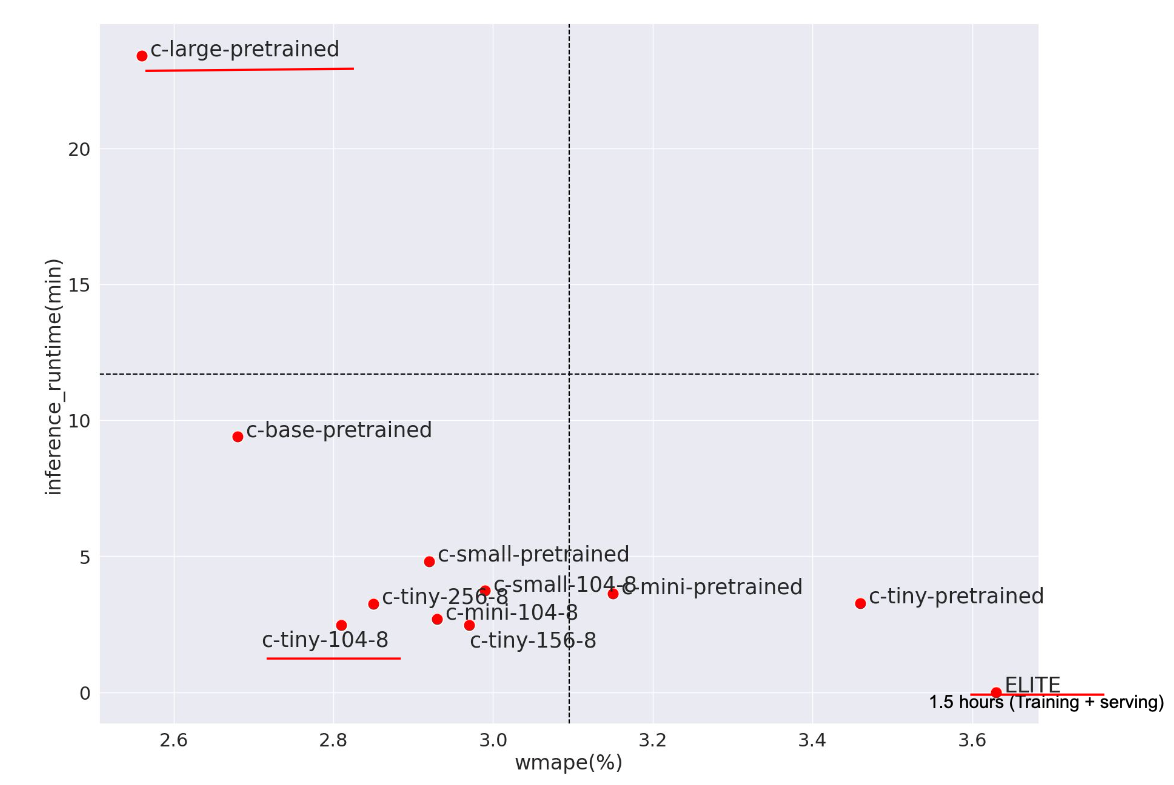
Benchmark results:As shown in Figure 2, there is a trade-off between accuracy and speed for all tested models.
Chronos advantages
- Accuracy improvements of 5% to 30%
- From the plot, the c-large-pretrained model achieves the highest accuracy with a wMAPE of around 2.6%, demonstrating impressive zero-shot performance. This suggests that it can provide robust predictions without fine-tuning, which could be advantageous for similar tasks, such as daily, weekly, or monthly forecasts.
- Fine-tuning Chronos models still proves valuable. Fine-tuned models like c-small-104-8 and c-tiny-104-8 outperform their pretrained counterparts, offering accuracy gains of 10% to 20%. Fine-tuning even larger models such as Chronos-Large could further enhance accuracy, although this may require more sophisticated methods like low-rank adaptation for efficient fine-tuning.
- Inference speed increases 3- to 50-fold: Chronos models are significantly faster than ELITE, with inference times ranging from two to three minutes for the smallest models, such as c-tiny-104-8, to about 25 minutes for the largest model — c-large-pretrained. This results in speed improvements of three to 50 times compared to ELITE, which requires around 1.5 hours for combined training and serving. Although ELITE’s runtime includes both training and serving, the split would likely not make a significant difference in efficiency, because ELITE relies on locally trained statistical models that need frequent retraining. Faster inference speeds are crucial for tasks requiring high granularity, such as store or item-level forecasts.
- 70% reduction in computational costs over ELITE: Chronos reduces costs thanks to efficient use of GPU resources on the Fireworks AI platform.
- Built-in confidence intervals: Chronos models can generate multiple realizations, providing bootstrapped confidence intervals without additional simulations, which is useful for rapid anomaly detection.
Chronos challenges
- Handling external features: Chronos does not natively manage covariates or external features, potentially affecting accuracy. Possible solutions include using preprocessors/post-processors or integrating Chronos with ELITE’s ensemble layer to handle external variables like holidays and weather. The latter can also provide clearer interpretability through feature importance metrics. Given that the ensemble layer contributes less than 1% of ELITE's computational overhead, this approach is feasible.
- Limitations on long-look-back windows and horizons: Chronos is limited here because it includes hard-coded maximum look-back window sizes -- the backbone T5 model — as well as computational inefficiencies caused by the quadratic complexity of its attention mechanism and the autoregressive nature of forecast generation. One promising solution could come from developing a fast temporal encoder-decoder model similar to TiDE based on multi-layer perceptron architecture. This approach would aim for linear complexity and direct multi-step forecast generation. Initial benchmarks on challenging cases, such as by-the-minute ads traffic forecasts, have shown both accuracy improvements and up to 100-fold speed increases compared to ELITE. Further progress on this new model is ongoing. Stay tuned for more updates!
Impact of deep learning models
Deep learning models like Chronos can significantly reduce costs and enhance operational scalability for the forecast platform. With accuracy improvements ranging from 5% to 30%, these models have the potential to save tens of millions of dollars through reducing errors in operational planning. Moreover, the global model framework not only enhances forecast accuracy but also slashes computational costs, boosts serving speed, and simplifies the forecasting pipeline. By enabling a single model to serve multiple time series without the need for repetitive retraining, deep learning models are pivotal to our ability to scale up effectively. As we look to the future, these advancements will be critical in ensuring DoorDash’s forecast platform remains robust and efficient, capable of meeting growing business demands.
Enhancing Doordash ads platform testing framework with request harvesting
By: Kai Dabauskas
As DoorDash expands into new verticals such as groceries and alcohol, new use cases for ads are constantly emerging and evolving. The ads exchange service is responsible for providing the infrastructure needed to deliver ads on Doordash. Before new releases of the ads system can be deployed, a series of regression and performance tests are run in a sandboxed environment to ensure system reliability. This testing is crucial for catching potential bugs early and accurately measuring ad efficacy, ensuring the system performs optimally in production.
Prior to this project, the ads testing framework (Hera) relied on manually crafted requests, which often did not reflect the latest client behaviours. To address this, we introduced a request harvesting job that collects real production requests and replays them during regression testing. This approach ensures that the framework covers a broader range of scenarios and stays aligned with current use cases, significantly improving the quality of the ads platform.
Legacy approach to storing requests
Test cases for the ads validation system were stored in a database, but over time they became stale, requiring an engineer to manually run queries in Snowflake to update requests. This approach created a number of pain points, including:
- Old requests didn’t capture all use cases served by the ads platform. Because requests weren't refreshed for months at a time, the platform's stability and effectiveness were tested on outdated data, increasing the chances of misleading results.
- Populating the request repository required us to periodically run manual operations, thus deceased engineering velocity.
- We couldn’t test for specific situations due to a lack of configuration.
Automating request collection
To combat the problems with the legacy approach, we developed an automated request harvesting system that continuously stores shadow production traffic in a Snowflake table. By polling from a custom Kafka topic, the system gains access to real-time ad requests, which are then deserialised into protocol buffer messages, sampled, and inserted into Snowflake. This use of real-time requests ensures that the test cases remain current, effectively solving the issue of stale requests and allowing the platform to be tested with up-to-date data.
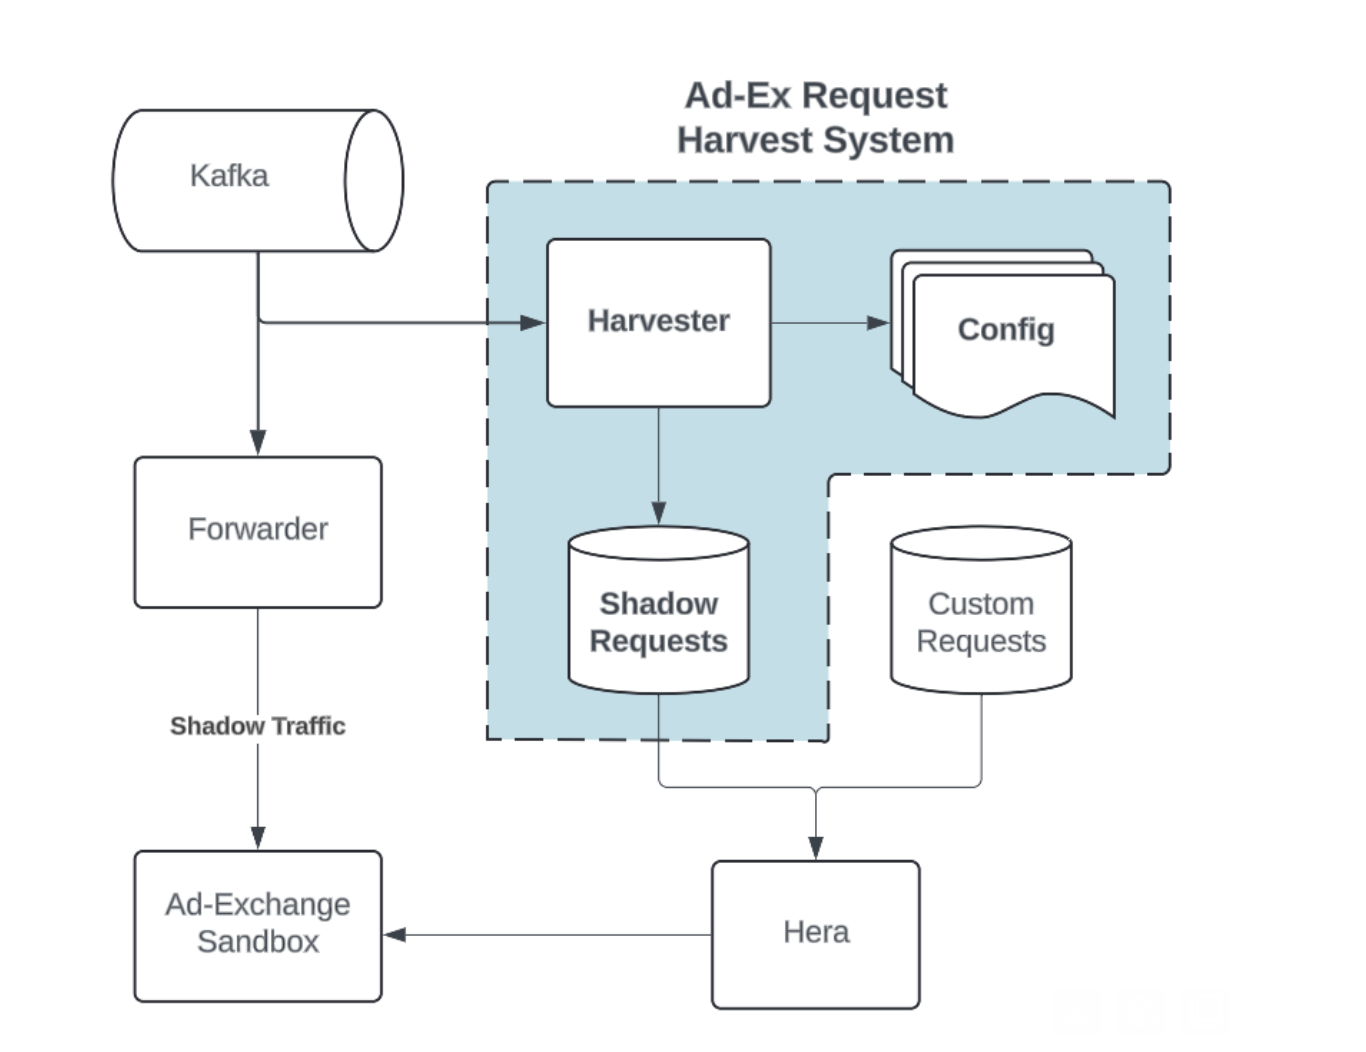
Figure 1 shows the architecture of the ads testing framework (Hera) and how the harvester interacts with the system. The Snowflake table that previously held all manually queried requests is still used, but now contains user-defined system tests for specific scenarios, for example alcohol delivery.
Configuration and monitoring
Automating request collection opened the door for configuration, a primary issue with the old system. Using variables from a runtime configuration environment allows us to customize behavior without having to directly change code. The configurable runtime variables are:
- sampleRate: the percentage of requests polled that will be saved in Snowflake
- tableName: the name of the Snowflake table to insert requests into
Because the harvester is supposed to run continuously with little oversight from engineers, it was important to add metrics for monitoring and alerts. The harvester's QPS, or queries per second, is displayed on the ads health dashboard; alerts are created when QPS reaches 0.

Impact
The ad exchange request harvesting system effectively resolves all pain points from the legacy model. Using runtime variables has increased testing configurability. Additionally, using real-time requests ensures that all use cases are thoroughly accounted for in our ads validation system. Because the system is fully automatic, we no longer have to populate Snowflake manually and engineering velocity has increased. Finally, by separating regression and system tests into two tables, we have improved system logic and structure.
Improving microservice support with kubernetes debugging assistant
By: Prina Doshi
DoorDash leverages Kubernetes to execute and support microservices. Each microservice team is responsible for managing the health of their own workload, but developers do not commonly understand how to troubleshoot with Kubernetes and resources for doing so are spread across a variety of locations. Without a centralized information resource, developers spend time searching for relevant guides and often rely on memorized commands from kubectl, Kubernetes’ command line API interface. Additionally, infrastructure engineers spend time helping developers troubleshoot their workloads, taking time away from other critical work.
After interviewing developers about their pain points and needs, we built an internal Kubernetes debugging assistant to help microservice teams understand and debug their workloads, improving developer latency and reliability.
Building a full-stack internal tool
To build the new tool, we extended an existing API and plugin on the internal developer console. Figure 1 shows the architecture of these interactions.
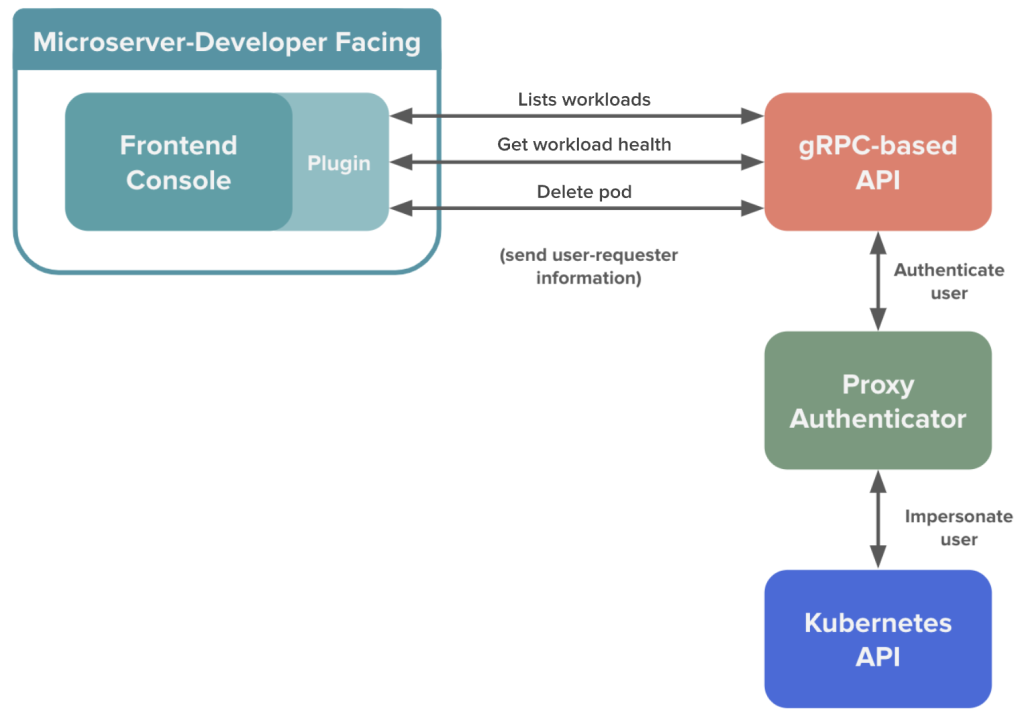
Currently, an API provides a centralized location for all Kubernetes interactions. We extended this gRPC-based API to act as an interface between the internal console page, authentication tools, and the official Kubernetes API. Expanding this API rather than making direct calls to the Kubernetes API creates an additional layer of abstraction between developer decisions and the underlying implementation with Kubernetes, which provides flexibility for future updates. Because many teams rely on this tool, we emphasized developing extensible data structures and implementing unit tests.
We expanded the scope of this API to include detailed information about the health of a Kubernetes pod or deployment using logic about the expected workload conditions, previous restarts, and number of replicas. We also included links to customized queries in our monitoring and logging applications, providing fast access to dashboards with workload-specific details. Finally, we included a mechanism to delete pods from a workload. In future, we expect to include additional workload actions, such as quarantining a pod.
On the front end, we leveraged the React-based developer console and expanded a Kubernetes plugin. The plugin allows users to view all the workloads associated with a given service, using calls to the API and passing along user information to ensure that developers are only accessing data for which they’re authorized. When a workload is selected, additional details about that workload’s health status are revealed. In the event a pod is failing, developers also can delete a pod through the console.
To ensure the project is healthy and available to developers, we created a Chronosphere dashboard to monitor metrics about the API, including request latency, gRPC error rates, and CPU/memory utilization. We also created alerts allowing the team to monitor any abnormal occurrences to ensure that the API serves requests within the expected timeframe.
Impact for developers
The new console reduces developer debugging time, saving hours that can subsequently be devoted to improving direct customer experiences. Information retrieval is simplified through a clean UI and interface, moving DoorDash toward a self-service model for Kubernetes infrastructure management. This also reduces the time developers must spend reaching out to infrastructure teams for troubleshooting assistance. Additionally, by abstracting interactions with Kubernetes through a console, we also can increase reliability for critical actions like pod deletion while recording detailed logging information about actions taken.