
Data-driven companies measure real customer reactions to determine the efficacy of new product features, but the inability to run these experiments simultaneously and on mutually exclusive groups significantly slows down development. At DoorDash we utilize data generated from user-based experiments to inform all product improvements.
When testing consumer-facing features, we encountered two major challenges that constrained the number of experiments we were able to run per quarter, slowing the development and release of new product features:
- Our legacy experiment platform prevented us from running multiple mutually exclusive experiments. As a result, there was additional engineering overhead each time we configured a new experiment. We needed to add more automation to the platform to enable faster and easier experimentation.
- Small product changes produce smaller and smaller effect sizes, sometimes down to a fraction of a percent. Combined with low experiment sensitivity, the ability to detect true differences in business metrics due to product changes, experiments require extremely large sample sizes and longer testing periods to detect a small effect with statistical significance.
Rapid experimentation and scaling up the number of experiments are essential to enabling faster iterations. To increase the number of experiments that could operate at the same time, we built a layered experiment framework into our test infrastructure, improving parallelization and letting us run multiple mutually exclusive experiments at the same time.
To increase experiment sensitivity, we implemented the CUPED approach (described in the paper, Improving the Sensitivity of Online Controlled Experiments by Utilizing Pre-Experiment Data, by Microsoft researchers Alex Deng, Ya Xu, Ron Kohavi, and Toby Walker), which made our experiments more statistically powerful with a smaller sample size. These efforts helped us quadruple DoorDash’s experiment capacity, which led to more improved features.
The challenge of running mutually exclusive experiments
Under our legacy experimentation system, it was challenging to run multiple mutually exclusive experiments since that would require a lot of ad-hoc implementations on client services. The issue we faced was that many of our experiments involved tweaking features that were related to each other or visually overlapped.
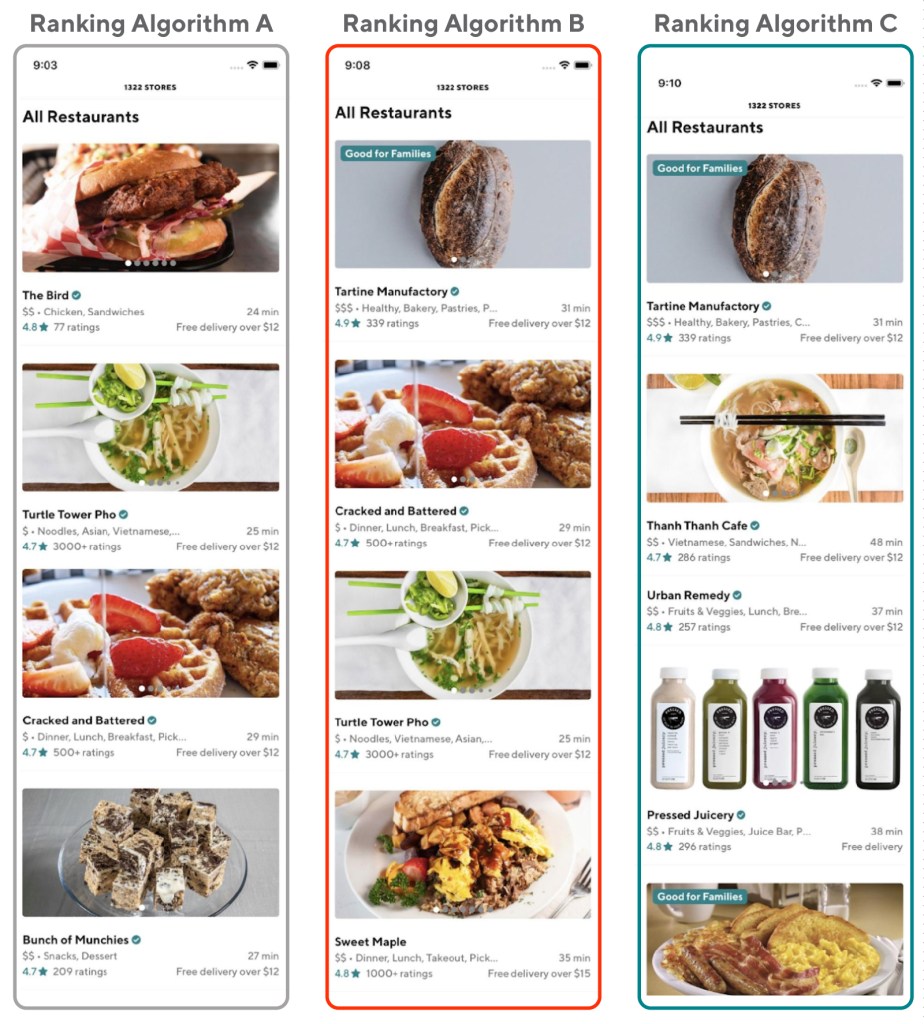
For example, the team wanted to run multiple experiments that showed different store rankings to users powered by different ranking algorithms. If a given user sees two ranking algorithms at the same time, it’s a lot harder for data scientists to figure out which one affected the user’s choice. Therefore, we needed an easy way to make sure users only saw one experiment at a time so we could easily identify which change was responsible for improved conversions.
The other big challenge with having limited experiment parallelization is that, to avoid experiment overlaps, we are forced to test sequentially, slowing down feature development. Under the legacy framework, where we had to conduct traditional multi-variants experiments sequentially, the whole process of testing different ranking algorithms could take several quarters to finish.
The other reason that a lack of parallelization hampers our development speed is that we need to satisfy the following criteria to have full confidence in each new feature we test:
Generalizability: For experiments with a large effect size that require a smaller sample size, we need to ensure that our sample is representative and provides unbiased statistically significant results. If the experiment duration is too short, we risk getting biased results. Consider how DoorDash’s business on a weekday might look different than on a weekend. If an experiment was conducted on weekdays only, the results may not be generalizable to weekends and thus will be biased.
To illustrate, let’s assume there are two experiments: A and B. Both have large effect sizes and therefore require small sample sizes. Without parallelization we would keep experiment A running for one week, despite it getting a large enough sample within four days of weekday traffic, to ensure the results are generalizable and not biased. The same process would need to be conducted for experiment B.
In total, both experiments would require 14 days if tested sequentially. With parallelization, we would run experiment A on 50% of users and run experiment B on another 50% of users (non-overlapping). Both experiments would run for a full week to ensure generalizability and would only require seven days to be completed.
Evaluate long-term business impact: Some experiments have long-term engagement success metrics. In order to know the long-term impact, experiments need to keep running, often for several quarters. If we cannot run experiments in parallel these requirements would significantly reduce our development speed, since each experiment must be conducted over such a long period of time.
The challenges of identifying smaller effect sizes
The other experimentation challenge we faced was dividing our traffic between experiments without critically reducing the sample size, or the equivalent statistical power needed to detect small improvements. After many years of improvements in product optimization, customer reactions stabilize and new product changes produce smaller and smaller effect sizes, often at the level of a fraction of a percent. Figure 2, below, shows a simulated relationship between the sample size and the minimum detectable effect (MDE).
Essentially, if we want to be able to detect small changes with statistical significance, we will need an exponentially larger sample size. Since such a large sample size is required for detecting the experiments’ effects, DoorDash’s daily user traffic can only support so many experiments at the same time. This sample size limitation reduces the number of experiments we can run at the same time, slowing down our development of new features.

Improving experiment parallelization with a layered approach
To solve our limited experiment capacity, the Experiment Platform team introduced Dynamic Values, a new experimentation infrastructure that allows us to easily configure more advanced experiment designs by defining a Dynamic Value Object, a mix of rules that describe what features should be enabled for a given user.
Today, the Dynamic Values solution enables stable and robust randomization to client services, as well as the ability to target values based on popular parameters such as region, as shown in Figure 3, below. This new infrastructure allows us to more easily build a random sample of users from everyday traffic and add the required targeting.

To illustrate how Dynamic Values improved experiment parallelization, here is an example of experiments that are related or overlap with others:
- Test 1: Store Sort Order Ranking Algorithm A, showing personalized store rankings optimized for Goal A
- Test 2: Store Sort Order Ranking Algorithm B, showing personalized store rankings optimized for Goal B
- Test 3: Programmatic Carousel Ranking, showing personalized carousel rankings instead of manual rankings
- Test 4: Tech Platform Infra Migration, a backend migration that moves all rankings in the search service to our Sibyl prediction service
Each experiment has a couple variants, as shown in Figure 4, below. Given that all the tests have code dependencies and test 1 and 2 are conflicting, as each user can realistically be exposed to only one ranker, we use a single-layer method to run them simultaneously and with mutual exclusivity. Since each experiment has a different sensitivity, success metrics, and short term versus long-term effects, we can optimize traffic divisions to maximize the power of each experiment.
This parallel experimentation structure allows us to easily scale the number of experiments in a decentralized manner without cutting the test duration of each individual experiment and ensuring generalizability. We divide our user base into disjoint groups and each group gets a specific variant of the treatment. For experiments with long-term business impact metrics that need to run for a long time, we assign a smaller user subset to keep the experiment running, and reserve the rest of the users for short-term experiments.

The tradeoffs of the dynamic values platform approach
The above approach allows us to quadruple the experiment capacity, compared to testing sequentially. Nonetheless, this approach also has some drawbacks:
- As the number of experiments increases, the traffic assigned to each variant gets smaller and each experiment will take a longer time to finish. In addition, managing the traffic splitting could become challenging as teams vie for a larger share of the available users to gain statistical power in their experiments.
- Given that the experiments do not overlap, we would need to create an additional experiment to test the combined experience and measure the interaction effects.
Solving these kinds of problems could involve:
- Launching concurrent experiments by extending the single layer to multiple layers, where each user can be included in multiple experiments, as shown in figure 5, below:

- Leverage covariates during the process of assigning users to different experiments’ variants instead of post-assignment. One common example is stratified sampling, where we assign users into strata, sample from each strata independently, and combine all results. Stratified sampling usually works better than post-experiment variance reduction such as post-stratification and CUPED, when we have a smaller number of units available.
- Improving foundational experiment infrastructure to support multi-armed bandit (MAB) models. For consumer experiments which often have a couple of variants, we want to focus on learning the performance of all variations and optimizing overall conversions/volume. MAB helps tune the balance between exploration and exploitation.

Improving experiment sensitivity with variance reduction methods
In general, there are three common options to improving an experiment’s sensitivity:
- Option I: Increase experiment sample size
- Option II: Test product changes with a larger effect size
- Option III: Reduce the sampling variance of success metrics
Our goal is to increase our experiment capacity and sensitivity, so we didn’t consider Option I, as increasing the sample size would hurt our efforts to increase experiment capacity. In addition, while the DoorDash user base is large, increasing the sample size is not always viable because some product changes may only affect a small subset of the user base, which naturally limits sample size. For example, while a lot of users might view DoorDash’s homepage, fewer users will examine the pickup map, which would limit the sample size for an experiment on that feature.
While we're always focused on high-impact product changes, it's also important to be able to measure the effect of smaller changes via Option III. Variance reduction attempts to reduce the variance of target metrics and increase the precision of the sample estimate of parameters. During an experiment’s analysis phase, common techniques include post-stratification and controlling for covariates.
The CUPED method was introduced as a type of covariate control to increase experiment sensitivity. At DoorDash, we found in general that pre-experiment metric aggregates (i.e. CUPED) work better than covariates such as encoded region features.
As shown in Figure 6, we explored different CUPED as covariates versus categorical covariates by using simulations to evaluate the impact of variance reduction by each covariate. For each covariate, we calculate the required sample size for a fixed amount of treatment effect and statistical power, and then compare the calculated sample size to the baseline method (usually through a t-test with clustered robust standard errors).
Using simulations, we found that the user level aggregate gives the most statistical power and is more effective in variance reduction and sample size reduction. Some other things we learned when trying out CUPED included:
- When users don't have historical data, we can use any constant values such as -1 as the CUPED variable. In regression, as long as the covariate (in this case the constant value) is uncorrelated with the experiment assignment, the treatment effect estimate between control and treatment will stay the same with or without the covariate.
- The stronger the correlation between the covariate and the experiment success metric, the better the variance reduction, which translates to an increase in statistical power and a decrease in sample size.
- Be cautious of singularity problems when using too many pre-experiment variables.

Future work in experiment sensitivity improvement
Recently DoorDash upgraded DashAB, an in-house experimentation library, and Curie, our experiment analysis platform which incorporates advanced variance reduction methods. Curie significantly improves the convenience of applying variance reduction methods and improves the experimentation sensitivity. To further improve the experiment analysis accuracy and speed, we plan to integrate stratification to increase the statistical power.
Conclusion
Online controlled experiments are at the heart of making data-driven decisions at DoorDash. Small differences in key metrics can have significant business impact.
We leveraged Dynamic Values, our new experiment infrastructure, to unlock experiment parallelization and launch experiments with a sophisticated design. At the same time, we adopted advanced analytical methods to increase experiment sensitivity that detects small MDE and concludes experiments more quickly.
We quadrupled the consumer-facing experiment capacity. Our approach allows more precise measurement, running the experiments on smaller populations, supporting more experiments in parallel, and shortening experiment durations. This approach is broadly applicable to a wide variety of business verticals and business metrics, while remaining practical and easy to implement.
Acknowledgements
Thanks to Josh Zhu for his contributions to this project. We are also grateful to Mauricio Barrera, Melissa Hahn, Eric Gu, and Han Shu for their support, and Jessica Lachs, Gunnard Johnson, Lokesh Bisht, Ezra Berger, and Nick Rutowski for their feedback on drafts of this post.
If you are passionate about solving challenging problems in this space, we are hiring Data Scientists and Senior Business Intelligence Engineers, as well as several other leadership roles on the team. If you are interested in working on other areas at DoorDash check out our careers page.