

Well-crafted decision graphs help DoorDash agents solve issues quickly and accurately, giving our customers a best-in-class experience. No matter how efficient we make our logistics platform, the reality of supporting the complex interaction of restaurants, consumers, and Dashers, our term for delivery drivers, inevitably gives rise to issues, such as late deliveries or order mix-ups. Our agents leverage our customer service platform to resolve these issues satisfactorily.
As a logistics platform, we focus heavily on the customer experience. When dealing with food delivery, it's always a larger problem than just a support issue, as a Dasher might miss a payment, a restaurant’s reputation might suffer, or a family may be left waiting for their late dinner.
Solving delivery issues involving a combination of consumers, Dashers, and restaurants makes everything more complex. There is room for error as different agents can provide different resolutions for similar issues. This is where decision graphs help improve the customer experience. We start by identifying the most frequent issues and create decision graphs that, in most cases, help our customers solve their own issues, while also allowing our support agents to step in if needed and deliver consistent solutions.
These decision graphs are built to simplify the checks that the agent does in order to arrive at a resolution. The agents can then focus on spending quality time with the customers and provide an accurate resolution and a great support experience.
Unstructured customer support causes inconsistent solutions
In the midst of DoorDash’s growth and entry into new markets, ensuring a positive customer experience for consumers, Dashers, and restaurants remains a priority for our business. As we continue to grow and onboard new customer support agents, we need a way to standardize and improve the support experience, allowing our agents to become proficient quickly to allow faster and better customer resolutions.
Previously, agents had to constantly switch back and forth between knowledge base articles, our documentation about delivering first class customer support, and internal tools to process the instructions in the article. Resolving customer cases can be complex, leading to potentially many paths and tools an agent could use, leaving an inconsistent customer support experience. Agents were also required to go through time-consuming manual check lists that could have been automated.
Determining our needs
Bringing our customer support up to a scalable, best-in-class standard led us to consider some type of state machine engine because of the nature of sequential steps in support cases. We investigated other prebuilt alternatives, such as the Camunda automation platform, versus building our own. We ultimately decided to build a platform powered by our own decision engine because our highly complex business required a highly customizable, extensible, and iterable solution. This platform enables us to spin multiple decision graphs and execute them efficiently.
For our platform, we identified the following requirements:
- Decision engine: A powerful engine which provides a mechanism to process and execute our decision graphs
- Reusable library of actions: This library contains the steps that trigger resolutions.
- Automated step processing: This mechanism activates the series of steps in each decision graph.
- Ease of workflow creation: Agents can develop new decision graphs.
- Customization: Decision graphs can easily be modified to respond to new issues.
- Internationalization: Decision graphs support multiple languages.
- Traceability of steps: Engineers can easily trace and debug any step in the decision graphs.
Defining a decision graph
Decision graphs guide agents to a resolution given the context of a particular problem. These graphs are primarily built on decisions and consequences. Decisions are nodes in the graph that guide the user to a resolution. The outputs determine the next decision the graph needs to take.
Some decisions are manual, requiring customer interaction, while others are completed automatically by the decision graph. By traversing a set of decisions, the agent reaches the resolution. Consequences are side effects that occur as a result of visiting a particular decision.
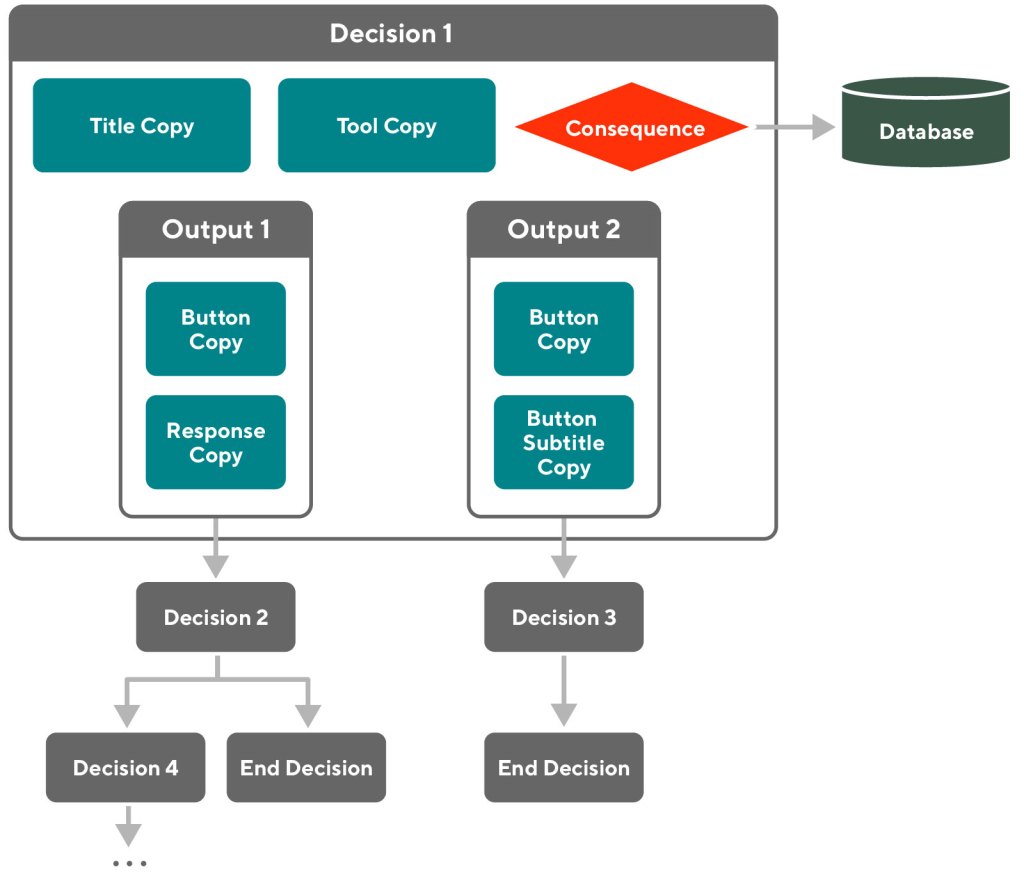
Decision: A decision is a node on the graph that represents a question from the agent or the consumer. At the start of a decision graph, the situation is usually very vague, but each question, such as “How late was the order?” or “Does the customer want their order redelivered?”, leads us to the right resolution.
Output: An output helps link a decision to the next decision, which can either be automatic or manual. The output leads to a more granular question/decision than just knowing, for example, that an order was late.
Consequence: A consequence is a side effect that happens when we visit a specific node. In the example of a customer desiring a redelivery as a resolution, a node for this option will fire off calls to create a new order cart with the same items and send the consumer a notification that their new order has been received.
Inputs: Inputs are dynamic values for the decision nodes that will be supplied to the consequence functions. These can range from some values we want to check from the consumer, such as verifying their address, or updating payment information for the Dasher.
Requirements: Requirements are fields on the nodes that can limit portions of the decision graph to the consumer or the agent. This enforces prerequisites on steps depending on specific conditions. For example, we would only want to provide a redelivery if the store is still open.

Copies: Lastly, copies allow decision graphs to be used for any language. This element renders dynamic texts that are relevant to the current order so our decision graphs can scale internationally.

Standardizing decision engines through modularization
A decision engine can determine if the order has to be cancelled, if the consumer needs to be refunded, or if we need to issue credits. It determines when to pull store information, check the Dasher status, and gather necessary information from other DoorDash services and process consequences.
As the decision engine gained traction on our platform, we built more reusable components that helped our agents resolve issues with higher customer satisfaction. We stored all our reusable components in a shared library so that agents could choose to use an existing decision instead of engineers having to create a new, duplicative one.

Another benefit of this engine is that we can constantly iterate and roll out changes to agents quicker. We are able to receive feedback from agents on what steps in the decision graph can be removed and what we should add. We can then test and incrementally roll out those changes and guarantee the agents use the newer version rather than relying on old steps from an outdated knowledge base article.
To YAML or not to YAML
We initially chose the YAML format for our new decision graphs due to it being the standard language for configuration files. However, we ran into formatting issues that broke deployments, and so we did not have a way to safely deploy a new decision graph or feature flag changes. The YAML format also made it difficult to visualize the graph structure of the decision graph.
Another challenge with this approach was that complex knowledge base articles led to very complex YAML files. This complexity made it particularly difficult to debug decision graphs experiencing validation errors.
Results
After implementing our decision graph platform, we saw immediate improvements. Agents were able to help resolve customer issues up to two minutes faster with the new platform. Customer satisfaction also improved as resolution time decreased and customers received appropriate assistance. Agent satisfaction improved as finding and using the appropriate decision graph was easier than using knowledge base articles.
Conclusion
We created decision graphs for our customer support agents after being exposed to the pain points they experienced using our previous flow. This new approach was successful in ensuring quality and speed for many customer flows. We are continuously iterating on our manual processes to build the next automated decision platform minimum viable product (MVP).
Companies offering services to consumers, contractors, and businesses at scale may find their customer obsession systems quickly fragment as agents respond to differing issues. Taking a step back and analyzing these issues can reveal many commonalities, offering the opportunity to set up decision graphs and modularize responses. Initiating decision graphs in this manner leads to more uniform and efficient solutions.