
Managing inventory becomes a serious challenge when transitioning from food delivery — where the item ordered is prepared on demand — to grocery and alcohol delivery. DoorDash has expanded its service well beyond the restaurant space to deliver a variety of goods from retail outlets (or physical stores) with offerings that span across produce, meats, toiletries, snacks, alcohol, and myriad other categories. The outlets from which we deliver these products range from small local stores to large supermarkets. These outlets maintain inventory data in a wide variety of systems, including everything from a simple spreadsheet to far more sophisticated solutions such as an inventory planning system.
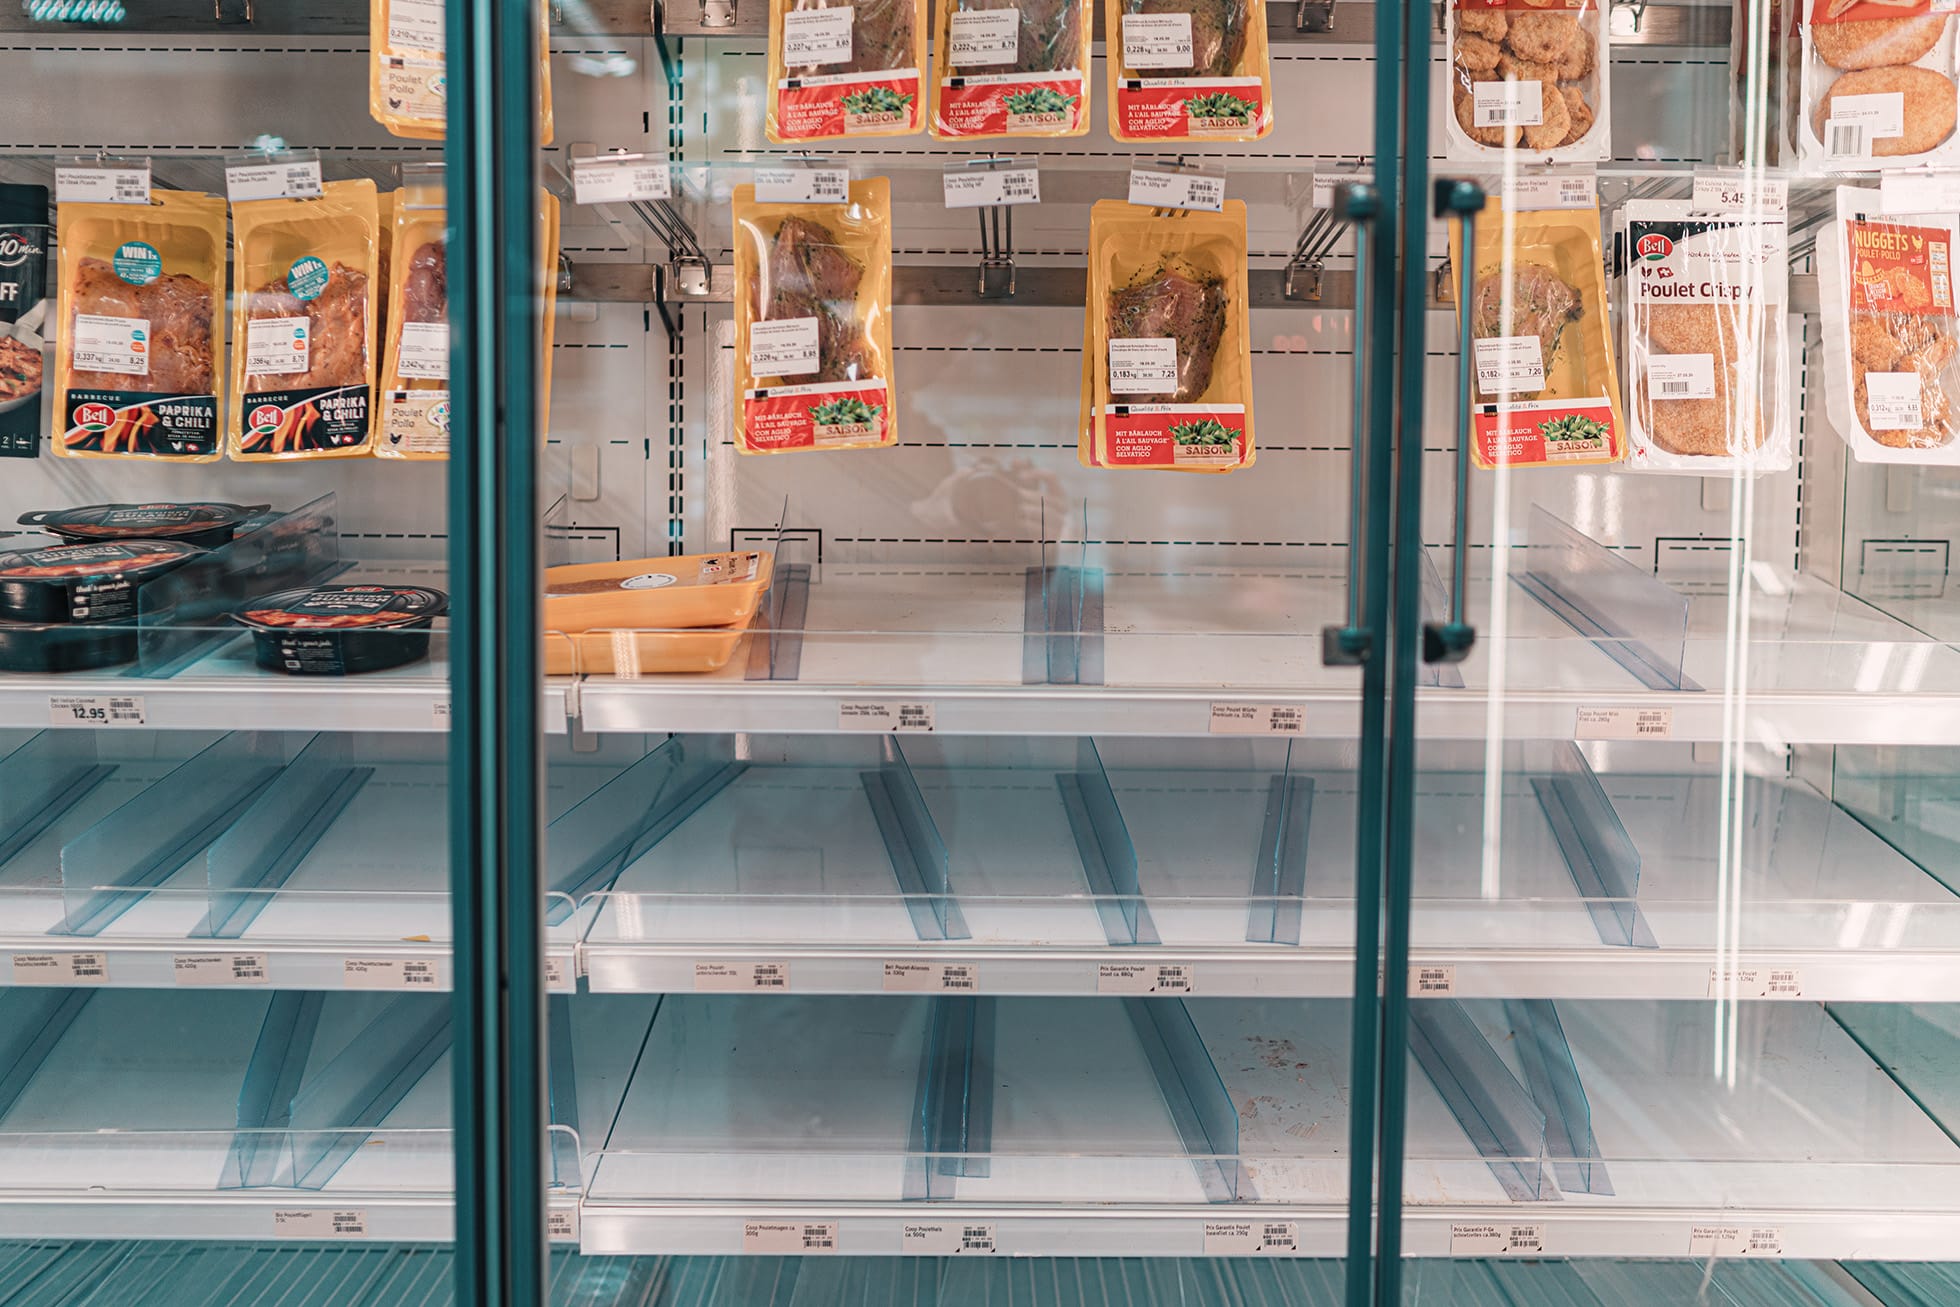
Overall accuracy of inventory data at any given point in time usually falls well below 100% because of items being out of stock, discontinued, or caught up in supply chain issues. Inventory management, far from being a DoorDash-specific issue, is a universal problem across the new digital grocery and convenience industry. When shopping in a physical store, customers can deal with limited inventory by buying substitutes, driving to a different store, or changing their mind about what they wanted to buy in the first place. For online ordering, customers' expectations are higher because seeing an item within the ordering UI implies that it's in stock. To provide a frictionless shopping experience, we must have high confidence that items will be on the shelves before we show them to customers. If an item is out of stock, we need a suitable way to allow customers to substitute an alternative item.
This blog post tackles the first part of the problem: reducing the variability of whether an item is in stock so that customers can order with confidence. We must solve several complex problems as described below before we can translate limited data with a low probability of being correct into a customer promise of getting what’s ordered.
As we solve these problems, we can extend inventory accuracy as a service for merchants across our verticals. Ultimately, we can help all customers by sourcing signals to clean up inherently inaccurate data, regardless of whether they are shopping on DoorDash or on the merchant’s website.
The four hurdles to presenting accurate inventory
On the engineering side, there are four challenges we need to overcome to build an accurate inventory presentation layer:
- Collecting the right data: How do we get accurate signals about inventory levels, especially when there is so much inconsistency in existing technology and merchant size
- Classifying, cleaning, and ranking data: After we collect meaningful data, we must decorate, filter and manipulate it to meet our needs
- Predicting and propagating inventory state: Given our system inputs and that real-time inventory levels are beyond our current capabilities, we must project what inventory levels will be during certain periods of time
- Simplifying data for consumption during shopping: Once we have a predictive model, we need to showcase this information to consumers in an easy-to-understand manner
The variability of people, processes, items, and supply chains makes it difficult to establish a single process to collect data for every item across all stores. Some stores sell only a few hundred items, while others might have nearly one million SKUs. Individual merchants may have many stores that share the same inventory system, making it easy to get bulk data from a single integration. Conversely, some merchants may need to integrate or manage data for each store separately. Either way, it’s important to note that each physical store has its own unique operational challenges related to the specific people who manage that store, specific challenges of the local supply chain, and numerous other ground-level concerns. So, even when we have a single integration that provides inventory data for thousands of stores, we cannot treat coverage or quality as consistent across all stores.
While the first challenge is lack of merchant uniformity, there is a similar concern around items for sale, which can have drastically different shelf lives. While a bottle of wine may be able to sit on a shelf indefinitely, perishables such as milk or freshly baked bread must move quickly. Shorter shelf lives generally mean lower inventory levels. The variable nature of shelf lives increases the complexity of managing store inventory because perishable items likely will sell out faster than non-perishable items. This means that data collected at one point in time within a physical store — regardless of size and technical maturity — cannot be considered valid at a different point in time.
Collecting the right inventory data
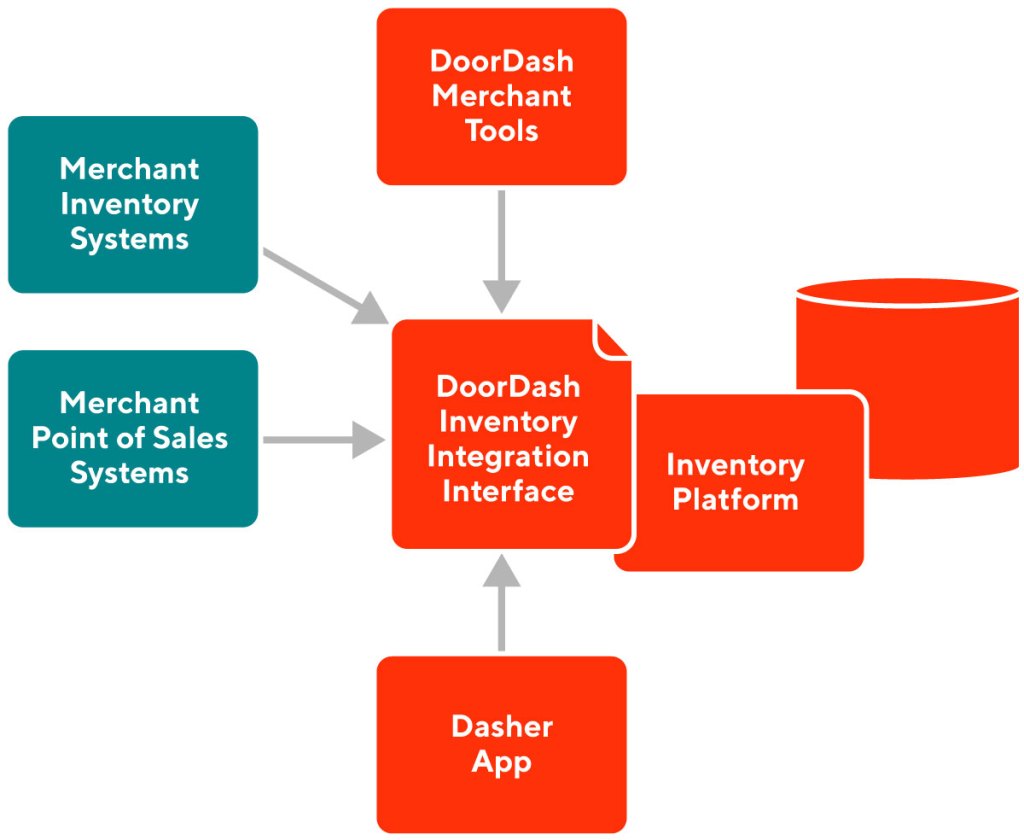
To address the gap between data collected and the actual state of inventory when a customer places an order, we can — in theory — attempt to go toward more real-time data. To do that, we must ensure that all merchant processes are recorded electronically, including receiving inventory, putting inventory on shelves, and removing items from shelves. But this is not feasible in light of the large operational and capital investments that would be required. Instead, we must optimize use of the data that we can collect and extrapolate inventory states from that. As shown in Figure 1, we collect inventory data in the following ways:
- Through data integrations where merchants can provide bulk data about their inventory
- Through ad hoc updates from operators or merchants
- By collecting Dasher reports about out-of-stock items
- Through asking Dashers to take photos of shelves in stores
By collecting partial or incomplete data from across multiple sources and then reconciling that input within a comprehensive inventory dataset, we unlock the ability to crowdsource inventory data for a physical store. Already, we are collecting hundreds of millions of inventory data points from these disparate sources. Our next step is to clean, rank, and classify this data into a unified dataset to gain a comprehensive picture of a store’s inventory.
Classifying, cleaning, and ranking data
Diving into this pool of data, we use a variety of techniques including online machine learning models and offline analysis to build opinions about which sources of data are most trustworthy.
Our models also help us understand historical trends for discrete items such as restocking windows and out-of-stock windows for items. We use higher confidence signals — such as a Dasher or a customer reporting that an item was missing — to grade/rank other sources of data that may be relatively stale, such as inventory data coming from an integration.
In addition to deciding automatically which data sources to ignore or highlight, we also expose data that is not high-confidence, which helps identify gaps and clean up the entire data pool.
Brute force approaches cannot scale at this level of complexity, which requires dealing with hundreds of millions of inventory combinations while managing historical data in a way that allows both automated and manual downstream systems to leverage the data efficiently.
Once we have clean and classified inventory snapshots, we can use them to predict future inventory levels, for instance during peak customer purchase windows.
Predicting and propagating inventory state
Armed with clean data and confidence rankings for data sources, we can feed inventory prediction models with such inputs as existing inventory data, Dasher feedback, and order history to create our own inventory projections to present to customers.
We must keep in mind two significant complexities:
- We are using data of varying quality to generate predictions from large data sets of inventory history and Dasher feedback. For example, we get millions of Dasher inputs weekly about inventory levels across our network.
- We are striving to predict inventory levels quickly enough to have a positive impact on customer experience; predicting things in an untimely manner, of course, does not solve our problem. Having timely predictions means that models should either be able to pre-compute inventory projections or run in near-real-time to respond to user queries. Currently, we have chosen the pre-computation approach as shown in Figure 2.

Through cleaning data and predicting inventory availability, we can achieve fulfillment accuracy of nearly 90%. In other words, in nine out of 10 attempts, we can find the exact ordered item in-store and complete the delivery. We are working on models to improve this even further using a variety of signals from our Dashers, merchants, and customers. In the meantime, we bridge the remaining 10% gap through giving customers the opportunity to select alternative items or substitutes as they shop. For example, a customer can choose an alternate brand of whole milk if the exact item they selected isn’t in stock. These combined solutions allow us to counter unreliable and stale inventory data.
Going forward, we also plan to start modeling item quantity so we can make better predictions such as “we have enough stock to last the next few days” to compensate for lack of other signals.
Simplifying data for consumption during shopping
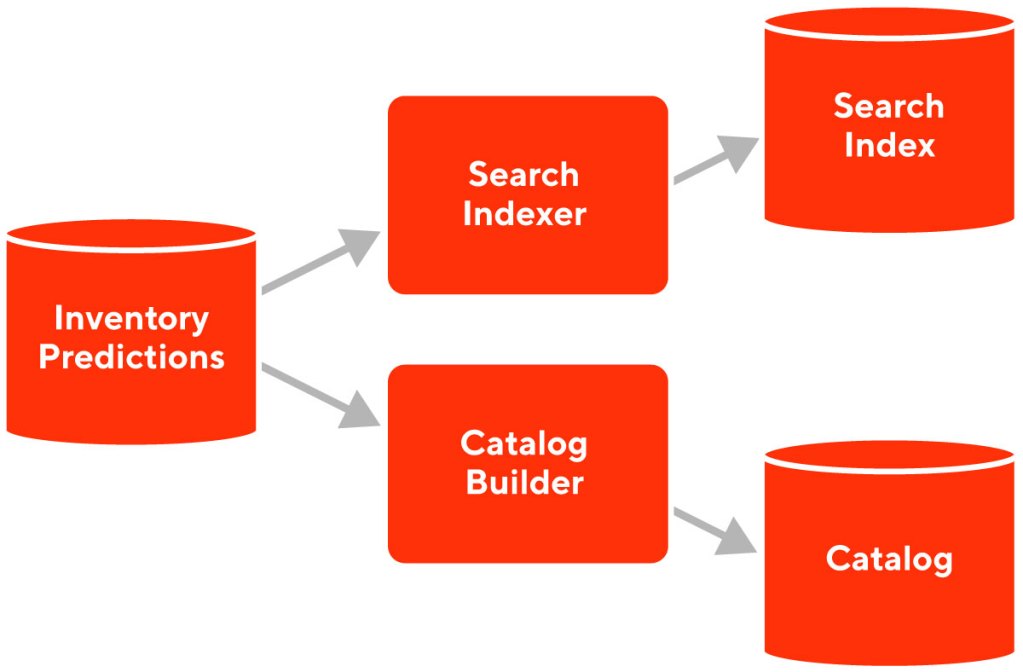
Ultimately, we feed inventory projections into search indexes that hide or down-rank items with a high unavailability risk. This search-ranking feature lets customers make selections with confidence instead of worrying that items may or may not show up.
As shown in Figure 3, dynamically projecting inventory is a complex process that requires we only use temporally valid predictions to modify customer search and browsing experiences.
While we have a workable initial solution today, we have a long way to go to build a near-real-time cycle that includes collecting real-world data, maintaining a searchable dataset of valid inventory predictions, and exposing the results in a rich way to let customers make the best choices for their needs. Stay tuned to learn more about how inventory projections evolve at DoorDash!
Conclusion
We have moved from making inflexible data source choices where we were chasing a near impossible task of finding a single great source of inventory data. Today, we rely on crowdsourcing bits of high quality data, predicting from historical data, and filter out unreliable inventory data. So that even in an imperfect world with incomplete information about what is in a retail store, our customers can shop with confidence - and get their groceries, convenience, pets, alcohol and other products delivered to their doorsteps.
Going forward, we believe we will improve our techniques for capturing more opportunistic signals as we help merchants develop their capacity to maintain higher-quality inventory data.