
DoorDash offers an immersive internship experience where all our interns fully integrate with Engineering teams in order to get real industry experience that is not taught in the classroom. This is the second blog post in a series of articles showcasing our 2022 summer intern projects. If you missed the first article the link is here. You can read about each project below.
Contents:
- Scaling Task Scheduler For Async Flows- By Taige Zhang
- Improving the Grocery Search Experience with Query and Index Normalization- By Shuyang Wu
- Empowering Tagging Food Items and Merchants with the Clustering Taxonomy Candidates and Release Pipeline- By Zhiyang Zhang
- Optimizing and Migrating the Dasher Announcements System Out of Nimda - By Andy Jiang
- Building a Log Analysis Tool to Improve DashMart Operator Experience - By Kenny Chi
Scaling Task Scheduler For Async Flows
By Taige Zhang
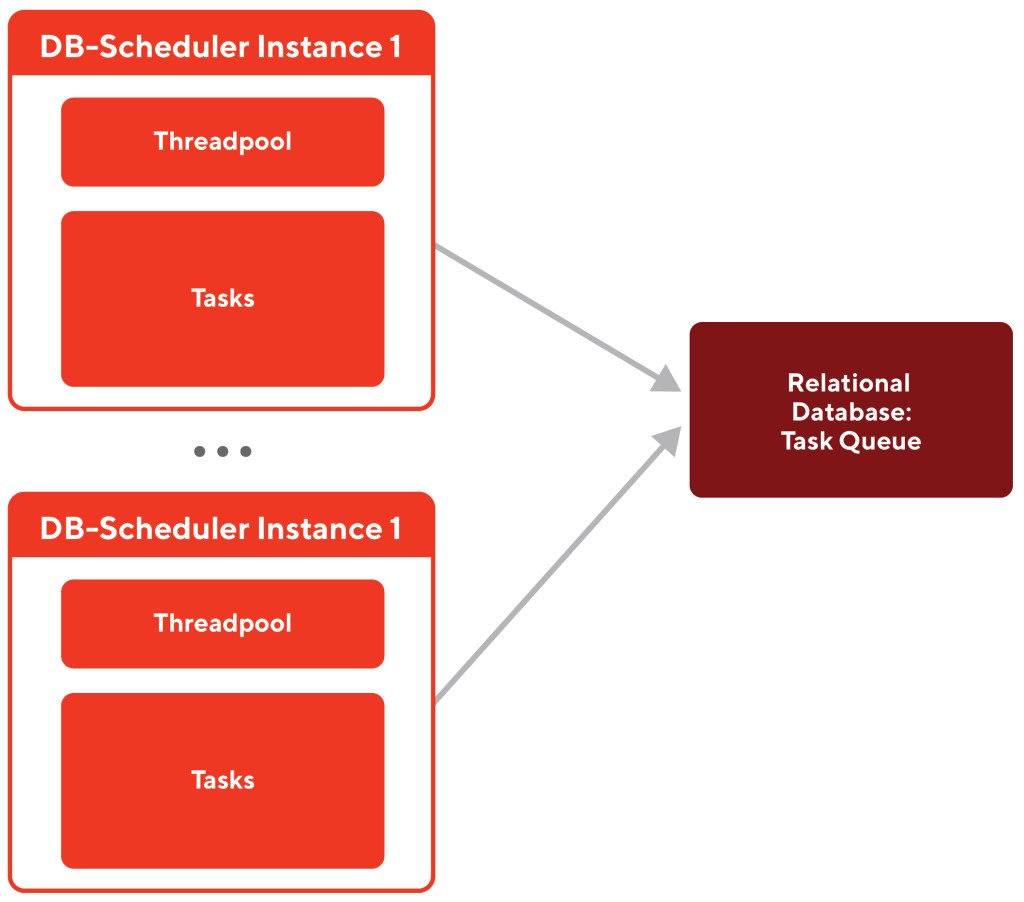
Db-scheduler is an open-source task scheduler, which utilizes the relational database as a task queue and supports multiple scheduler instances to cooperate to do job scheduling. Db-scheduler uses a simpler data model and is more scalable than other alternative solutions, such as Quartz.
Db-scheduler was DoorDash’s chosen scheduling technology when building our Cart Abandonment flow (additional use cases are WIP), which notifies users who have added items to their cart but did not check out. Our goal was to improve the async task execution capabilities for db-scheduler so that it could scale out the throughput.
A diagram of the structure of db-scheduler is displayed in Figure 1 below:
Why we need async task execution for scheduling
In today’s micro-service oriented architecture, a typical task is usually dependent on a set of external microservices, which implies a task may contain one or several async operations (e.g., gRPC calls). Unfortunately, the legacy db-scheduler DoorDash was using is based upon the blocking threadpool execution model. Threads remain blocked during the whole task duration. If a task contains async operations, it will simply block the thread, a process that appears to be inefficient in comparison to the non-blocking model, which allows the scheduler to utilize better thread resources instead of wasting threads waiting for tasks to finish execution.
How we improved asynchronous task execution capabilities
Our strategy for improving the scheduling efficiency through better task execution involved introducing future-based task execution APIs (major API change shown in Figure 2), to decouple the task scheduling (threadpool) from task execution (having async operations).
To be more specific, we leveraged CompletableFuture to make schedulers accept pending results from task executions so that tasks can be executed asynchronously. This would result in another advantage, as CompletableFuture is compatible with Kotlin Coroutines. For example, if we have a Deferred object, it is easy to transfer it to Java CompletableFuture with the built-in method Deferred { … }.asCompletableFuture().

Results
We conducted load tests to confirm the performance of our improvement. We used an example async task which contains a one-second delay simulating async calls. Check the core code snippets in Figure3:

Tests were run with multiple configurations to measure the throughput (execution/s) of both original and future-based db-scheduler:
- PostgreSQL was used as the database.
- The container host had 12 physical cores.
- The lower limit was 4.0 and the upper limit was 20.0. These are parameters controlling the number of due task executions fetched by each batch.
- Every scheduler instance was running on a separate container using lock-and-fetch strategy which has been proved to have better performance when there are competing schedulers.
- Tests were performed with different numbers of threads (20, 100, 300).
After running some tests, we were able to test whether we had succeeded in increasing task execution throughput. From the test results shown in Table 1, we can see that there is a big jump in performance. Under the same configuration, the throughput of the future-based db-scheduler is much larger than the original version, up to nearly 27 times when there are four competing scheduler instances each with 20 threads. Furthermore, the throughput of the original db-scheduler is highly proportional to the number of threads. The future-based db-scheduler, however, is not linearly related to it. These results indicate that we succeeded in decoupling the task execution from the scheduling process.
In addition, to reach 285 TPS, the original db-scheduler needs 300 threads, while our version can outperform with even just one thread. Since threads occupy memory resources, this comparison shows the potential of significant memory overhead reduction.

Conclusion
In summary, we made an enhancement to db-scheduler by introducing future-based major API changes. Performance tests have shown that our improvement can significantly increase task throughput and reduce the occupation of system resources. Now, the future-based db-scheduler is more competent for high concurrency scenarios with long-running tasks and scalable systems. Our work would lead to a win-win situation. What we did can bring benefits to db-scheduler and the whole open-source community, since this is a critical change.The new db-scheduler will also boost performance for DoorDash specific use cases such as cart-abandonment.
Improving the Grocery Search Experience with Query and Index Normalization
By Shuyang Wu
Part of providing a quality product discovery experience includes showing customers the products they are looking for, but that can often be easier said than done. Sometimes DoorDash’s search engine shows different results with similar queries, which is not a good search experience because queries with the same search intent should show the same results. This lack of uniformity comes from the fact that we do not add normalization when running ranking and precision models. Lack of normalization also increases the sparsity of features we use in the model, which can lead to unoptimized search results. Normalization takes the core meaning of a word, while ignoring the form (e.g. pluralization, tense, etc). With proper application, implementing normalization can improve search results for customers.

Why lack of normalization creates a negative search experience
For queries like “grape” and “grapes”, it's likely that customers have the same exact search intent, and therefore should see the same results . However, sometimes our search results differ a lot for these two queries. As Figure 1 shows, if customers search for “grapes” but not “grape”, there are fewer options to choose from. Since the queries have the same search intent, they should show the same results and not have a significant drop off.
This begs the question: why aren’t our searches showing the same results? In Elasticsearch(ES), we have internal normalization that turns both “egg” and “eggs” to “egg”, so items retrieved from that query in ES should be the same. The normalization problem occurs during the ranking and filtering part of the process that is executed after retrieval, which is where we were mainly focused. The normalization happens in ES, but the search service gets documents with original unnormalized fields. Thus we are using the original queries and item fields to calculate the model’s lexical text features, and then different results are shown to DoorDash consumers. Lack of normalization also affects the quality of these text features and decreases general search relevance, because without normalization, we would consider different words and different forms of the same word equivalent, and furthermore increase the spasticity of the features and lead to poorer results.
To measure the performance of importing normalization and whether it could improve the search experience, we would mainly use the following four search-based metrics for the evaluation:
- Add To Cart rate (ATCr): the percentage of searches that ends with a Cx adding an item to cart.
- Click Through Rate (CTR): the percentage of searches that ends with a Cx clicking an item
- Perfect Search Rate (PSR): the percentage of searches that ends with a Cx adding an item in the first 10 search result positions to their cart
- Null Search Rate (NSR): the percentage of searches that end with zero results being shown to a Cx
How to implement normalization
For the implementation, the basic idea is to extract normalization out of Elasticsearch. We implemented our own normalization methods based on the same Apache Lucene features we use in ES. To apply the same methods to query and item fields for matching them, we added the normalization before sending to ES on the retrieval side, and also when enriching menu and catalog data on the indexing side. Then after the match happens in ES, we could get items with normalized fields to calculate text features.
At DoorDash we would like to get early results to prove the hypothesis with minimal effort. Also since populating fields for each item in ES is time-consuming and it is hard to remove the added fields, it is not a good idea to directly test on ES. The implementation was divided into three steps
- We first tested different normalization methods locally, manually filtering out those that have high latency or poor performance.
- After that, we applied the rest of the methods after the retrieval for lightweight comparison. With a slight elevation of the latency, we normalized the query and all item fields during the searching time, so we could use them to calculate and improve text features. Then we ran the online experiment and found the most suitable normalization method in grocery scenarios.
- The final project milestone was to move normalization from runtime to indexing. To reduce the latency, we used the selected normalization method to populate normalized names and descriptions of items in index documents, so we could directly access them without calculating in runtime.
Customizing normalization in a grocery scenario
Besides having optimized model features and stable results for customers, implementing our own normalization could also give us the ability to better customize normalization in the grocery scenario. At the start of the project, based on what we were using in ES, we proposed a dozen different normalization algorithm combinations, and selected the best one after rounds of experiments.
Also with customization, we removed accents in non-English Latin language, so customers could get items in “creme” and “crème” when searching for either of them, which meets the typing habits of different people, solves the issue of mistyped item names, and also help people search for non-English words in the United States like ”jalapeño” or “L'Oréal.” We also normalized the punctuations, including merging straight and curly quotes, and turning some common symbols into their name for more accurate matches in ES.
Interactions with other search service features
Search is not limited to matching the query and items, we also provide other features to better customers’ search experience. To make sure each feature functions, it is also important to consider the interactions between normalization and these features.
- Spell Check - fix typos automatically. Normalization aims to work on correct words, so it should be executed after spell check. As we allow customers to disable spellcheck, which means customers would like to search exactly what they typed in, we should also disable normalization and avoid editing the query.
- Synonyms - search related items. Synonyms work in ES, so we should avoid normalizing and changing the query in the synonym list or the synonym search won’t be triggered. And thus we need to maintain the same synonym list in the search service as in ES.
- Autocomplete - make typing easier. For the same reason as the spell check, since autocomplete tends to work for partial words, we should disable normalization in this situation. When customers click autocomplete query suggestions, which are provided by us and correct, the spell check would be disabled and so would it be with normalization.
- Languages - As the proposed normalization method aims to work in the English context, initially we plan to limit it to English searches. But by providing accent removal for non-English searches, we observed significant improvement in metrics from the experiment. So we plan to keep it for all searches.
Result
According to our experiment, with the newly proposed normalization, we could observe a decreased NSR of around relative 3%, slightly increased ATCr and CTR with around relatively 0.5% and neutral PSR. What’s more, with limited data for non-English searches, we could observe a significant improvement of 20% decrease for NSR and 13% increase on PSR, and neutral ATCr and CTR. Also we didn’t observe a notable latency increase for grocery search after we added the normalization.
Empowering Tagging Food Items and Merchants with the Clustering Taxonomy Candidates and Release Pipeline
By Zhiyang Zhang
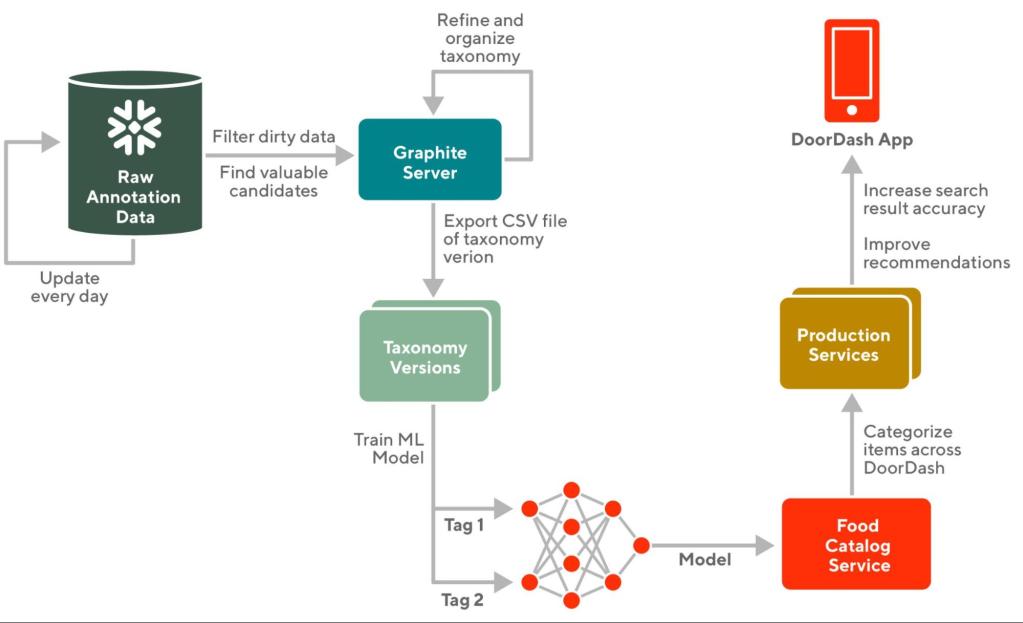
DoorDash’s dedicated food catalog service uses ML models to tag food items and merchants across the platform, which improves the accuracy of search results and recommendations.To build a predictive ML model that powers these categorizations, we need to provide the ML team with taxonomy data that has enough coverage. Previously, we had a manual process which required a huge effort to provide the ML team with taxonomy data and could result in numerous human errors. To extend the coverage of our food catalog taxonomy more efficiently and to provide the single source of truth for taxonomy, we needed an automated pipeline to import and release jobs. Automating these processes and providing APIs would enable our taxonomy team to focus on the more pressing job of refining and expanding the taxonomy actively.
The problems with the legacy taxonomy expansion workflow
Previously, outputting a mature taxonomy version (a collection of taxonomy that are good to release) needs a lot of involvement from the taxonomy team:
- First, building a taxonomy meant manually filtering dirty data to find valuable candidates, which are the food items liked by many people but not existing in current taxonomy. This process started by separating the valuable taxonomy candidates from the raw data every day.
- Then after the taxonomy candidates are imported to Synaptica's Graphite (our taxonomy organization platform), the taxonomy team reviews and organizes them into mature taxonomy versions.
- Once the taxonomy is updated, that new version needs to be updated in our taxonomy services database. This process involves the manual export of the taxonomy as a CSV and manual upload into the taxonomy Snowflake table.
Now, the updated taxonomy is in the database, and the ML team can use the latest taxonomy to train the model and food catalog service can tag existing food items or merchants using the model.
Below in Figure 1 is a breakdown of what this process looks like.
The whole process described above is time-consuming and it has several problems:
- Low efficiency and low scalability: The taxonomy team hopes to have active expanding of taxonomy. This process is too slow for rapid iterations
- Lack of releasing pipeline: The ML team relies on the taxonomy to train models and the food catalog service needs to consume it as well. We lack a way for teams to easily import and utilize the newest version
- Ad-hoc versioning: Version control is also manual and not centralized. It’s hard to map between the taxonomy version and ML model version when we update new versions of the taxonomy.
Daily runs ETL process for clustering taxonomy candidates and an API for releasing mature taxonomy versions
To solve the efficiency, reliability, and manual issues mentioned before, we built an ETL job that runs on a daily basis for clustering taxonomy candidates and also built a gRPC endpoint for releasing mature taxonomy versions. This pipeline will liberate our taxonomy team from the painful importing and the exporting process.
In the importing process, we run an Airflow ETL job every day to get the raw data, and then use clustering algorithms to find popular candidates (the food items liked by many people but not existing in DoorDash taxonomy). Afterwards, we can import all these candidates to Graphite through its API.
In the exporting process, the taxonomy team can make a simple gRPC call, and then our taxonomy version management service will record release information, which enables tracking and managing history versions. Finally, our service will write the mature taxonomy versions to the Snowflake table that provides taxonomies as the metadata of training ML models. Our service can write multiple versions concurrently.
In this way we can automate the highly manual aspect of the taxonomy data collection and filtering.

What is clustering and how to find the popular taxonomy candidates?
In the tens of thousands of raw annotation data, many data have little difference and represent the same taxonomy. In order to find such a taxonomy, we need to cluster these similar data into one group. As a result, the size of the cluster can indicate the popularity of the taxonomy, and the most frequent data in this cluster is likely to be the taxonomy candidate. We put a lot of effort into designing this crucial clustering process because it serves as the upstream of everything in this workflow. We’d like to share the details of how we achieve high accuracy in this critical process.
- First, we apply text normalization to clean the dirty data before pushing them into the clustering algorithm.
- Coming from DoorDash menu items, the raw annotation data has many strange and undesired formats, like metering parenthesis (like "(30 ozs)"), sequence number (like "c6."), and punctuations (like ";"). All these undesired parts will result in low cohesive clusters because they have no meaning in taxonomy.
- So we will first use regular expressions to normalize punctuation characters such as “&” to “and” and to delete all unnecessary characters. Then we apply functions like lower() and trim() to do additional text normalization and remove leading and following white space characters. After applying the text normalization, the size of clusters decreases more than 15%.
- Secondly, we fit the model on clean data using DBSCAN as the clustering algorithm, along with Levenshtein distance as the metric.
- Among many clustering algorithms, we chose the DBSCAN clustering algorithm considering the non-flat geometry of our dataset and the better performance of DBSCAN compared to other popular clustering algorithms.
- Because the existing metric doesn’t apply to the dataset of strings, we turn to the Levenshtein distance. Levenshtein will compute the edit distance between every pair of raw data and then transform the matrix of strings into the matrix of numbers, on which DBSCAN can fit a model.
- As a result, the raw annotation data are grouped in such a way that the entity names in the same cluster are more similar to each other then to those in other clusters. So the size of a cluster reflects the popularity of how it is chosen by people. Then, we can import the candidates that only have enough popularity into Graphite.
In the end, this would allow the taxonomy team to work on a handful of important candidates over processing several thousands of redundant and randomly distributed candidates.
Impact of only importing popular candidates and providing the gRPC API for releasing taxonomy
Our pipeline can automatically handle tens of thousands of raw data and import the top 50 frequent candidates into Graphite. It saves the taxonomy team hours every day filtering taxonomy candidates and exporting mature taxonomy versions. This means that they can be more efficient and focus more on expanding the taxonomy efficiently. Also, it provides the ML team with the single source of truth tables for taxonomy versions and they can easily consume and train models.
Overall, we could achieve eliminating hours of manpower per week with this effort and replace repetitive, error prone manual processes with automated processes and proper channels. Thus, our taxonomy team and ML team can focus on their own dedicated area to improve our user experience and meet consumers' needs of ease and convenience.
Optimizing and Migrating the Dasher Announcements System Out of Nimda
Author: Andy Jiang
Currently, DoorDash heavily relies on emails, SMS, and push notifications to communicate with Dashers; however, we are not able to control these channels, which prevents us from tailoring them to specific use cases. Because communications like emails and SMS can have delivery issues or rely on third party services, we have been slowly shifting towards in-app announcements, which help users get information and resources on our platform without having to leave our app. This communication is especially important for Dashers, our name for delivery drivers, because completing a Dash, our name for a delivery, might involve several notifications which are easier to digest in a single app experience. Unfortunately, we are unable to fully leverage in-app notifications as a Dasher communications channel due to the reliability concerns of the legacy tool. Here we will talk about how we were able to build a new web tool for the Dasher Announcements system and expand its capabilities.
Overview of in-app Dasher announcements
The in-app announcement system is used by operators to present messages to Dashers on the app. It shows important updates and can be located by clicking on the bell icon on the Dash screen of the Dasher app (see Figure 1 below).

The primary tool we use to create and deploy announcements to Dashers is with Nimda, which is an administration tool packaged and built within the Django framework.
The problems with the legacy Dasher announcement system
Our legacy in-app Dasher communication channel did not meet all of our needs. There were two main problems with the legacy system.

For one, the tool was unreliable with an unintuitive UI (see Figure 2). The use of announcements has outgrown Nimda as we continue to scale it to larger audiences, and operators frequently run into issues using the tool. Additionally, the tool was not designed for creating announcements targeting a large audience. The tool only allows operators to send announcements to at most 10,000 Dashers at once and selecting a large majority of the submarkets in the tool will cause the request to time out and not send anything. Operators are also unable to schedule the announcements and can only do one-time sends in real time, which makes this manual task less convenient and more prone to human error.

The second issue is that there's a bottleneck in the current schema in that the list of whitelist Dasher IDs is saved as a JSON blob within the data model. This is a problem since in order to determine relevant announcements to show Dashers, we would need to parse the whitelist JSON blob to determine if the Dasher ID is within it. This logic causes CPU spikes and high latency (> 600ms) when we do this with announcements containing a whitelist with thousands of IDs (see Figure 3).
How we were able to fix these problems
Before diving into our solution, it's important to understand the existing architecture of the Dasher announcement system.
Part 1: Implementing CRUD announcement gRPC endpoints

Looking at the architecture schema, previously Nimda handled all the operations related to updating/deleting/creating announcements and the mobile clients would simply send a request to the Dasher Mobile back-for-frontend (BFF) layer which would communicate with Dasher Service (Dasher microservice) to fetch the appropriate announcements to show Dashers.
So first we extracted the Dasher announcement from Nimda by implementing CRUD announcement gRPC endpoints in the Dasher Service (see Figure 4). This extraction allows us to have the capability to modify the underlying logic of the announcement operations to suit our use cases. We also leveraged asynchronous processing and granular control of the latency and timeout values to resolve the timeout issues with announcement creation.
Part 2: Implementing CRUD announcement gRPC endpoints

On top of this, to solve the bottleneck that causes high latency when listing announcements, we decided to cache the whitelist column when we created it (see Figure 5).

To give a little context, before using a cache, during the Create process, we take the new Dasher announcement object and store it in the Dasher database. Then, to list appropriate announcements to Dashers, we take all possible announcements that might be relevant to that Dasher and for each Dasher announcement object, we parse the whitelist and check if the Dasher ID is in the list (see Figure 6). Now, when doing this on whitelists with over 10,000 IDs for several announcements, this can cause extremely high latency and degrade our pods.

To improve these processes to reduce latency, we decided to cache the whitelist column when creating announcements. We cache the column using Redis hash with the key being the announcement ID and then grouping all the Dasher IDs in that whitelist under the key as fields to make it easier to get an announcement’s whitelist and also distinguish between cache miss vs not cached. Then, we would only need to check if the announcement_id + Dasher ID is in the cache by using a series of Redis commands to determine if an announcement should be shown to a Dasher (see Figure 7).
Part 3: Creating the new web tool

Next, to build the web tool, we onboarded announcements to Forward, which is an internal framework for managing entities with JSON forms, in admin-gateway. We did this onboarding by creating a new client for the announcement gRPC endpoints to communicate with the endpoints we created in the Dasher-service (which is our Dasher microservice), adding announcement GraphQL queries, defining JSON schema used by the frontend for rendering with a new Forward definition, and creating announcement specific permission groups (see Figure 8).
Finally, for the frontend portion, we utilized the EntityForm component with custom renderers and components from the internal Prism design system to build the UI in the web repo.
Results
With the new web tool (see Figure 9), we were able to reduce time spent by operators creating and deploying announcements from 8hrs to mins. Comparing the previous Nimda tool to the new web tool, Nimda offers a suboptimal user experience, with frequent timeout issues, and does not support large audience upload. However, this tool allows operators the ability to select countries rather than having to manually select hundreds of submarkets and support large audience uploads with whitelist Dasher IDs over 10,000.

Additionally, with our solution, we were able to remove announcement dependency on Nimda and resolve the bottleneck with the schema design by using Redis cache. This fixes the CPU spikes, high latency (> 600ms), frequent timeouts, and reduces top level (99 percentile) latency by ~30ms.
Building a Log Analysis Tool to Improve DashMart Operator Experience
By Kenny Chi
DashMart is a team under New Verticals created to deliver convenience store items to customers through an MFC (Micro-Fulfillment Center) – a DoorDash-owned warehouse. One of the main focuses of the DashMart engineering team over the past few months is improving DashMart operator clarity, allowing them to see each action within a facility: receiving items, stocking, moving, picking, etc.
Problems with bin-level inventory management
One might think that the path of an item through a DashMart is simple: receive, stock, pick, sell. Nevertheless, within those steps, there are many possible failure points: moving inventory into a different bin than specified, accidentally damaged inventory, menu sync issues, etc.
Currently, DashMart operators can view the total On-Hand (OH) quantity of an item in their facility. For example, the inventory manager shows that there are 24 bags of chips in both bins A and B. Upon taking a look at the bins, however, the operator realizes that there are only 24 in bin B. This is because 24 chips were “stocked” in bin A and later 24 units were confirmed to be in bin B.

In this case, an operator accidentally placed the items in the wrong bin when stocking (giving 24 to bin A), and another operator later adjusted bin B to have 24 bags of chips as well.
Diagnosing inventory discrepancies in DashMarts
Before this project, local operators and site managers were tasked with looking in online dashboards or asking an engineer in Slack to query the database for the history of an item in order to diagnose the discrepancy between what they see on the inventory website versus what they actually see in the bin.
In order to begin giving operators better insight into item history, we decided to create a new access point in the database, allowing operators to click on an item to view its history in that DashMart.

How we gave operators access to item logs
In order to expose item log data on the front-end website, we needed to create a new API endpoint to access and filter our previously write-only log table. Although the query was on a large table shared by all DashMarts, we were able to optimize the SQL query by filtering on two of the table’s stored indices: Facility ID and Item ID.
On the inventory webpage, the UI allows users to further filter the item’s activities by type, user, and date. This will allow operators to investigate many OH quantity inconsistencies, which will lower INFs (Inventory-Not-Found) across all DashMarts.
Impact
This project gives operators visibility into the data behind each of the actions at a DashMart. Instead of contacting a site manager or a DashMart engineer to manually look at the database, they are now able to get insight into where the items were last seen and their paths in the facility. With over 100 DashMarts open worldwide, this will greatly improve the ability for operators to view the inventory operations in a DashMart and ultimately independently take charge of their facility.